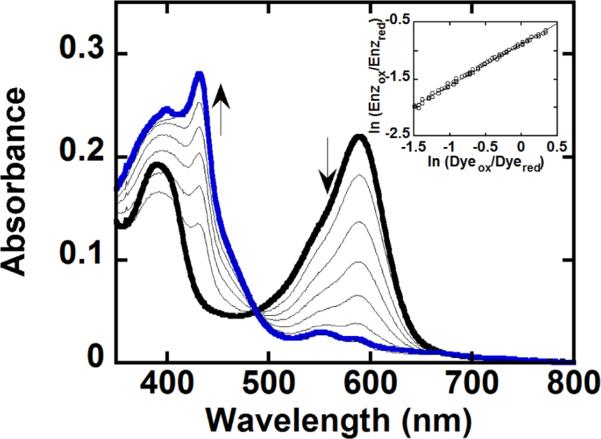
Figure 10.
Titration of DaCld and potassium indigo tetrasulfonate (dye) with xanthine oxidase used in the determination of its redox potential. An anaerobic solution of 2 μM Cld and 2 μM dye in 0.1 M potassium phosphate buffer (pH 7) with 1 μM benzyl viologen and 200 μM xanthine was reduced with an appropriate amount of xanthine oxidase. The spectra shown were recorded at 0, 50, 104, 158, 216, 266, 320, and 376 min. At time zero, the dye and DaCld are fully oxidized with maxima at 393 and 592 nm, respectively (—); at 376 min (blue line), they are fully reduced with a maximum at 432 nm for DaCld. The inset shows the logarithmic plot of the Nernst equation used to determine the reduction potential. The data were normalized to the concentration of Cld, and the wavelengths oft 432 and 416 nm were used to determine the reduction potential via the relationship ln(Enzox/Enzred) = 0.73 × ln(Dyeox/Dyered) – 0.88.

