

Abstract
Study Objectives:
To assess the relative roles and interaction of obstructive sleep apnea (OSA) severity and obesity on interleukin-6 (IL-6) and C-reactive protein (CRP) levels.
Design:
Cross-sectional cohort.
Setting:
The Icelandic Sleep Apnea Cohort.
Participants:
454 untreated OSA patients (380 males and 74 females), mean ± standard deviation age 54.4 ± 10.6 yr.
Interventions:
N/A.
Measurements and Results:
Participants underwent a sleep study, abdominal magnetic resonance imaging to measure total abdominal and visceral fat volume, and had fasting morning IL-6 and CRP levels measured in serum. A significantly higher correlation was found for BMI than visceral fat volume with CRP and IL-6 levels. Oxygen desaturation index, hypoxia time, and minimum oxygen saturation (SaO2) significantly correlated with IL-6 and CRP levels, but apnea-hypopnea index did not. When stratified by body mass index (BMI) category, OSA severity was associated with IL-6 levels in obese participants only (BMI > 30 kg/m2). A multiple linear regression model with interaction terms showed an independent association of OSA severity with IL-6 levels and an interaction between OSA severity and BMI, i.e., degree of obesity altered the relationship between OSA and IL-6 levels. An independent association of OSA severity with CRP levels was found for minimum SaO2 only. A similar interaction of OSA severity and BMI on CRP levels was found for males and postmenopausal women.
Conclusions:
OSA severity is an independent predictor of levels of IL-6 and CRP but interacts with obesity such that this association is found only in obese patients.
Citation:
Arnardottir ES; Maislin G; Schwab RJ; Staley B; Benediktsdottir B; Olafsson I; Juliusson S; Romer M; Gislason T; Pack AI. The interaction of obstructive sleep apnea and obesity on the inflammatory markers c-reactive protein and interleukin-6: the Icelandic Sleep Apnea Cohort. SLEEP 2012;35(7):921-932.
Keywords: Obstructive sleep apnea, obesity, visceral fat, interleukin-6, C-reactive protein
INTRODUCTION
Obesity is an important risk factor for obstructive sleep apnea (OSA).1 The common coexistence of OSA and obesity and their many shared pathways such as oxidative stress and inflammation complicates studies that try to determine the independent roles of OSA and obesity on inflammatory biomarkers and other pathophysiologic processes.2
Interleukin-6 (IL-6) and C-reactive protein (CRP) are key inflammatory biomarkers associated with an increased risk of atherosclerosis and cardiovascular disease (CVD).3 IL-6 stimulates production of the proinflammatory CRP in the liver (the main production site for CRP).4 The levels of both IL-6 and CRP are increased in obesity4 and visceral fat is thought to play an important role in production of proinflammatory cytokines.5,6 IL-6 release has been found to be twofold to threefold higher in visceral than subcutaneous fat, and 15–30% of circulating IL-6 levels come from fat tissue.5
Some studies have found independent associations between OSA and IL-6 and/or CRP levels7–20 and/or decrease with continuous positive airway pressure (CPAP) treatment.9,21–26 There are, however, conflicting studies that do not show independent associations of OSA and IL-6 and/or CRP levels17,27–41 or no change with CPAP treatment.20,27,37,42–44 The role of visceral fat in these earlier studies has not been adequately addressed.
Because obesity and OSA commonly coexist, it is important to understand how the two disorders might interact in determining inflammatory levels. It is conceivable that in the most obese patients the effect of OSA on inflammation is small because there is already very high stimulation by obesity. Conversely, it could be hypothesized that the effect of OSA is amplified by the increased number of inflammatory cells in fat in more obese patients.45
The aim of this study was to investigate simultaneously the association of OSA severity and obesity with IL-6 and CRP levels in a clinical cohort of OSA patients, and specifically to assess if the association of OSA and inflammation differs by the degree of obesity.
METHODS
All patients in whom moderate to severe OSA was diagnosed, at 5 sites in Iceland (with an apnea-hypopnea index [AHI] > 15 on original sleep study) and referred for CPAP treatment to the Landspitali University Hospital in Reykjavik from September 2005 - September 2008, were invited to join the study. This is the only site in Iceland providing CPAP therapy. More than 90% of eligible and approached patients agreed to participate. They are part of the Icelandic Sleep Apnea Cohort (ISAC). All patients in the study were first evaluated by pulmonologists who performed their diagnostic evaluation.
Measurements and Questionnaires
Study participants answered standardized questionnaires. Blood was drawn in the morning after sleep from the antecubital vein of fasting untreated participants. For further details, see supplement.
Whole Night Study
Participants had a sleep study while untreated with an Embletta type 3 portable monitor or an Embla 12-channel system (Embla™; Flaga Inc., Reykjavik, Iceland) recording the same channels. AHI and oxygen desaturation index (ODI, ≥ 4%) were calculated. The minimum SaO2 was defined as the lowest oxygen saturation reached during the study. Hypoxia time was defined as the number of minutes with oxygen saturation (SaO2) < 90%. Refer to the supplement for more information.
Magnetic Resonance Imaging
Patients underwent magnetic resonance imaging (MRI) of the entire abdomen using a 1.5-T scanner (Siemens Avanto, Germany). The adipose areas from each slice were summed to assess the total abdominal fat volume and visceral fat volume. Assessment of reliability by comparing results obtained on 2 occasions by 2 different observers showed negligible variance due to analysis procedures. See additional information in the supplement.
Statistical Analyses
Descriptive group comparisons were performed using one-way analysis of variance and chi-square tests for continuous and categoric variables, respectively. IL-6 and CRP were (natural) log-transformed for all analyses (Figure S1 in the supplement) based on assessment of residual error distribution, thereby permitting parametric analysis. The strengths of linear associations among biomarker values and obesity and OSA severity were assessed using Pearson and Spearman correlations. Statistical tests that compared the strengths of linear associations between biomarker values and different OSA and obesity metrics were produced using a nonparametric bootstrap re-sampling procedure,46 based on Pearson correlations, that properly accounted for repeated measures within each patient (n = 1,000 replications).
The primary analysis estimated the simultaneous association of OSA severity and obesity level with inflammatory response. The parameters of the multiple linear regression models included higher order and interaction terms to permit the association of OSA severity to depend on obesity in both linear and nonlinear ways. The predicted (i.e., expected) log biomarker value was represented by the following model: E(log(biomarker)) = b0 + b1*OSA + b2*(OSA)2 + b3*BMI + b4*(BMI)2 + b5*(OSA*BMI) + b6*OSA*(BMI)2 + b7*BMI*(OSA)2. Partial F tests were used to test hypotheses of interest, with P < 0.05 considered statistically significant. The simultaneous associations of various measures of sleep apnea and obesity severity on inflammatory biomarkers were explored. The potential confounding and effect modification of relevant covariates were assessed (see supplement for details). Additional sensitivity analyses were performed, including or excluding different groups of patients from the study. All of these analyses led to the same conclusions as the primary analysis. These additional analyses are included the supplement text as well as in Table S5. A power calculation with sample size justification is also included in the supplement.
The consent of the National Bioethics Committee, the Data Protection Authority of Iceland, and the Institutional Review Board of the University of Pennsylvania was granted for the study and written consent obtained from the research participants.
RESULTS
Demographics and Data on Sleep Disordered Breathing
The cohort is a clinical cohort reflecting the obesity levels and comorbidities found in the Icelandic sleep apnea population offered treatment for their disease. All participants (n = 523) were initially stratified by obesity severity based on BMI (BMI < 30 kg/m2, BMI ≥ 30 and < 35 and BMI ≥ 35) to provide a comparison of inflammatory response to increasing OSA severity across participants with varying degrees of obesity (Figure 1 and supplement). The range of OSA severity was different among the 3 BMI groups (Figure 2). That is, the highest BMI group had individuals with very high OSA severity (AHI > 80 and ODI > 65) not found in the lowest BMI group. Also, there were a few participants in the lowest BMI group with low OSA severity (AHI < 14 and ODI < 10, n = 24) not found in the highest BMI group. To avoid extrapolation beyond the experience of the data in subsequent analyses, those participants who had OSA severity not found in the other BMI groups were excluded (n = 69). In this way the range of AHI and ODI was kept comparable across obesity strata (selected a priori). This permitted valid application of analysis of covariance in which remaining differences in AHI and ODI could be subsequently adjusted for. The study cohort, therefore, included 454 patients across 3 BMI strata, all having AHI 14-80 and ODI 10-65. Among these study participants, complete MRI was obtained in 373 (82.2%). Out of the total cohort of 454 patients in analysis, 380 were males and 74 were females; 82.4% (61 of 74) of the women were postmenopausal and 4 were on hormone replacement therapy (HRT). Additional complementary analyses were done, including all participants in the cohort. The results of these additional analyses lead to the same conclusions (see supplement text and Table S5).
Figure 1.
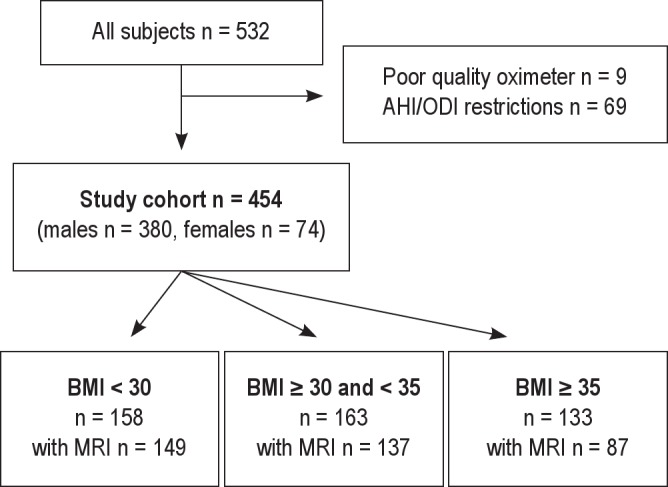
The study cohort. The selection of the cohort and division into BMI categories.
Figure 2.

The range of the apnea-hypopnea index (AHI, upper panel) and oxygen desaturation index (ODI, lower panel) within the 3 BMI categories in all patients considered (A and C) and the selected cohort with AHI 14-80 and ODI 10-65 only (B and D).
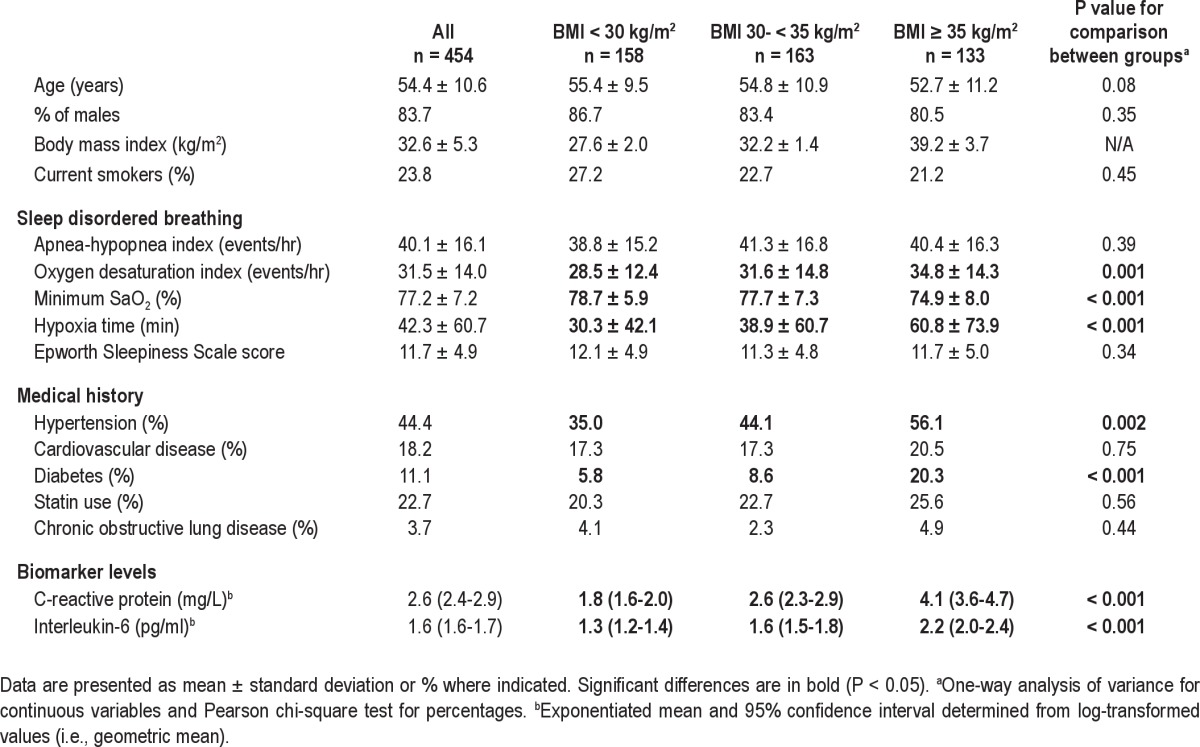
The 3 BMI groups were similar with regard to demographics, although the prevalence of hypertension and diabetes increased with increasing BMI (Table 1). Also with increasing BMI, the average degree of hypoxia increased even though ranges for AHI and ODI were restricted to be equal (AHI range 14-80 and ODI range 10-65). Additional information on the distribution of obesity measures and their correlation with OSA severity are provided in the supplement (Tables S1 and S2).
Table 1.
Demographics and sleep disordered breathing data in the whole cohort and by BMI i n the 3 categories
Relationship Between Inflammatory Biomarkers and Obesity Measures
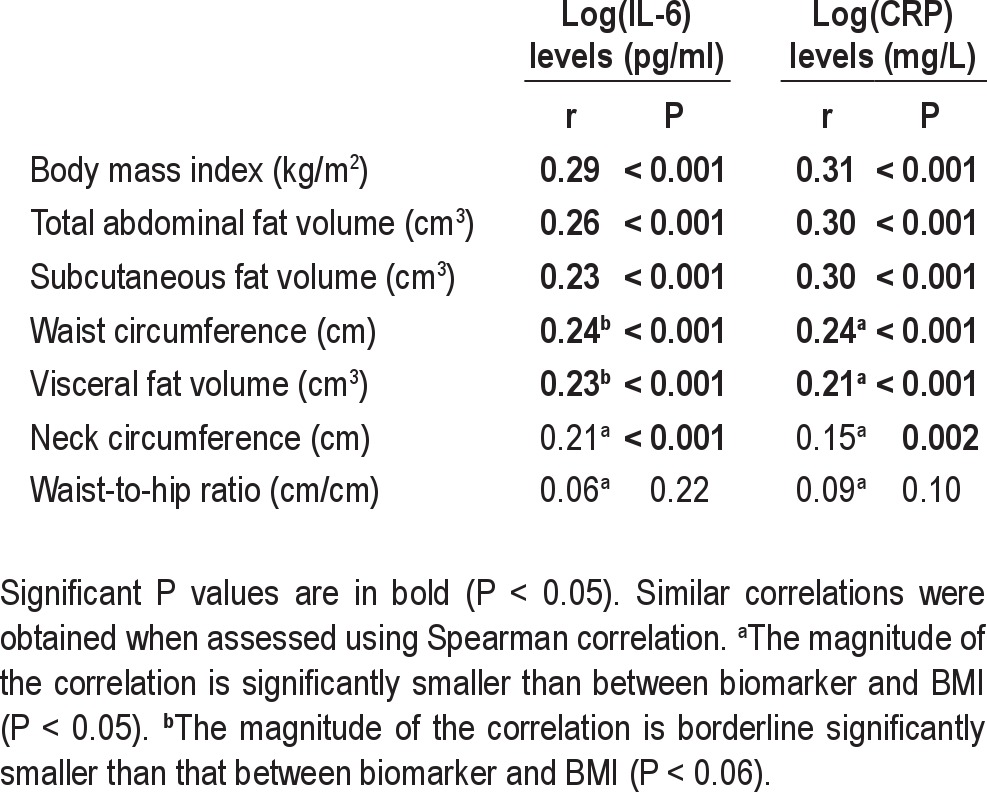
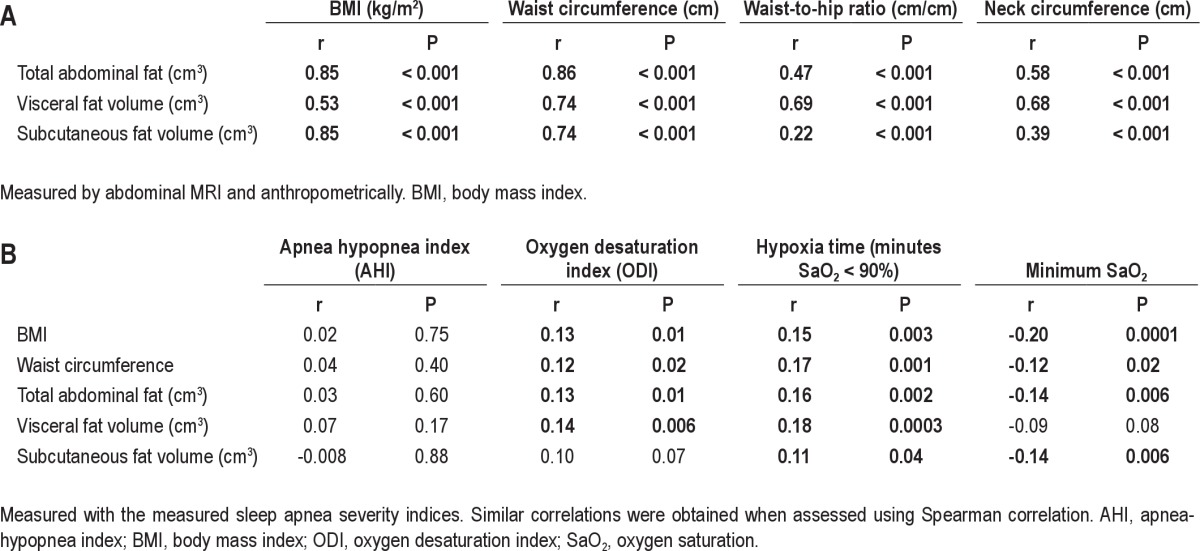
Both IL-6 and CRP levels increased significantly with increased BMI (Table 1, P < 0.001). Of all the different fat measures, the correlation between IL-6 and CRP levels and obesity level was highest for BMI (Table 2). The magnitude of correlation between BMI and CRP was significantly higher than for visceral fat volume alone, waist circumference, neck circumference, and waist-to-hip ratio in bootstrap analysis (n = 373, P < 0.05). However, BMI, total and subcutaneous fat volume had comparable magnitudes of correlation with CRP levels. Similar results were found for BMI and IL-6, i.e., the association with BMI was higher than for other fat measures. Total fat volume was significantly more highly correlated with both CRP and IL-6 levels than visceral fat volume. We repeated this analysis for nonobese patients only (see supplement). This association in only this group between fat measures and inflammatory levels was not significant. This likely reflects the low power and the more limited range of fat measures.
Table 2.
Pearson correlation coefficients between IL-6 and CRP levels in serum to various obesity measurements in all patients with MRI data (n = 373)
Relationship Between Inflammatory Biomarkers and Severity of OSA
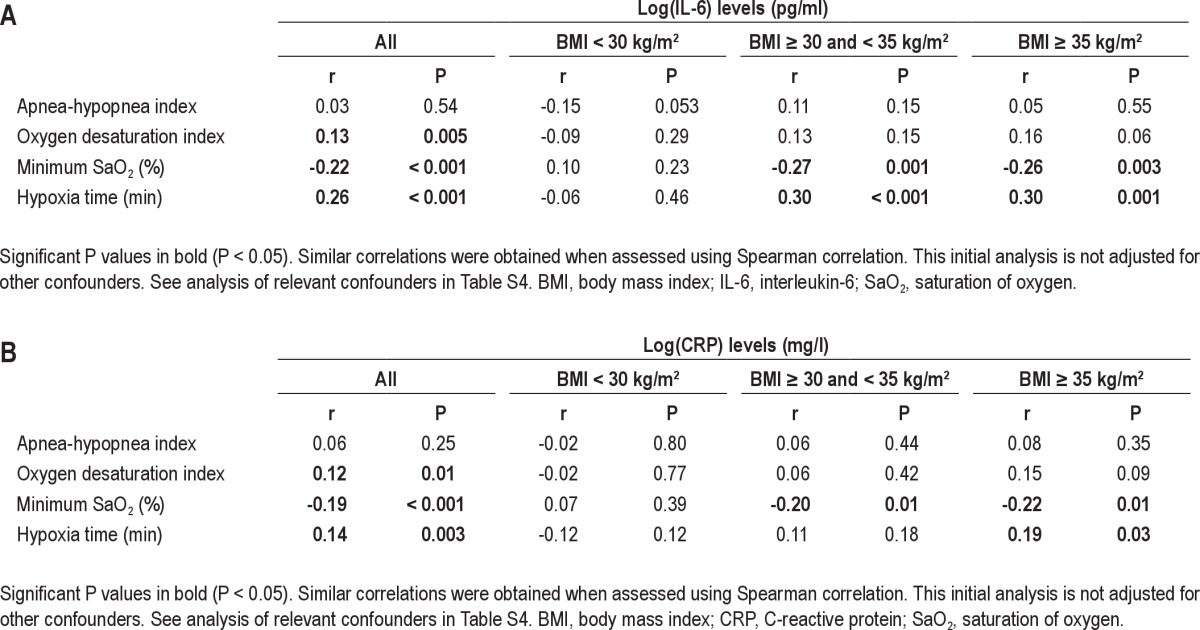
The correlation between IL-6 and CRP levels and 4 different OSA severity markers was assessed (AHI, ODI, hypoxia time, and minimum SaO2). The correlation for the whole cohort was significant for ODI, hypoxia time, and minimum SaO2. However, AHI was not significantly correlated with IL-6 or CRP levels (Table S3). When assessed within the 3 BMI categories, only minimum SaO2 and hypoxia time remained significantly associated with IL-6 and CRP levels and only in the 2 groups of obese patients, not in those with BMI < 30 kg/m2 (Figure 3 and Table S3). No relationship was found between IL-6 or CRP levels with subjective sleepiness (Epworth Sleepiness Scale score, data not shown).
Figure 3.

Correlation between minimum oxygen saturation (SaO2) and (A) IL-6 levels and (B) CRP levels within the 3 BMI categories.
IL-6 Levels: Role of Sleep Apnea Depends on Level of Obesity
To evaluate how obesity levels affect the relationship between OSA severity and IL-6 levels, multiple linear regression models for obesity and OSA severity, including interaction and quadratic terms, were used. BMI was used as the main obesity variable because it showed the highest correlation with both IL-6 and CRP levels (Table 2).
An independent association of OSA severity and BMI with IL-6 levels was found for all OSA variables tested, i.e., AHI, ODI, hypoxia time, and minimum SaO2 (P ≤ 0.01), as well as a significant interaction between OSA severity and BMI for AHI, hypoxia time, and minimum SaO2 (a trend for ODI, P = 0.10). A 3-dimensional plot was used to visually illustrate the combined role of OSA severity and obesity in IL-6 levels. Figure 4 shows that among obese patients, there were increases in IL-6 levels as OSA severity increased. However, the effect of changes in OSA severity clearly attenuated in less obese patients (e.g., BMI < 30 kg/m2). The apparent reversal of the role of OSA severity in IL-6 levels for the nonobese patients needs to be interpreted cautiously, as there is less statistical precision on the boundaries of the model. However, it is clear from Figure 4 that the increase in IL-6 levels for increasing OSA severity observed among the more obese is not found for the nonobese patients.
Figure 4.

Three-dimensional plots for IL-6 levels as a function of BMI and 4 OSA severity measures: (A) apnea-hypopnea index (AHI); (B) oxygen desaturation index (ODI); (C) hypoxia time (minutes with SaO2 < 90%), and (D) minimum oxygen saturation (SaO2). The significance of associations between IL-6 levels and sleep apnea severity, obesity and their interaction are shown below the figures. These analyses are not adjusted for other confounders.
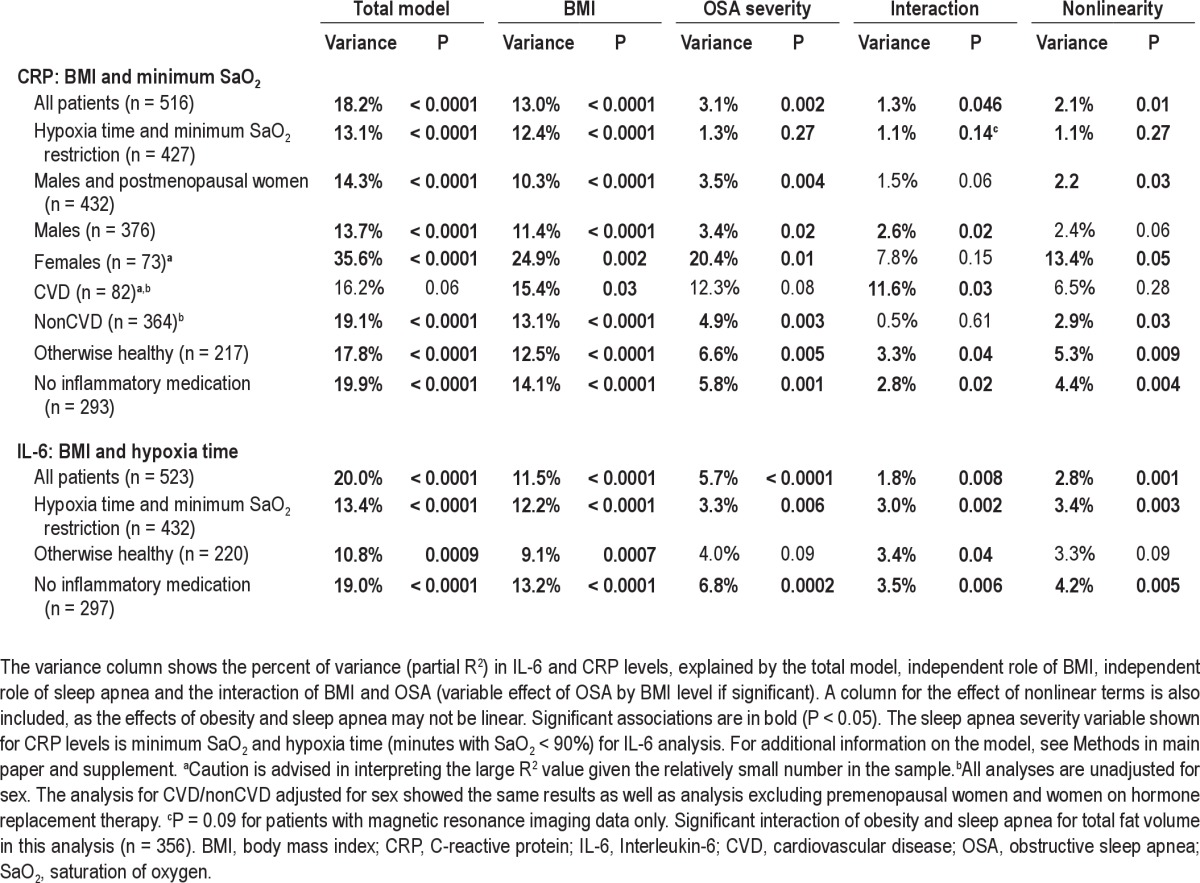
The overall model with BMI and hypoxia time explained 18.2% of the variance in IL-6 levels (P < 0.0001). Models including other measures of OSA severity explained less of the variance (13.5–17.0%, Figure 4) but all showed a significant association of both OSA and obesity with IL-6 levels. BMI explained the largest part of the variance in IL-6 levels (12.0%) and explained more than OSA as assessed by hypoxia time (8.6%). A significant part of the variance was explained by the interaction between OSA and BMI (3.7%) and nonlinear associations (4.7%). These results were thus in agreement with the simpler correlation analysis (Figure 3A), that the relationship between OSA severity and IL-6 levels depends on the degree of obesity.
We next assessed potential confounders: higher age; current smoking; presence of hypertension, cardiovascular disease, and diabetes; and visceral fat volume were all significantly associated with higher IL-6 levels (Table S4). These covariates individually increased the explained variance in IL-6 levels by 0.9–3.0%, but importantly, did not affect the interaction between OSA severity and obesity. Therefore, the variable association of OSA and IL-6 levels at different BMI levels (Figure 4) holds after adjusting for these covariates. Sex was not significantly associated with IL-6 levels.
The role of visceral and total abdominal fat as the main obesity variable were compared with the role of BMI in IL-6 levels in patients who underwent MRI (n = 373). The models with hypoxia time as the OSA severity variable continued to explain the highest amount of variance in IL-6. The model with visceral fat (and hypoxia time) explained 9.5% of the variance, total fat explained 12.4%, and BMI explained 14.2% for this smaller sample. However, adding visceral fat volume or visceral/subcutaneous fat ratio as a covariate to the BMI model did increase the IL-6 variance explained by 1.3–1.5%; i.e., there was a small additive association of visceral fat volume on IL-6 levels after adjustment for BMI (see results in Table S4 in supplement). Finally, waist circumference was tested as the main obesity variable and found to explain less of the variance in IL-6 levels than did BMI (15.9% versus 18.2%, n = 454), similar to the simpler correlation analysis (Table 2). All of these analyses show an independent association of sleep apnea and IL-6 levels. In addition, the association of sleep apnea severity and IL-6 levels was found to depend on obesity level, for both total fat volume and waist circumference similar to the results for BMI.
CRP Levels: Role of Sleep Apnea Depends on the Level of Obesity
The role of OSA severity and obesity level on CRP levels was assessed in the same manner as for IL-6. A multiple linear regression model with BMI was tested with a single OSA variable at a time. The variance in CRP explained by OSA severity and BMI was highest for the minimum SaO2 (15.6%), the only OSA severity index that had an independent association with CRP levels. BMI was significantly associated with CRP level in models using all 4 measures of OSA severity (Figure 5). However, no significant interaction was found between OSA severity and obesity level. The relative importance of OSA severity was smaller for CRP than for IL-6 (partial R2 3.7% versus 8.6%) and considerably smaller than the statistical effect of BMI (11.3%) on CRP levels.
Figure 5.

Three-dimensional plots for CRP as a function of BMI and 4 OSA severity measures: (A) apnea-hypopnea index (AHI); (B) oxygen desaturation index (ODI); (C) hypoxia time (minutes with SaO2 < 90%); and (D) minimum oxygen saturation (SaO2). The significance of associations between CRP levels and sleep apnea severity, obesity and their interaction are shown below the figures. These analyses are not adjusted for other confounders.
Of the different covariates tested, only exercise was significantly associated with CRP levels, decreasing the levels (Table S4). General use of statins was not associated with CRP levels. However, when looking separately at the 2 statins mainly used, i.e., atorvastatin and simvastatin, atorvastatin had a borderline association with decreased CRP levels (P = 0.053). Excluding participants on these medications affecting inflammatory levels did not change our findings (Table S5). However, the relationship between OSA and BMI on CRP levels was not the same in those with and without CVD (P = 0.01 for interaction with the OSA and obesity level). Borderline significance was also found for a sex difference (P = 0.053). However, this sex difference was no longer found after excluding premenopausal women (n = 13) and women on HRT (n = 4) from the main analysis. After this exclusion, independent associations of OSA and obesity with CRP levels and an interaction between the two were found for the entire cohort similar to the correlation analysis in Figure 3. However, CVD continued to interact with obesity and OSA, indicating that the role of OSA severity on CRP levels depends not only on obesity but may also be affected by other covariates such as sex, menopausal status, and CVD. For subgroup analysis by sex and CVD, see supplement text and Table S5.
The role of visceral and total abdominal fat as the main obesity variable were compared with the role of BMI in CRP levels (n = 373, with MRI). The models with minimum SaO2 continued to explain the highest amount of variance in CRP (again, the only OSA severity measure that was significant). Models including visceral fat as the obesity variable explained less of the variance in CRP levels than BMI did (6.9% versus 11.9%, respectively, n = 373) and total abdominal fat explained 12.5%. No additional association of visceral fat with CRP levels was found after adjusting for BMI. Also, the association of waist circumference and CRP was tested separately and found to explain less of the variance in CRP levels than BMI did (13.2% versus 15.6%, n = 454). Again, an independent association of sleep apnea and CRP levels was only found using minimum SaO2 saturation as the OSA variable.
DISCUSSION
Sleep apnea severity is an independent contributor to explaining variance in IL-6 levels. For CRP levels the association among measures of OSA severity is with minimum SaO2 only, a measure of hypoxia. The association of OSA severity and IL-6 levels depends on how obese the patient is and is only found in obese patients (BMI ≥ 30). The same is true for CRP levels in males and postmenopausal women. Indeed, in nonobese patients, there is no association of IL-6 and CRP levels with OSA severity, assessed as AHI or different measures of hypoxia during sleep.
The Role of Fat
The current study demonstrates that total fat measures such as BMI and total abdominal fat volume are significantly more associated with IL-6 and CRP levels than visceral fat alone within an overweight and obese apneic population. Visceral fat volume is a significant predictor of IL-6 levels after adjusting for BMI, but explains only a small additional amount of the variance in IL-6 levels (1.3%). No additional association of visceral fat volume was found for CRP levels, after adjusting for BMI. As previously stated, visceral fat has been shown to release more IL-6 than subcutaneous fat.5,6 However, previous smaller human studies assessing the role of total fat versus visceral fat in circulating inflammatory levels show contradictory results.47–52 The findings of our study are in agreement with findings from the large Framingham cohort,53 that total fat is more associated with inflammatory biomarkers than visceral fat alone. The strength of the associations between the inflammatory markers and different fat measures in the Framingham study are remarkably similar to the current study despite the patients in our current study being considerably more obese. The Framingham study also found, in agreement with the results of this study, that after accounting for BMI, a small additional relationship between visceral fat and increased IL-6 levels is found; in addition, the same was noted for CRP levels, not found in our study. The current study therefore extends the results of the Framingham study, showing that the stronger association of IL-6 and CRP with total fat compared with visceral fat and the small additional role of visceral fat after adjustment for BMI is true, even for patients who are quite obese.
The Role of Sleep Disordered Breathing
Previous studies on the role of sleep disordered breathing in adults on the levels of the inflammatory markers IL-6 and CRP have contradictory findings, as is summarized in the Introduction.7–44
It is difficult to reconcile the different results of these previous studies but many of these studies have had a low number of patients (n ≤ 30 per group).7–9,11–14,19,20,25,27,28,31,35–40,43 In case-control studies, control patients were often less obese than those with apnea (average BMI difference of 2-16 kg/m2),8,9,11,12,19,20,27,29,33,34,36,39,40 younger (average age difference of 5-16 years between groups),8,11,12,17,19,20,33,34,39,40 with fewer comorbidities,11,12,19,34 and smoked less.8,11,28,33 Most studies also do not include females or have a very low number of females. (Refer to Strengths and Limitations of the Study Design section in the following section). One study compared a mixed group of OSA males and females with a female-only control group.38 Furthermore, there are potential differences due to different ethnicities in different studies, as Asians show markedly different etiology in the onset of obesity-related morbidities such as type 2 diabetes compared with Caucasians,54,55 and they may have a different susceptibility to OSA56,57 and a different proinflammatory profile to Caucasians and African Americans.58 These contradictory findings in the earlier literature indicate the likely heterogeneity in the inflammatory response in patients with OSA and the need to address specifically whether obesity levels and the presence of comorbidities influence how OSA affects CRP and IL-6 levels. Some studies did, however, start to address the issue of whether obesity level influences how OSA affects inflammatory levels. The role of sleep apnea and obesity on IL-6 levels was first addressed by Vgontzas et al.40 in a case-control study. However, in this study the authors did not control for BMI. In two subsequent studies,19,20 Vgontzas et al. compared obese patients with OSA with both obese and nonobese control patients and found the highest IL-6 levels in the obese patients with OSA. Although there was an overall significant difference between the three groups in the levels of IL-6, the difference between obese control patients and obese patients with OSA was not significant. Nonobese patients with OSA were not studied.19,20 A study by Barcelo et al.28 compared obese and nonobese patients with OSA to nonobese control patients and found no difference in CRP levels between nonobese patients with OSA and nonobese control patients. However, obese control patients were not included in the study. Thus, all of these studies lack 1 cell of the 2 × 2 factorial design (obese patients with OSA, obese control patients, nonobese patients with OSA, and nonobese control patients). The results are compatible with our findings, i.e., there is an independent role of OSA in obese patients but not in nonobese patients.
The current study, the largest performed so far on IL-6 levels and sleep apnea, supports the independent role of OSA on IL-6, i.e., above and beyond the role of obesity per se as has been shown in some of the previous studies.7,9,18–20 We also demonstrate that the independent association of OSA and IL-6 levels depends on the degree of obesity, i.e., there is an obesity-by-OSA interaction such that OSA severity is associated with IL-6 levels in obese patients only, not in those with BMI < 30 kg/m2. This is a novel finding. The association between IL-6 levels and OSA severity is strongest for hypoxic measures, not the number of apneas and hypopneas. An independent association of OSA severity with CRP levels, which depends on obesity level, is found but only for minimum SaO2, not AHI, ODI, or hypoxia time, making the evidence for a role of OSA in CRP levels less robust than for IL-6 levels. Menopausal status and HRT affect this relationship between sleep apnea and CRP levels, possibly due to their effects on fat distribution.59,60 The presence of CVD is also an important factor influencing the relationship between OSA severity, obesity, and CRP levels. This requires further study. Our results are in agreement with the largest study so far on the relationship between AHI level and CRP (n = 907), showing no independent associations of AHI and CRP levels after adjustment for BMI, age, and sex.30 Our results are, however, in disagreement with another study15 in Asian patients showing independent associations of AHI and CRP levels, adjusting for BMI and visceral fat. It is conceivable that there are ethnic differences that affect this relationship and these need to be studied in depth.54–58
The role of OSA severity appears to be more pronounced for IL-6 levels than CRP levels. The reason for this difference is likely that CRP is much more stable than IL-6 with a half-life of 19 hr and does not have a circadian rhythm, unlike IL-6.3,61,62 The immediate effect of respiratory events during the night in patients with OSA will increase IL-6 levels, when assessed in the morning after sleep. In contrast, there is a much longer time constant for changes in CRP. Thus, the immediate effect of events during sleep will be less marked for CRP and the levels will reflect not only what happened during sleep but across the entire 24-hr period.
The variable association of OSA severity with IL-6 levels and CRP levels, depending on obesity, may be mediated by a difference in the inflammatory response to events occurring in sleep apnea between nonobese and obese patients. The likely reason for this difference is the increased numbers of nonfat cells such as macrophages, secreting IL-6, that are found in adipose tissue of obese patients.6,45,63 This will allow for more production of IL-6 from adipose tissue in response to the hypoxic insult that occurs in OSA. Another potential explanation is the decreased lung volume in those who are more obese,64 causing comparatively larger desaturations in more obese than in leaner patients with the same durations of apneas.65 However, the strongest relationships were with the hypoxia variables themselves, making this explanation of our results less likely. A significant association of general statin use and inflammatory levels was not found. However, atorvastatin, which has a longer half-life than simvastatin, had a borderline significant association with lower CRP levels in agreement with some previous findings,66 but not all.67,68 No association of statins and IL-6 levels was found, in agreement with previous studies.67,68
Strengths and Limitations of the Study Design
The strengths of this study include the large number of participants, the broad distribution of obesity, and the high proportion of severely obese participants. The large sample size permits multiple linear regression modeling with interaction and higher order terms to investigate the complex interaction between OSA and obesity and hence provides new insights.
The large sample size of this study was such that it was possible to assess associations separately in overweight, obese, and severely obese patients. The ISAC cohort is a clinical cohort, with no exclusion of the relevant OSA comorbidities. We believe this to be a major strength of the study as by investigating only otherwise “healthy” patients with OSA, the study results may be biased by studying a subpopulation of patients with OSA. Our results suggest a differential response in CRP levels to sleep apnea depending on the presence or absence of CVD. These results require further study. Including patients with comorbidities does, however, complicate the analysis as the presence of cardiometabolic disease will affect inflammatory levels. In our study, different medical conditions and medications were assessed as potential confounders and sensitivity analyses were performed, excluding patients on antiinflammatory medications, as well as all patients with known hypertension, diabetes, and CVD. These additional analyses confirmed our findings.
Another strength of the study is the state-of-the-art MRI technology for measuring total abdominal fat volume. The MRI and sleep studies were all read by centralized laboratories with very high reliability of measurement (see supplement).
Limitations of this study include the relative lack of females than males as a consequence of patients in Iceland in whom OSA was diagnosed. We do, however, have a total of 74 females, which is still quite a high number, especially in comparison with many earlier studies in the field, where only 8 of 27 studies on CRP levels7–17,21–24,26–35,42,43 include a significant total number of females (n = 43 - 407). Also, interestingly, only 2 of these studies specifically looked at sex differences21,29 whereas the others do not.11,16,22,30,33,34 None of these studies adjusted for menopausal status and only 1 study adjusted for HRT in women.30 For IL-6, the largest study so far in the literature (n = 155 patients36) does not report whether females are included in their study and all other studies either do not include females9,19,20,25,27,37,42,44 or have a negligible number of them in their analysis (n = 1-20).17,18,35,36,38–40,43 Our analysis did not allow us to compare the effects of menopause on inflammatory biomarkers because most of the women were postmenopausal. Studies addressing specifically the role of OSA on inflammatory biomarkers in women taking into account their menopausal status are needed, although sleep apnea is much less common in premenopausal women.69
In the ISAC cohort there is a lack of patients with mild OSA. Therefore, a potential effect of OSA severity on CRP levels from mild to moderate disease, with a plateau above this level of severity, as has been described for other biomarkers,70 cannot be excluded. The lack of control patients without OSA in this study is, in our view, not a major limitation as comparing patients with OSA to control patients was not the intent of this study. Rather, we sought to evaluate within a clinical cohort of patients with OSA the relative role of obesity and sleep apnea. Previous studies that included a control group have shown that visceral fat volume is more associated with the presence of OSA than other measures of obesity, such as BMI or subcutaneous fat.19,20,71–74 However, many of these studies share the same limitation regarding control groups as mentioned previously (differences in BMI, age, etc. between cases and control patients). Finding control patients who do not have OSA, with the obesity levels found in this study and matched for comorbidities and other factors, is very challenging as the OSA literature shows. Instead, our analysis made use of the wide range of obesity and OSA severity within a clinical cohort of individuals with sleep apnea to address our primary question, i.e., the independent roles of obesity and OSA severity and their interaction on inflammatory biomarker levels. Also, our analyses assessed the role of various confounders that may influence how sleep apnea is related to inflammatory levels. Our sample size is sufficient to do so. We would, however, like to emphasize that our study was cross-sectional; therefore, findings of significant associations are not sufficient to infer causality.
In this study portable type 3 monitors were used. The study therefore lacks electroencephalographic recording and assessment of arousals. However, the validity of the Embletta portable monitoring system for assessing sleep disordered breathing has been shown when compared with polysomnography75 and the new recommended American Academy of Sleep Medicine 2007 scoring rules do not require arousals to assess hypopneas as some previous scoring rules did.76
Another potential limitation is that the blood for assessment of IL-6 and CRP, while drawn in untreated patients, was not drawn the morning after the sleep study. Therefore, night-to-night variability in OSA severity added some noise to the data. However, this variability has been found to be smaller when assessed in home studies and in patients with severe OSA.77,78 Also, the assessment of IL-6 and CRP is from a single blood draw, not overnight measurements performed before and after sleep.2 Given the known diurnal variation of IL-6, we took the sample at the same time of day in all patients. We did so after sleep because this time of day will be most sensitive to the sleep disordered breathing events. Three small OSA studies performed using more than a single blood draw have indicated that if a difference in IL-6 levels is found because of OSA, these changes can be found in the morning blood sampling.19,20,25
The highest dropout rate for the MRIs was in the most obese category, as these patients had more problems with MRI assessment than those who were less obese. However, even in the most obese group, MRI assessments of abdominal fat were obtained in 87 of 133 patients, permitting meaningful analyses.
CONCLUSIONS
This study is, to our knowledge, the first to show that the association of OSA and inflammatory biomarker levels depends on obesity level, with a more pronounced role of OSA in patients who are obese. There is no evidence of an association of OSA and inflammatory biomarkers in patients with BMI < 30 kg/m2. These results emphasize the complicated relationship between OSA and obesity. Also, this study shows that in those who are overweight and obese patients with apnea, total fat volume is associated more strongly than visceral fat per se with IL-6 and CRP levels.
DISCLOSURE STATEMENT
This was not an industry supported study. Dr. Pack received an endowed chair in sleep medicine that was created by funds donated by the Phillips Respironics Foundation. Dr. Maislin is a biostatistician for Biomedical Statistical Consulting. The other authors have indicated no financial conflicts of interest.
ACKNOWLEDGMENTS
The authors are grateful to Sigrun Gudmundsdottir, Lovisa Gudmundsdottir, Magdalena Osk Sigurgunnarsdottir, Kristjáan Andri Kristjáansson, Matthew Thorne-Fitzgerald, Robert Hachadoorian, Nicholas Jackson and the other staff at the Sleep Centers of Landspitali University Hospital and the University of Pennsylvania who helped assemble and analyze the data. The authors also thank Mr. Daniel Barrett and Ms. Jennifer Montoya for their help in preparation of the manuscript.
This work was supported by the NIH grants HL072067 for “A Family Linkage Study of Obstructive Sleep Apnea”, HL094307 on “Endophenotypes of Sleep Apnea and Role of Obesity”, the Eimskip Fund of the University of Iceland and the Landspitali University Hospital Research Fund.
SUPPLEMENTAL MATERIAL
EXPANDED METHODS
Measurements and Questionnaires
The questionnaires included demographics, general medical history including presence of hypertension and cardiovascular disease; pharmacologic treatments coded according to the Anatomic Therapeutic Chemical drug classification system (http://www.whocc.no/atcddd), Epworth Sleepiness Scale1; and lifestyle questions regarding exercise, alcohol consumption, and smoking. Measurements of height, weight, neck, waist, and hip circumference were performed using standard procedures.
Whole Night Sleep Study
Type 3 monitoring was used for the sleep study (Embla™; Flaga Inc., Reykjavik, Iceland). Nasal airflow was recorded through a cannula (nasal pressure transducer). Chest and abdominal movements were measured by respiratory inductive plethysmography belts. Pulse and oxygen desaturation were measured by a finger probe oximeter based on a 4-beat exponential average (Flex Sensor 8000J and XPOD oximeter, Flaga Inc.) and body position and activity by a sensor placed on the chest. The type 3 monitoring is what is used clinically in Iceland to determine sleep apnea. However, all patients are also screened for other sleep disorders using questionnaires and an interview with a physician. Patients believed to suffer from sleep disorders other than sleep apnea then have a polysomnographic study or additional periodic leg movement measurement instead of a simple type 3 monitoring for sleep apnea. Patients with obesity-hypoventilation syndrome would be detected by evaluation of their serum bicarbonate level and arterial blood gases. Such patients were not included in our study.
To be included in the study cohort, a patient had to have an apnea-hypopnea index (AHI) > 15 according to the original diagnostic study by one of the five sites in Iceland performing sleep studies and be on the continuous positive airway pressure (CPAP) waiting list. All sleep studies were re-read by a centralized scoring laboratory using the Somnologica Studio (Embla™) software and used for the analysis. More than 4 hr of a scorable oxygen saturation (SaO2) signal was needed for a sleep study to be scored. Patients were instructed to switch the recorder off when they woke up in the morning. Scoring was started 30 min into the recording and ended 5 min before the study recording was completed. Events were scored according to the following definitions: a classification of hypopnea required a ≥ 30% decrease in flow with ≥ 4% oxygen desaturation or a ≥ 50% decrease in flow for ≥ 10 sec with a sudden increase in flow at the end of the event. A classification of an obstructive apnea required a ≥ 80% decrease in flow for ≥ 10 sec. The AHI was defined as the number of apneas and hypopneas per hour. An oxygen desaturation index (ODI) was calculated as the number of oxygen desaturations ≥ 4%/hr. The minimum SaO2 was defined as the lowest oxygen saturation reached during the study. Hypoxia time was defined as the number of minutes with SaO2 < 90%. Minimum SaO2 is an outcome variable that can be nonrobust given its reliance on a single value. To mitigate against this and other potential data problems, the analysis dataset was subjected to routine statistical screening and checked by the human scorer for accuracy. This included assessment of descriptive statistics including minimum and maximum values as well as graphic assessment of distributions of observed variables and standardized residuals from multivariable statistical models. Additionally, preprocessing was performed by the Somnologica software to filter the SaO2 for outliers and erroneous values. These settings were the following: 1) If the measured SaO2 saturation levels dropped below 50%, those values were not included in the SaO2 analysis but rather marked as artifacts. The maximum allowed fluctuation in the SaO2 signal was 10% change per sec. Values exceeding this fluctuation were ignored in all calculations and marked as an artifact. Given these quality control procedures, we are confident that the risk of our dataset containing influential outliers is low.
Measurement reliability of the scoring of the AHI and ODI was assessed based on intraclass correlation coefficient (ICC) analysis. The ICC for n = 51 randomly selected recordings scored on 2 different occasions was 0.99 for AHI and almost 1.00 for ODI. These data indicate essentially ignorable variability due to scoring.
Magnetic Resonance Imaging Assessment
All patients underwent magnetic resonance imaging (MRI) of the abdomen using a 1.5-T scanner (Siemens Avanto, Germany) with a body coil. Axial, coronal, and sagittal images of the abdomen were acquired with a magnetic resonance gradient echo pulse sequence. The abdominal compartment was defined from the superior aspect of the xiphoid process to the anterior portion of the L5-S1 interspace. MRI was performed in 1-cm contiguous intervals (slice thickness of 1 cm) through the abdominal compartment. Therefore, the exact number of slices varies between patients but was on average ± standard deviation 30.1 ± 2.3 slices. Using image analysis software (Amira 4.1.2, Mercury Computer Systems, Chelmsford, MA), each slice of the abdominal MRI scan was manually examined. The visceral fat and subcutaneous fat volumes were all calculated with the same analysis techniques. The fat was first segmented and then quantified. Visceral and subcutaneous adipose tissue (VAT and SAT, respectively) were quantified by defining specific pixel grayscale values for an area and using that value to continue to define fat throughout the specific region. All borders between fat and the liver, kidneys, stomach, bowels, etc. were very clearly differentiated by large changes in the pixel grayscale value. Within the defined boundaries, only an artifact (by movement or foreign body) caused difficulty in the analysis. In these cases, the patient was excluded from the MRI part of the study (n = 31).
The adipose areas from each slice were summed across the entire abdominal compartment and total subcutaneous and visceral fat volumes were calculated in cm3 for the abdominal compartment as well as total abdominal fat volume, i.e., sum of visceral and subcutaneous fat. MRI and computed tomography (CT) using the same slices or regions have previously been shown to produce very comparable abdominal imaging results.2–5 One of the benefits of MRI over CT is the lack of ionizing radiation.4 Also, CT cannot estimate ectopic fat and may have errors in estimating tissue and organ boundaries.4 However, respiratory motion, blood flow, and intestinal movements cause more artifacts in MRI than CT, possibly causing a higher coefficient of variation for repeated visceral fat measurements.4,5
Measurement reliability of the VAT and SAT volumes was assessed based on ICC analysis. Two trained raters determined VAT and SAT volume for MRIs obtained from 10 randomly selected patients on 2 separate occasions. ICC values for VAT volume and SAT volume were both 1.000. These data indicate essentially ignorable variability related to data analysis.
Blood Sampling
Specimens were collected in SST vacutainers (Greiner, Kremsmüunster, Austria) and allowed to clot at room temperature for 20 min before centrifugation for 10 minutes at 3,000 rpm. After separation, the serum samples were stored at −20°C.
Enzyme-linked immunosorbent assay was used to determine serum interleukin-6 (IL-6) (R&D Systems, Minneapolis, MN). The IL-6 assay was performed according to the recommendations of the manufacturer. The lower detection limit of the assay is 0.70 pg/mL. Patient levels ranged from 0.21–13.90 pg/mL. Forty-eight patients had levels below 0.70 pg/mL and their values were treated in the analysis as 0.70 pg/mL. Despite the lower bound restriction of 0.70 pg/mL on the distribution of IL-6 values, the multiple linear regression model residuals continued to satisfy parametric assumptions after log transformation of IL-6. IL-6 levels were measured in duplicates and samples, where results varied more than 15%, were reanalyzed. The intraassay coefficient of variation for all duplicate samples was 5.0%. Using control samples, the interassay coefficient of variation of the IL-6 assay was found to be 11.2% at a concentration of 2.18 pg/mL and 9.2% at a concentration of 0.68 pg/mL.
Serum high-sensitivity C-reactive protein (CRP) concentrations were measured on a Kone 30 analyzer using a commercially available latex-enhanced immunoturbidimetric assay from Roche Diagnostic Systems (Mannheim, Germany). The lower detection limit of the assay is 0.1 mg/L. Patient levels ranged from 0.38–53.87 mg/L. Thus, all patients had a CRP level greater than the lower limit of detection. The interassay coefficient of variation for the CRP measurements was 1.1% at a concentration of 3.73 mg/L and 1.9% at a concentration of 0.68 mg/L (control samples were analyzed each day). CRP measurements were missing for 5 patients.
Statistical Analyses
The multiple regression approach to the analysis was described in the main text as the general model used. The modeling approach used is analogous to Response Surface Modeling (RSM)6 in that the focus was on understanding how degree of obesity influences the association of sleep apnea and inflammatory response rather than simply on whether one specific group differs from another. Squared partial correlations were used to evaluate the relative importance of various model factors. The squared partial correlation is the proportion of unexplained variance that is eliminated when the factor in question is added to the model.
The sleep apnea severity indices (AHI, ODI, hypoxia time, and minimum SaO2) were not log-transformed for the analysis because they were used as predictor variables, not outcome variables in the models. We checked the model residuals and they were adequately normally distributed (because we log-transformed the biomarker outcomes). All other model diagnostics for residual error indicated that the statistical assumptions of the linear regression model were met. Statistical power analyses revealed that with n = 454 (n = 373 for analyses involving MRI-derived measures), there is ≥ 96% (≥ 91%) statistical power to reject the null hypothesis that the overall specified model mentioned here explains no biomarker variance, when ≥ 5% of the variance is explainable when testing is based on an F test with α = 0.05. The power of the partial F tests for obesity and OSA was also assessed. If the terms that contain obesity only explain 5% of the variance, then ≥ 90% power is obtained if adding OSA and obesity by OSA interaction increases the explained variance from 5% to 8.4% for the n = 454 cohort (from 5% to 9.1% for the n = 373 sample with MRI variables). An evaluation of the effect modification of covariates (interaction effects) shows that if the original model explains 8% of biomarker variance, then effect modification must explain an additional 2.9% (3.5% for models using MRI variables) to obtain at least 80% power to reject the hypothesis of no effect modification. Therefore, our study may not be sufficiently powered to detect even more subtle effect modification.
The influences of a selected set of covariates were evaluated for confounding factors and effect modification. Confounding was assessed by adding the covariate to the model as a main effect and seeing if the significance of factors involving sleep apnea and obesity changed substantively. Effect modification arises when factors interacted with OSA and/or obesity to amplify or attenuate the inflammatory response. The independent role of these covariates was not the subject of this study, but the nature of significant independent associations was noted. A significant covariate that was not a confounder merely altered the variability explained by the model but did not change its shape or interpretations involving the obesity OSA interaction. Covariates assessed included sex, age (10-yr intervals), excessive alcohol consumption (≥ 7 drinks/wk for females and > 14 drinks/wk for males), current smoking (smoking or tobacco use during the past month), pack-yr of smoking (quartiles; 0 pack-yr, > 0–17 pack-yr, 17–35 pack-yr, and > 35 pack-yr), cardiovascular disease (doctor diagnosis of coronary artery occlusion [myocardial infarction or heart attack], heart failure and/or stroke), hypertension (doctor diagnosis of hypertension and current hypertensive medication), diabetes (doctor diagnosis), regular exercise (yes/no) as well as the use of statins, both any use of statins (n = 103) and specifically the 2 most widely used in the study, atorvastation (n = 49) and simvastatin (n = 39). A total of 15 patients were on other statins. Chronic obstructive pulmonary disease was not assessed as a confounder because it and/or emphysema was diagnosed in only 19 patients. Women were considered postmenopausal if they reported having stopped menstruation for ≥ 6 mo. A P value ≤ 0.05 was considered significant for all analyses.
Sensitivity analyses with all patients included (n = 516-523, Table S5, all patients) were performed as well as further exclusions based on comparable hypoxia severity (hypoxia time and minimum SaO2 restriction, Table S5). We then repeated the primary analysis excluding premenopausal women (n = 13) and women on hormone replacement therapy (HRT, n = 4) (Table S5, males and postmenopausal women, n = 432 in analysis). We also repeated the primary analysis excluding all patients on antiinflammatory medications, statins (n = 103), corticosteroids (systemic n = 8, nasal n = 16, and inhalants n = 9), nonsteroidal antiinflammatory medications (n = 27) and immunosuppressant medications (n = 3), as well as premenopausal women and those on HRT (a total of n = 297 in analysis, Table S5, no inflammatory medication). Only statin medication was assessed specifically as a covariate as the number of patients on each of the other medication types was relatively low (Table S4). Finally, an additional sensitivity analysis including only “otherwise healthy” patients, i.e., without hypertension, diabetes, and cardiovascular disease, as well as excluding premenopausal women and women on HRT (n = 217-220 in analysis, Table S5, otherwise healthy), was performed. For CRP, the results shown in Table S5 are for body mass index (BMI) and minimum SaO2. For IL-6, the results shown are for BMI and hypoxia time.
As in the primary analysis, the results for CRP were only significant for minimum SaO2, not other OSA severity variables. For IL-6, hypoxia time continued to explain the highest amount of variance in IL-6 levels of the 4 OSA severity variables (AHI, ODI, minimum SaO2, and hypoxia time). All of these analyses led to the same conclusions as the primary analysis; a significant independent association of obesity and OSA severity (minimum SaO2 only for CRP) with IL-6 and CRP levels as well as an interaction between them such that no association with OSA severity was found in nonobese patients (Table S5).
ADDITIONAL RESULTS
Demographics and Data on Sleep Disordered Breathing
A total of 532 patients completed the relevant assessments: a sleep study, questionnaires, physical measurements, and serum measurements. Nine patients had sleep studies that did not fulfill the quality criteria (poor-quality oximeter signal) and were excluded. Of the 523 remaining patients, 102 failed to obtain an MRI because of the following reasons: claustrophobia (n = 57), too obese for the machine (n = 3), metallic objects in the body (n = 2), pacemaker (n = 3), or MRI quality issues (n = 31) and other reasons (n = 6). The weight limit of the MRI scanner was 200 kg, but none of our patients exceeded this weight. However, 3 patients who were too obese for the machine did not fit into the machine because of their large circumference, usually around the shoulder area. These patients had a BMI > 45 and weighed 160-165 kg. Failure to obtain MRI assessment occurred more commonly in the most obese group (Figure 1). The data from the patients in whom MRI was not completed but had complete data from other assessments were analyzed.
Different Obesity Measures in the Icelandic Sleep Apnea Cohort
The range of obesity in the cohort was wide, with BMI ranging from 20.0-53.5 kg/m2 (mean ± standard deviation 32.6 ± 5.3 kg/m2). Only 18 had a BMI < 25, whereas 157 were overweight (BMI 25-30). Therefore, the patients of normal weight and those who were overweight were collapsed into one group of nonobese patients with BMI < 30 kg/m2. Table S1 shows the different measures of obesity in the entire cohort and for patients in the 3 BMI categories. The data provided include waist circumference, waist-to-hip ratio, neck circumference, and volume measures from the abdominal MRI. Because MRI was not performed in all patients, the number of patients for these measures was lower (n = 373). The correlation between the abdominal MRI measurements and the anthropometric measurements were in general rather high (Table S2). Total abdominal fat and subcutaneous fat correlated better with BMI than did visceral fat. Visceral fat volume correlated best with waist circumference (r = 0.74, P < 0.001) and neck circumference (r = 0.68, P < 0.001). The correlation between the main obesity variables and OSA severity indices are also found in Table S2. All correlations are low. The correlations between BMI, waist circumference, total fat volume, and visceral fat volume with OSA severity were of similar magnitude. However, the correlation with subcutaneous fat volume was somewhat lower. It is important to consider the truncated nature of our cohort (only patients with moderate to severe OSA and relatively obese patients), when comparing these rather low correlations to studies showing a stronger relationship in the general population7,8 or in patients suspected of having OSA.9–11
Table S1.
Different obesity measurements in the ISAC cohort by different BMI groups: n = 454 for waist, hip and neck measurements, n = 373 for all fat volumes.
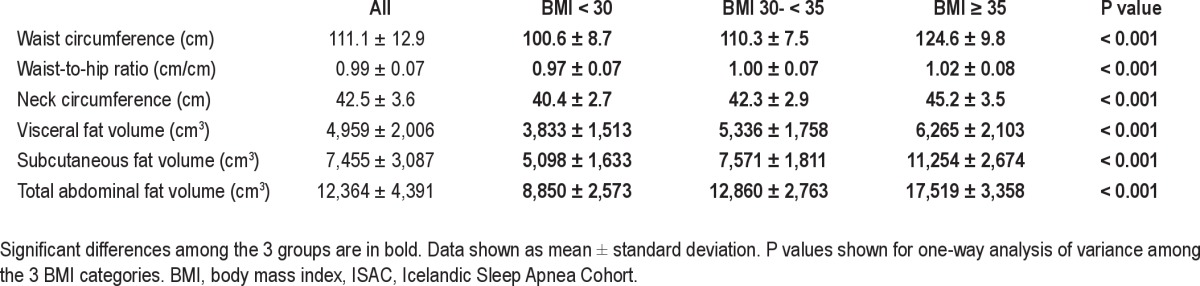
Table S2.
Pearson correlations between different obesity variables. All correlations are performed on the n = 373 cohort with MRI measurements and all significant correlations are in bold.
Distribution of Inflammatory Markers in the Icelandic Sleep Apnea Cohort
Log transformation was required for both IL-6 and CRP levels and used for all analyses (Figure S1). The correlation between log(IL-6) and log(CRP) levels for all patients with both measures (n = 449) was r = 0.60, P < 0.001. Thus, 36% of the variance in 1 biomarker was explainable through its linear association with the other.
Log-transformation of interleukin-6 (IL-6, A and B) and C-reactive protein (CRP, C and D) levels. The actual distribution is shown in A and C and the log-transformed data in B and D.

Analysis for Nonobese Patients Only
The Pearson correlation of IL-6 and CRP with all obesity markers (as in Table 2) were reanalyzed for patients with BMI < 30 only in the Icelandic Sleep Apnea Cohort (ISAC). However, no significant associations were found between the inflammatory biomarkers studied and any of the different obesity markers (both n = 175 for all patients with BMI < 30 and analysis by sex). This is likely due to the more limited range of obesity level within this group only (BMI 20.0-29.9). For the Pearson correlation of IL-6 and CRP levels with OSA severity in nonobese patients only, see Table S3. No significant correlation between OSA severity and IL-6 or CRP levels was found for nonobese patients. The results of the multiple linear regression model taking into account both obesity and sleep apnea severity were also nonsignificant for the nonobese group only (data not shown). These results emphasize the importance of having a wide range of BMI and other fat measures for these types of analyses.
Table S3.
Pearson correlation between IL-6 levels (A) and CRP levels (B) in serum to OSA severity in the whole cohort and for the 3 different BMI categories (n = 454)
Multiple Linear Regression Models for CRP and IL-6 Levels
The effect of covariates on the association of obesity and sleep apnea severity measures with IL-6 and CRP levels are found in Table S4. The relationship between OSA and BMI on CRP levels was not the same in those with and without cardiovascular disease (CVD) (P = 0.01 for interaction with the OSA and obesity association with CRP levels) (see Table S4). Borderline significance was also found for a sex difference (P = 0.053). Therefore, the cohort was divided into subgroups (with/without CVD and males/females) to explore further the influence of these covariates on how obesity and sleep apnea are associated with CRP levels. For CRP the findings we had for IL-6 were replicated for males only, i.e., independent associations of OSA and obesity and a significant interaction (Table S3). Also, the analysis was repeated excluding premenopausal women and postmenopausal women on HRT (n = 17). Importantly, these results showed that postmenopausal women behave similarly to men. After excluding premenopausal women (n = 13) and women on HRT (n = 4) from the main analysis, there were independent associations of OSA and obesity on CRP levels and a trend toward an interaction between the two for males and postmenopausal women (borderline significant, P = 0.06). Sex did not significantly affect this relationship after excluding premenopausal women and women on HRT. The findings we had for IL-6 were also largely replicated for CRP in those with cardiovascular disease, i.e., independent associations of OSA and obesity with CRP levels and a significant interaction between OSA and obesity (Table S5). However, in those without cardiovascular disease, an independent association of OSA severity and CRP levels was found but there was no significant interaction between obesity and OSA severity on CRP levels (Table S5). Interestingly, in otherwise healthy patients with no cardiovascular disease, no hypertension or diabetes, the interaction between OSA severity and obesity was again significant (Table S5). In all the analyses with a significant interaction, it was the result of OSA severity not having a role in patients with BMI < 30 kg/m2. The role of OSA severity on CRP levels depends therefore not only on obesity but may also be affected by other covariates such as menopausal status and, in particular, the presence of cardiovascular disease.
Table S4.
The effect of covariates on the model for (A) IL-6 with hypoxia time and BMI, (B) CRP with minimum SaO2 and BMI. The additional variance (partial R2) in the biomarker explained by the covariate is shown (main effect) as well as the effect of the covariate on the interaction of OSA and obesity on biomarker levels
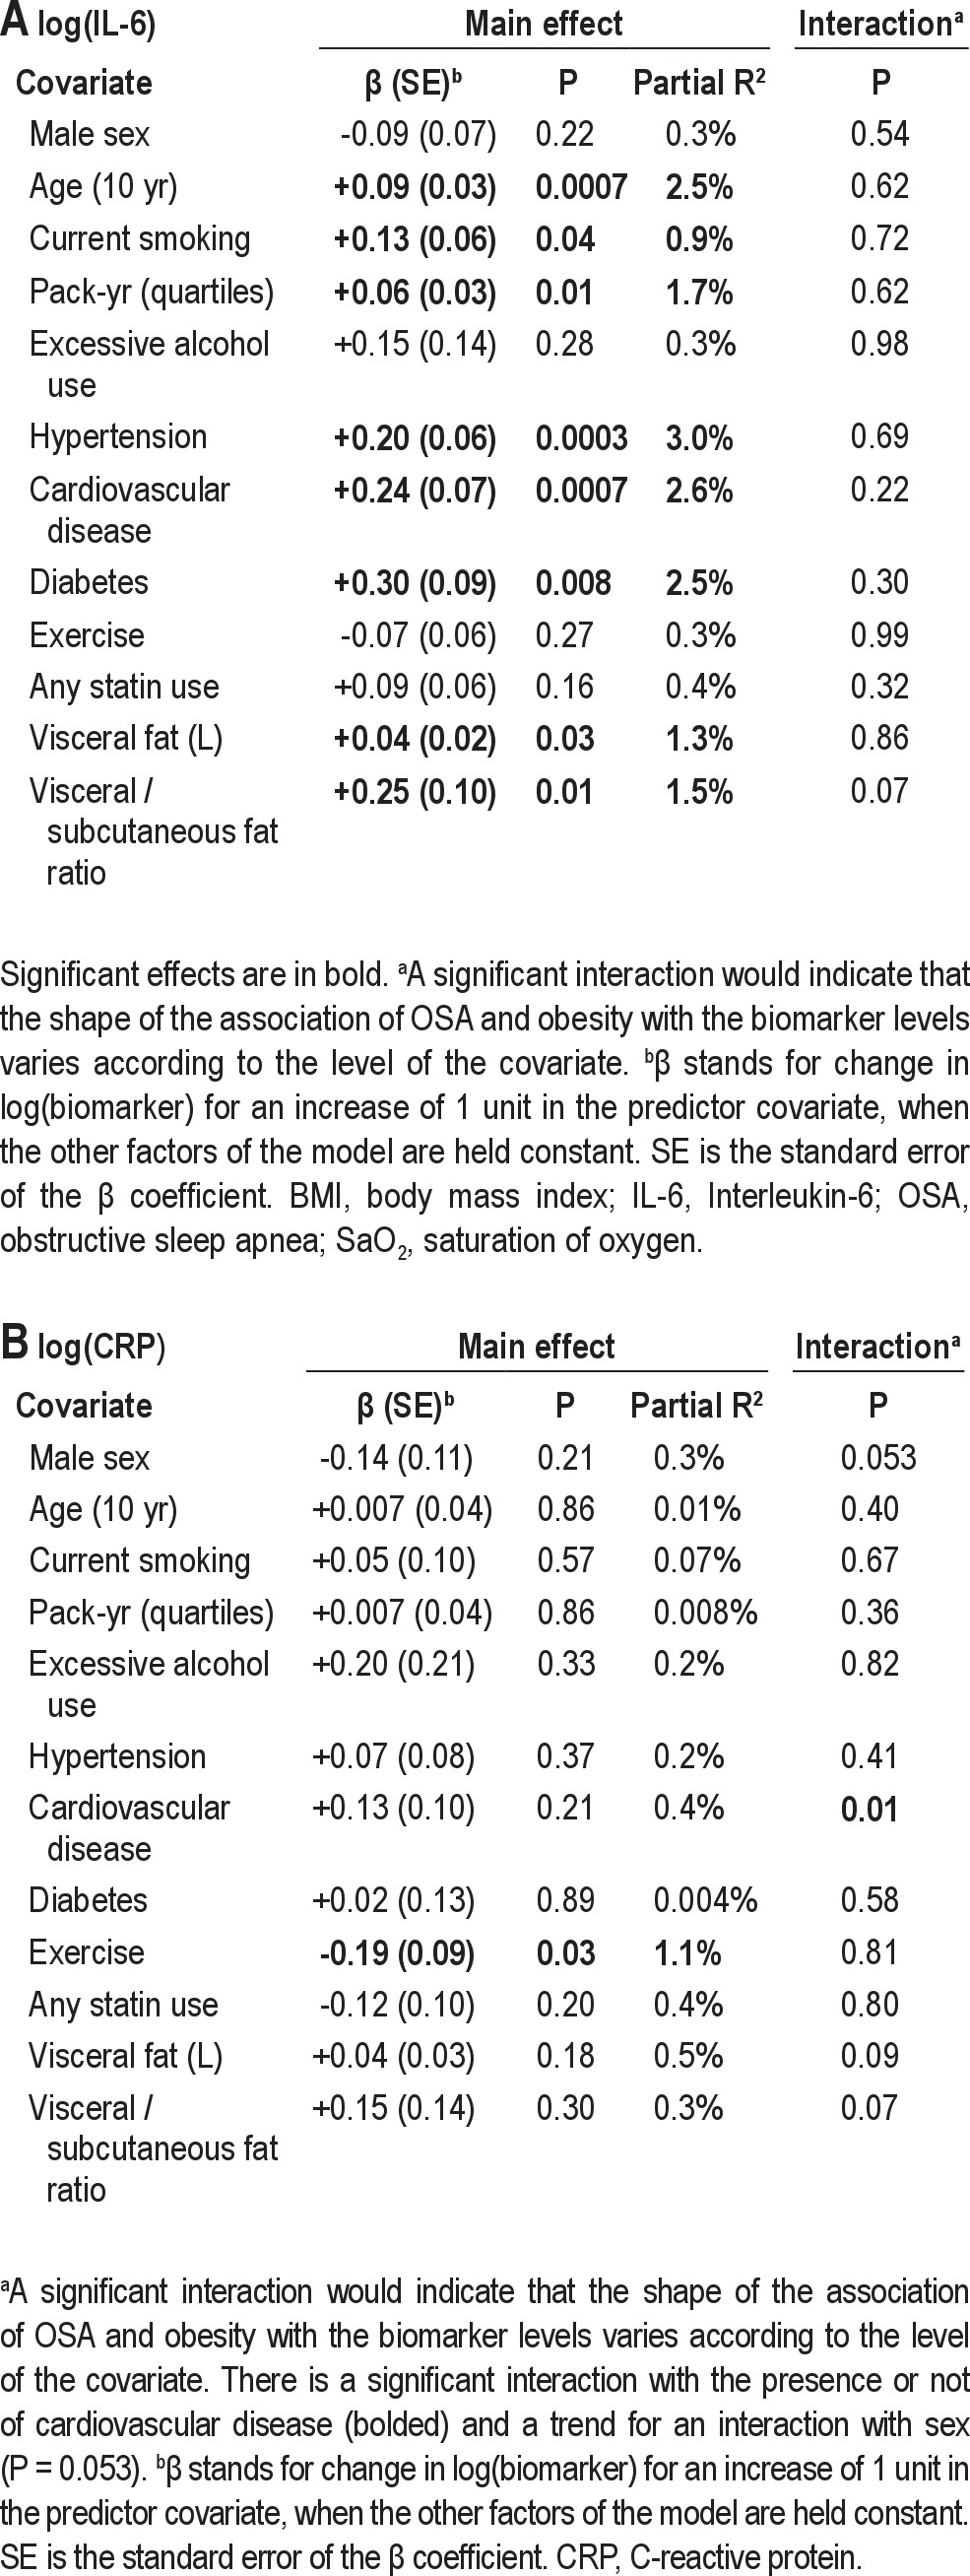
Table S5.
Sensitivity analyses for the association of sleep apnea severity and obesity with IL-6 and CRP levels in the Icelandic Sleep Apnea Cohort (ISAC)
REFERENCES
- 1.Johns MW. Reliability and factor analysis of the Epworth Sleepiness Scale. Sleep. 1992;15:376–81. doi: 10.1093/sleep/15.4.376. [DOI] [PubMed] [Google Scholar]
- 2.Ross R, Leger L, Morris D, de Guise J, Guardo R. Quantification of adipose tissue by MRI: relationship with anthropometric variables. J Appl Physiol. 1992;72:787–95. doi: 10.1152/jappl.1992.72.2.787. [DOI] [PubMed] [Google Scholar]
- 3.Kullberg J, Brandberg J, Angelhed JE, et al. Whole-body adipose tissue analysis: comparison of MRI, CT and dual energy X-ray absorptiometry. Br J Radiol. 2009;82:123–30. doi: 10.1259/bjr/80083156. [DOI] [PubMed] [Google Scholar]
- 4.Silver HJ, Welch EB, Avison MJ, Niswender KD. Imaging body composition in obesity and weight loss: challenges and opportunities. Diabetes Metab Syndr Obes. 2010;3:337–47. doi: 10.2147/DMSOTT.S9454. [DOI] [PMC free article] [PubMed] [Google Scholar]
- 5.Shen W, Chen J. Application of imaging and other noninvasive techniques in determining adipose tissue mass. Methods Mol Biol. 2008;456:39–54. doi: 10.1007/978-1-59745-245-8_3. [DOI] [PubMed] [Google Scholar]
- 6.Myers RH, Montgomery DC. New York: John Wiley – Sons, Inc; 1995. Response surface methodology, process and product optimization using designed experiments. [Google Scholar]
- 7.Nieto FJ, Young TB, Lind BK, et al. Association of sleep-disordered breathing, sleep apnea, and hypertension in a large community-based study. Sleep Heart Health Study.[see comment][erratum appears in JAMA 2002 Oct 23-30;288(16):1985] JAMA. 2000;283:1829–36. doi: 10.1001/jama.283.14.1829. [DOI] [PubMed] [Google Scholar]
- 8.Young T, Palta M, Dempsey J, Skatrud J, Weber S, Badr S. The occurrence of sleep-disordered breathing among middle-aged adults. N Engl J Med. 1993;328:1230–5. doi: 10.1056/NEJM199304293281704. [DOI] [PubMed] [Google Scholar]
- 9.Ogretmenoglu O, Suslu AE, Yucel OT, Onerci TM, Sahin A. Body fat composition: a predictive factor for obstructive sleep apnea. Laryngoscope. 2005;115:1493–8. doi: 10.1097/01.mlg.0000172204.82314.c3. [DOI] [PubMed] [Google Scholar]
- 10.Schafer H, Pauleit D, Sudhop T, Gouni-Berthold I, Ewig S, Berthold HK. Body fat distribution, serum leptin, and cardiovascular risk factors in men with obstructive sleep apnea. Chest. 2002;122:829–39. doi: 10.1378/chest.122.3.829. [DOI] [PubMed] [Google Scholar]
- 11.Shinohara E, Kihara S, Yamashita S, et al. Visceral fat accumulation as an important risk factor for obstructive sleep apnoea syndrome in obese subjects. J Intern Med. 1997;241:11–8. doi: 10.1046/j.1365-2796.1997.63889000.x. [DOI] [PubMed] [Google Scholar]
REFERENCES
- 1.Young T, Palta M, Dempsey J, Skatrud J, Weber S, Badr S. The occurrence of sleep-disordered breathing among middle-aged adults. N Engl J Med. 1993;328:1230–5. doi: 10.1056/NEJM199304293281704. [DOI] [PubMed] [Google Scholar]
- 2.Arnardottir ES, Mackiewicz M, Gislason T, Teff KL, Pack AI. Molecular signatures in obstructive sleep apnea in adults: a review and perspective. Sleep. 2009;32:447–70. doi: 10.1093/sleep/32.4.447. [DOI] [PMC free article] [PubMed] [Google Scholar]
- 3.Ikonomidis I, Stamatelopoulos K, Lekakis J, Vamvakou GD, Kremastinos DT. Inflammatory and non-invasive vascular markers: the multimarker approach for risk stratification in coronary artery disease. Atherosclerosis. 2008;199:3–11. doi: 10.1016/j.atherosclerosis.2008.02.019. [DOI] [PubMed] [Google Scholar]
- 4.Bastard JP, Maachi M, Lagathu C, et al. Recent advances in the relationship between obesity, inflammation, and insulin resistance. Eur Cytokine Netw. 2006;17:4–12. [PubMed] [Google Scholar]
- 5.Fried SK, Bunkin DA, Greenberg AS. Omental and subcutaneous adipose tissues of obese subjects release interleukin-6: depot difference and regulation by glucocorticoid. J Clin Endocrinol Metab. 1998;83:847–50. doi: 10.1210/jcem.83.3.4660. [DOI] [PubMed] [Google Scholar]
- 6.Fain JN, Madan AK, Hiler ML, Cheema P, Bahouth SW. Comparison of the release of adipokines by adipose tissue, adipose tissue matrix, and adipocytes from visceral and subcutaneous abdominal adipose tissues of obese humans. Endocrinology. 2004;145:2273–82. doi: 10.1210/en.2003-1336. [DOI] [PubMed] [Google Scholar]
- 7.Minoguchi K, Yokoe T, Tazaki T, et al. Increased carotid intima-media thickness and serum inflammatory markers in obstructive sleep apnea. Am J Respir Crit Care Med. 2005;172:625–30. doi: 10.1164/rccm.200412-1652OC. [DOI] [PubMed] [Google Scholar]
- 8.Shamsuzzaman AS, Winnicki M, Lanfranchi P, et al. Elevated C-reactive protein in patients with obstructive sleep apnea. Circulation. 2002;105:2462–4. doi: 10.1161/01.cir.0000018948.95175.03. [DOI] [PubMed] [Google Scholar]
- 9.Yokoe T, Minoguchi K, Matsuo H, et al. Elevated levels of C-reactive protein and interleukin-6 in patients with obstructive sleep apnea syndrome are decreased by nasal continuous positive airway pressure. Circulation. 2003;107:1129–34. doi: 10.1161/01.cir.0000052627.99976.18. [DOI] [PubMed] [Google Scholar]
- 10.Kokturk O, Ciftci TU, Mollarecep E, Ciftci B. Elevated C-reactive protein levels and increased cardiovascular risk in patients with obstructive sleep apnea syndrome. Int Heart J. 2005;46:801–9. doi: 10.1536/ihj.46.801. [DOI] [PubMed] [Google Scholar]
- 11.Saletu M, Nosiska D, Kapfhammer G, et al. Structural and serum surrogate markers of cerebrovascular disease in obstructive sleep apnea (OSA): association of mild OSA with early atherosclerosis. J Neurol. 2006;253:746–52. doi: 10.1007/s00415-006-0110-6. [DOI] [PubMed] [Google Scholar]
- 12.Hayashi M, Fujimoto K, Urushibata K, Takamizawa A, Kinoshita O, Kubo K. Hypoxia-sensitive molecules may modulate the development of atherosclerosis in sleep apnoea syndrome. Respirology. 2006;11:24–31. doi: 10.1111/j.1440-1843.2006.00780.x. [DOI] [PubMed] [Google Scholar]
- 13.Can M, Acikgoz S, Mungan G, et al. Serum cardiovascular risk factors in obstructive sleep apnea. Chest. 2006;129:233–7. doi: 10.1378/chest.129.2.233. [DOI] [PubMed] [Google Scholar]
- 14.Punjabi NM, Beamer BA. C-reactive protein is associated with sleep disordered breathing independent of adiposity. Sleep. 2007;30:29–34. doi: 10.1093/sleep/30.1.29. [DOI] [PMC free article] [PubMed] [Google Scholar]
- 15.Lui MM, Lam JC, Mak HK, et al. C-reactive protein is associated with obstructive sleep apnea independent of visceral obesity. Chest. 2009;135:950–6. doi: 10.1378/chest.08-1798. [DOI] [PubMed] [Google Scholar]
- 16.Drager LF, Lopes HF, Maki-Nunes C, et al. The impact of obstructive sleep apnea on metabolic and inflammatory markers in consecutive patients with metabolic syndrome. PLoS ONE. 2010;5:e12065. doi: 10.1371/journal.pone.0012065. [DOI] [PMC free article] [PubMed] [Google Scholar]
- 17.Sahlman J, Miettinen K, Peuhkurinen K, et al. The activation of the inflammatory cytokines in overweight patients with mild obstructive sleep apnoea. J Sleep Res. 2010;19:341–8. doi: 10.1111/j.1365-2869.2009.00787.x. [DOI] [PubMed] [Google Scholar]
- 18.Thomopoulos C, Tsioufis C, Dimitriadis K, et al. Obstructive sleep apnoea syndrome is associated with enhanced sub-clinical inflammation and asymmetric dimethyl-arginine levels in hypertensives. J Hum Hypertens. 2009;23:65–7. doi: 10.1038/jhh.2008.101. [DOI] [PubMed] [Google Scholar]
- 19.Vgontzas AN, Papanicolaou DA, Bixler EO, et al. Sleep apnea and daytime sleepiness and fatigue: relation to visceral obesity, insulin resistance, and hypercytokinemia. J Clin Endocrinol Metab. 2000;85:1151–8. doi: 10.1210/jcem.85.3.6484. [DOI] [PubMed] [Google Scholar]
- 20.Vgontzas AN, Zoumakis E, Bixler EO, et al. Selective effects of CPAP on sleep apnoea-associated manifestations. Eur J Clin Invest. 2008;38:585–95. doi: 10.1111/j.1365-2362.2008.01984.x. [DOI] [PMC free article] [PubMed] [Google Scholar]
- 21.Mermigkis C, Bouloukaki I, Mermigkis D, et al. CRP evolution pattern in CPAP-treated obstructive sleep apnea patients. Does gender play a role? Sleep Breath. 2011 Sep 1; doi: 10.1007/s11325-011-0580-3. [Epub ahead of print] [DOI] [PubMed] [Google Scholar]
- 22.Schiza SE, Mermigkis C, Panagiotis P, et al. C-reactive protein evolution in obstructive sleep apnoea patients under CPAP therapy. Eur J Clin Invest. 2010;40:968–75. doi: 10.1111/j.1365-2362.2010.02348.x. [DOI] [PubMed] [Google Scholar]
- 23.Ishida K, Kato M, Kato Y, et al. Appropriate use of nasal continuous positive airway pressure decreases elevated C-reactive protein in patients with obstructive sleep apnea. Chest. 2009;136:125–9. doi: 10.1378/chest.08-1431. [DOI] [PMC free article] [PubMed] [Google Scholar]
- 24.Steiropoulos P, Tsara V, Nena E, et al. Effect of continuous positive airway pressure treatment on serum cardiovascular risk factors in patients with obstructive sleep apnea-hypopnea syndrome. Chest. 2007;132:843–51. doi: 10.1378/chest.07-0074. [DOI] [PubMed] [Google Scholar]
- 25.Burioka N, Miyata M, Fukuoka Y, Endo M, Shimizu E. Day-night variations of serum interleukin-6 in patients with severe obstructive sleep apnea syndrome before and after continuous positive airway pressure (CPAP) Chronobiol Int. 2008;25:827–34. doi: 10.1080/07420520802384101. [DOI] [PubMed] [Google Scholar]
- 26.Drager LF, Bortolotto LA, Figueiredo AC, Krieger EM, Lorenzi GF. Effects of continuous positive airway pressure on early signs of atherosclerosis in obstructive sleep apnea. Am J Respir Crit Care Med. 2007;176:706–12. doi: 10.1164/rccm.200703-500OC. [DOI] [PubMed] [Google Scholar]
- 27.Carneiro G, Togeiro SM, Ribeiro-Filho FF, et al. Continuous positive airway pressure therapy improves hypoadiponectinemia in severe obese men with obstructive sleep apnea without changes in insulin resistance. Metab Syndr Relat Disord. 2009;7:537–42. doi: 10.1089/met.2009.0019. [DOI] [PubMed] [Google Scholar]
- 28.Barcelo A, Barbe F, Llompart E, et al. Effects of obesity on C-reactive protein level and metabolic disturbances in male patients with obstructive sleep apnea. Am J Med. 2004;117:118–21. doi: 10.1016/j.amjmed.2004.01.025. [DOI] [PubMed] [Google Scholar]
- 29.Guilleminault C, Kirisoglu C, Ohayon MM. C-reactive protein and sleep-disordered breathing. Sleep. 2004;27:1507–11. doi: 10.1093/sleep/27.8.1507. [DOI] [PubMed] [Google Scholar]
- 30.Taheri S, Austin D, Lin L, Nieto FJ, Young T, Mignot E. Correlates of serum C-reactive protein (CRP)--no association with sleep duration or sleep disordered breathing. Sleep. 2007;30:991–6. doi: 10.1093/sleep/30.8.991. [DOI] [PMC free article] [PubMed] [Google Scholar]
- 31.Ryan S, Nolan GM, Hannigan E, Cunningham S, Taylor C, McNicholas WT. Cardiovascular risk markers in obstructive sleep apnoea syndrome and correlation with obesity. Thorax. 2007;62:509–14. doi: 10.1136/thx.2006.066720. [DOI] [PMC free article] [PubMed] [Google Scholar]
- 32.Akashiba T, Akahoshi T, Kawahara S, Majima T, Horie T. Effects of long-term nasal continuous positive airway pressure on C-reactive protein in patients with obstructive sleep apnea syndrome. Intern Med. 2005;44:899–900. doi: 10.2169/internalmedicine.44.899. [DOI] [PubMed] [Google Scholar]
- 33.Aihara K, Oga T, Harada Y, et al. Comparison of biomarkers of subclinical lung injury in obstructive sleep apnea. Respir Med. 2011;105:939–45. doi: 10.1016/j.rmed.2011.02.016. [DOI] [PubMed] [Google Scholar]
- 34.Kanbay A, Kaya E, Buyukoglan H, et al. Serum gamma-glutamyl transferase activity is an independent predictor for cardiovascular disease in obstructive sleep apnea syndrome. Respir Med. 2011;105:637–42. doi: 10.1016/j.rmed.2010.12.003. [DOI] [PubMed] [Google Scholar]
- 35.Steiropoulos P, Papanas N, Nena E, et al. Inflammatory markers in middle-aged obese subjects: does obstructive sleep apnea syndrome play a role? Mediators Inflamm. 2010 doi: 10.1155/2010/675320. Article ID 675320, 6 pages. [DOI] [PMC free article] [PubMed] [Google Scholar]
- 36.Imagawa S, Yamaguchi Y, Ogawa K, et al. Interleukin-6 and tumor necrosis factor-alpha in patients with obstructive sleep apnea-hypopnea syndrome. Respiration. 2004;71:24–9. doi: 10.1159/000075645. [DOI] [PubMed] [Google Scholar]
- 37.Ryan S, Taylor CT, McNicholas WT. Predictors of elevated nuclear factor-kappaB-dependent genes in obstructive sleep apnea syndrome. Am J Respir Crit Care Med. 2006;174:824–30. doi: 10.1164/rccm.200601-066OC. [DOI] [PubMed] [Google Scholar]
- 38.Roytblat L, Rachinsky M, Fisher A, et al. Raised interleukin-6 levels in obese patients. Obes Res. 2000;8:673–5. doi: 10.1038/oby.2000.86. [DOI] [PubMed] [Google Scholar]
- 39.Kim J, Lee CH, Park CS, Kim BG, Kim SW, Cho JH. Plasma levels of MCP-1 and adiponectin in obstructive sleep apnea syndrome. Arch Otolaryngol Head Neck Surg. 2010;136:896–9. doi: 10.1001/archoto.2010.142. [DOI] [PubMed] [Google Scholar]
- 40.Vgontzas AN, Papanicolaou DA, Bixler EO, Kales A, Tyson K, Chrousos GP. Elevation of plasma cytokines in disorders of excessive daytime sleepiness: role of sleep disturbance and obesity. J Clin Endocrinol Metab. 1997;82:1313–6. doi: 10.1210/jcem.82.5.3950. [DOI] [PubMed] [Google Scholar]
- 41.Chung S, Yoon IY, Shin YK, Lee CH, Kim JW, Ahn HJ. Endothelial dysfunction and inflammatory reactions of elderly and middle-aged men with obstructive sleep apnea syndrome. Sleep Breath. 2009;13:11–17. doi: 10.1007/s11325-008-0210-x. [DOI] [PubMed] [Google Scholar]
- 42.Kohler M, Ayers L, Pepperell JC, et al. Effects of continuous positive airway pressure on systemic inflammation in patients with moderate to severe obstructive sleep apnoea: a randomised controlled trial. Thorax. 2009;64:67–73. doi: 10.1136/thx.2008.097931. [DOI] [PubMed] [Google Scholar]
- 43.Phillips CL, Yang Q, Williams A, et al. The effect of short-term withdrawal from continuous positive airway pressure therapy on sympathetic activity and markers of vascular inflammation in subjects with obstructive sleep apnoea. J Sleep Res. 2007;16:217–25. doi: 10.1111/j.1365-2869.2007.00589.x. [DOI] [PubMed] [Google Scholar]
- 44.Steiropoulos P, Kotsianidis I, Nena E, et al. Long-term effect of continuous positive airway pressure therapy on inflammation markers of patients with obstructive sleep apnea syndrome. Sleep. 2009;32:537–43. doi: 10.1093/sleep/32.4.537. [DOI] [PMC free article] [PubMed] [Google Scholar]
- 45.Hajer GR, van Haeften TW, Visseren FL. Adipose tissue dysfunction in obesity, diabetes, and vascular diseases. Eur Heart J. 2008;29:2959–71. doi: 10.1093/eurheartj/ehn387. [DOI] [PubMed] [Google Scholar]
- 46.Efron B, Tibshirani RJ. An introduction to the bootstrap (monographs on statistics and applied probability, 57) New York: Chapman and Hall; 1993. [Google Scholar]
- 47.Forouhi NG, Sattar N, McKeigue PM. Relation of C-reactive protein to body fat distribution and features of the metabolic syndrome in Europeans and South Asians. Int J Obes Relat Metab Disord. 2001;25:1327–31. doi: 10.1038/sj.ijo.0801723. [DOI] [PubMed] [Google Scholar]
- 48.Fenkci S, Rota S, Sabir N, Sermez Y, Guclu A, Akdag B. Relationship of serum interleukin-6 and tumor necrosis factor alpha levels with abdominal fat distribution evaluated by ultrasonography in overweight or obese postmenopausal women. J Investig Med. 2006;54:455–60. doi: 10.2310/6650.2006.06010. [DOI] [PubMed] [Google Scholar]
- 49.Piche ME, Lemieux S, Weisnagel SJ, Corneau L, Nadeau A, Bergeron J. Relation of high-sensitivity C-reactive protein, interleukin-6, tumor necrosis factor-alpha, and fibrinogen to abdominal adipose tissue, blood pressure, and cholesterol and triglyceride levels in healthy postmenopausal women. Am J Cardiol. 2005;96:92–7. doi: 10.1016/j.amjcard.2005.02.051. [DOI] [PubMed] [Google Scholar]
- 50.Park HS, Park JY, Yu R. Relationship of obesity and visceral adiposity with serum concentrations of CRP, TNF-alpha and IL-6. Diabetes Res Clin Pract. 2005;69:29–35. doi: 10.1016/j.diabres.2004.11.007. [DOI] [PubMed] [Google Scholar]
- 51.Cartier A, Cote M, Lemieux I, et al. Sex differences in inflammatory markers: what is the contribution of visceral adiposity? Am J Clin Nutr. 2009;89:1307–14. doi: 10.3945/ajcn.2008.27030. [DOI] [PubMed] [Google Scholar]
- 52.Beasley LE, Koster A, Newman AB, et al. Inflammation and race and gender differences in computerized tomography-measured adipose depots. Obesity (Silver Spring) 2009;17:1062–9. doi: 10.1038/oby.2008.627. [DOI] [PMC free article] [PubMed] [Google Scholar]
- 53.Pou KM, Massaro JM, Hoffmann U, et al. Visceral and subcutaneous adipose tissue volumes are cross-sectionally related to markers of inflammation and oxidative stress: the Framingham Heart Study. Circulation. 2007;116:1234–41. doi: 10.1161/CIRCULATIONAHA.107.710509. [DOI] [PubMed] [Google Scholar]
- 54.Lee JW, Brancati FL, Yeh HC. Trends in the prevalence of type 2 diabetes in Asians versus whites: results from the United States National Health Interview Survey, 1997-2008. Diabetes Care. 2011;34:353–7. doi: 10.2337/dc10-0746. [DOI] [PMC free article] [PubMed] [Google Scholar]
- 55.Chiu M, Austin PC, Manuel DG, Shah BR, Tu JV. Deriving ethnic-specific BMI cutoff points for assessing diabetes risk. Diabetes Care. 2011;34:1741–8. doi: 10.2337/dc10-2300. [DOI] [PMC free article] [PubMed] [Google Scholar]
- 56.Genta PR, Lorenzi-Filho G. Sleep apnoea in Asians and Caucasians: comparing apples and oranges. Eur Respir J. 2011;37:1537–8. doi: 10.1183/09031936.00200510. author reply 8-9. [DOI] [PubMed] [Google Scholar]
- 57.Lee RW, Vasudavan S, Hui DS, et al. Differences in craniofacial structures and obesity in Caucasian and Chinese patients with obstructive sleep apnea. Sleep. 2010;33:1075–80. doi: 10.1093/sleep/33.8.1075. [DOI] [PMC free article] [PubMed] [Google Scholar]
- 58.Coe CL, Love GD, Karasawa M, et al. Population differences in proinflammatory biology: Japanese have healthier profiles than Americans. Brain Behav Immun. 2011;25:494–502. doi: 10.1016/j.bbi.2010.11.013. [DOI] [PMC free article] [PubMed] [Google Scholar]
- 59.Franklin RM, Ploutz-Snyder L, Kanaley JA. Longitudinal changes in abdominal fat distribution with menopause. Metabolism. 2009;58:311–5. doi: 10.1016/j.metabol.2008.09.030. [DOI] [PubMed] [Google Scholar]
- 60.Sites CK, Brochu M, Tchernof A, Poehlman ET. Relationship between hormone replacement therapy use with body fat distribution and insulin sensitivity in obese postmenopausal women. Metabolism. 2001;50:835–40. doi: 10.1053/meta.2001.24878. [DOI] [PubMed] [Google Scholar]
- 61.Sothern RB, Roitman-Johnson B, Kanabrocki EL, et al. Circadian characteristics of circulating interleukin-6 in men. J Allergy Clin Immunol. 1995;95:1029–35. doi: 10.1016/s0091-6749(95)70104-4. [DOI] [PubMed] [Google Scholar]
- 62.Kao PC, Shiesh SC, Wu TJ. Serum C-reactive protein as a marker for wellness assessment. Ann Clin Lab Sci. 2006;36:163–9. [PubMed] [Google Scholar]
- 63.Fain JN. Release of interleukins and other inflammatory cytokines by human adipose tissue is enhanced in obesity and primarily due to the nonfat cells. Vitam Horm. 2006;74:443–77. doi: 10.1016/S0083-6729(06)74018-3. [DOI] [PubMed] [Google Scholar]
- 64.Schwartz AR, Patil SP, Laffan AM, Polotsky V, Schneider H, Smith PL. Obesity and obstructive sleep apnea: pathogenic mechanisms and therapeutic approaches. Proc Am Thorac Soc. 2008;5:185–92. doi: 10.1513/pats.200708-137MG. [DOI] [PMC free article] [PubMed] [Google Scholar]
- 65.Peppard PE, Ward NR, Morrell MJ. The impact of obesity on oxygen desaturation during sleep-disordered breathing. Am J Respir Crit Care Med. 2009;180:788–93. doi: 10.1164/rccm.200905-0773OC. [DOI] [PMC free article] [PubMed] [Google Scholar]
- 66.Sathyapalan T, Atkin SL, Kilpatrick ES. Disparate effects of atorvastatin compared with simvastatin on C-reactive protein concentrations in patients with type 2 diabetes. Diabetes Care. 2010;33:1948–50. doi: 10.2337/dc10-0201. [DOI] [PMC free article] [PubMed] [Google Scholar]
- 67.Jialal I, Stein D, Balis D, Grundy SM, Adams-Huet B, Devaraj S. Effect of hydroxymethyl glutaryl coenzyme a reductase inhibitor therapy on high sensitive C-reactive protein levels. Circulation. 2001;103:1933–5. doi: 10.1161/01.cir.103.15.1933. [DOI] [PubMed] [Google Scholar]
- 68.Millar JS, Ky B, Wolfe ML, Pruscino L, Baer A, Rader DJ. Short-term treatment with high-dose atorvastatin reduces LDL cholesterol but shows no anti-inflammatory effects in normolipidemic subjects with normal CRP levels. Clin Transl Sci. 2010;3:140–6. doi: 10.1111/j.1752-8062.2010.00211.x. [DOI] [PMC free article] [PubMed] [Google Scholar]
- 69.Bixler EO, Vgontzas AN, Lin HM, et al. Prevalence of sleep-disordered breathing in women: effects of gender. Am J Respir Crit Care Med. 2001;163:608–13. doi: 10.1164/ajrccm.163.3.9911064. [DOI] [PubMed] [Google Scholar]
- 70.Mehra R, Xu F, Babineau DC, et al. Sleep-disordered breathing and prothrombotic biomarkers: cross-sectional results of the Cleveland Family Study. Am J Respir Crit Care Med. 2010;182:826–33. doi: 10.1164/rccm.201001-0020OC. [DOI] [PMC free article] [PubMed] [Google Scholar]
- 71.Tatsumi K, Kasahara Y, Kurosu K, Tanabe N, Takiguchi Y, Kuriyama T. Sleep oxygen desaturation and circulating leptin in obstructive sleep apnea-hypopnea syndrome. Chest. 2005;127:716–21. doi: 10.1378/chest.127.3.716. [DOI] [PubMed] [Google Scholar]
- 72.Tatsumi K, Saibara T. Effects of obstructive sleep apnea syndrome on hepatic steatosis and nonalcoholic steatohepatitis. Hepatol Res. 2005;33:100–4. doi: 10.1016/j.hepres.2005.09.014. [DOI] [PubMed] [Google Scholar]
- 73.Ogretmenoglu O, Suslu AE, Yucel OT, Onerci TM, Sahin A. Body fat composition: a predictive factor for obstructive sleep apnea. Laryngoscope. 2005;115:1493–8. doi: 10.1097/01.mlg.0000172204.82314.c3. [DOI] [PubMed] [Google Scholar]
- 74.Shinohara E, Kihara S, Yamashita S, et al. Visceral fat accumulation as an important risk factor for obstructive sleep apnoea syndrome in obese subjects. J Intern Med. 1997;241:11–18. doi: 10.1046/j.1365-2796.1997.63889000.x. [DOI] [PubMed] [Google Scholar]
- 75.Dingli K, Coleman EL, Vennelle M, et al. Evaluation of a portable device for diagnosing the sleep apnoea/hypopnoea syndrome. Eur Respir J. 2003;21:253–9. doi: 10.1183/09031936.03.00298103. [DOI] [PubMed] [Google Scholar]
- 76.Iber C A-IS, Chesson A, Quan SF, editors. 1st ed. Westchester, IL: American Academy of Sleep Medicine; 2007. The AASM manual for the scoring of sleep and associated events: rules, terminology, and technical specification. [Google Scholar]
- 77.Levendowski D, Steward D, Woodson BT, Olmstead R, Popovic D, Westbrook P. The impact of obstructive sleep apnea variability measured in-lab versus in-home on sample size calculations. Int Arch Med. 2009;2:2. doi: 10.1186/1755-7682-2-2. [DOI] [PMC free article] [PubMed] [Google Scholar]
- 78.Wittig RM, Romaker A, Zorick FJ, Roehrs TA, Conway WA, Roth T. Night-to-night consistency of apneas during sleep. Am Rev Respir Dis. 1984;129:244–6. [PubMed] [Google Scholar]
Associated Data
This section collects any data citations, data availability statements, or supplementary materials included in this article.
Supplementary Materials
Table S1.
Different obesity measurements in the ISAC cohort by different BMI groups: n = 454 for waist, hip and neck measurements, n = 373 for all fat volumes.
Table S2.
Pearson correlations between different obesity variables. All correlations are performed on the n = 373 cohort with MRI measurements and all significant correlations are in bold.
Log-transformation of interleukin-6 (IL-6, A and B) and C-reactive protein (CRP, C and D) levels. The actual distribution is shown in A and C and the log-transformed data in B and D.
Table S3.
Pearson correlation between IL-6 levels (A) and CRP levels (B) in serum to OSA severity in the whole cohort and for the 3 different BMI categories (n = 454)
Table S4.
The effect of covariates on the model for (A) IL-6 with hypoxia time and BMI, (B) CRP with minimum SaO2 and BMI. The additional variance (partial R2) in the biomarker explained by the covariate is shown (main effect) as well as the effect of the covariate on the interaction of OSA and obesity on biomarker levels
Table S5.
Sensitivity analyses for the association of sleep apnea severity and obesity with IL-6 and CRP levels in the Icelandic Sleep Apnea Cohort (ISAC)