Abstract
Study Objectives:
The sleep/wake cycle is accompanied by changes in circulating numbers of immune cells. The goal of this study was to provide an in-depth characterization of diurnal rhythms in different blood cell populations and to investigate the effect of acute sleep deprivation on the immune system, as an indicator of the body's acute stress response.
Design:
Observational within-subject design.
Setting:
Home environment and Clinical Research Centre.
Participants:
15 healthy male participants aged 23.7 ± 5.4 (standard deviation) yr.
Interventions:
Total sleep deprivation.
Measurements and Results:
Diurnal rhythms of several blood cell populations were assessed under a normal sleep/wake cycle followed by 29 hr of extended wakefulness. The effect of condition (sleep versus sleep deprivation) on peak time and amplitude was investigated. Interindividual variation of, and the level of correlation between, the different cell populations was assessed.
Comprehensive nonlinear curve fitting showed significant diurnal rhythms for all blood cell types investigated, with CD4 (naïve) cells exhibiting the most robust rhythms independent of condition. For those participants exhibiting significant diurnal rhythms in blood cell populations, only the amplitude of the granulocyte rhythm was significantly reduced by sleep deprivation. Granulocytes were the most diverse population, being most strongly affected by condition, and showed the lowest correlations with any other given cell type while exhibiting the largest interindividual variation in abundance.
Conclusions:
Granulocyte levels and diurnal rhythmicity are directly affected by acute sleep deprivation; these changes mirror the body's immediate immune response upon exposure to stress.
Citation:
Ackermann K; Revell VL; Lao O; Rombouts EJ; Skene DJ; Kayser M. Diurnal rhythms in blood cell populations and the effect of acute sleep deprivation in healthy young men. SLEEP 2012;35(7):933-940.
Keywords: Human, circadian, flow cytometry, granulocytes
INTRODUCTION
The circadian timing system governs our daily lives, including the regulation of physiology, behavior, and the sleep-wake cycle. In a natural environment, these cycles are entrained on a daily basis by regular day-night changes with light as the main synchronizing factor (zeitgeber).1 In addition, many parameters of the human immune system exhibit distinct 24-hr rhythms, such as proinflammatory and antiinflammatory cytokines, and numerous studies have addressed the influence of sleep on immune function, as reviewed recently.2,3
In our modern society, inappropriate sleep times are becoming more frequent, raising the question of potential negative long-term effects of this behavior against the internal clock. Indeed, sleep deprivation, chronic partial sleep loss and disruption, or desynchronization of the circadian timing system are detrimental to human health.2,4 Sleep restriction and/or deprivation have been associated with the development of severe pathologies, including obesity, diabetes, and hypertension.5,6 People with unusual working hours, such as shift workers, seem to be especially affected; a recent in-depth review on the association between night work and the development of chronic diseases including breast cancer, cardiovascular disease, and metabolic syndrome concluded that there is evidence for such a link from currently available datasets.7
Supporting the role of chronic sleep loss in the long-term development of pathologies is accumulating evidence that sleep itself has a sustentative role for the functioning of the immune system, whereas sleep loss is a risk factor for impaired immune function.3,8,9 Several studies have investigated the role of the human circadian system and/or sleep on circulating immune parameters.10–20 Under normal sleep-wake and lighting conditions, diurnal rhythms have been identified in levels of circulating blood cell populations (leukocyte subsets), with lymphocyte levels peaking during the night.13,14,–23 Inconsistent results, however, have been observed for (neutrophil) granulocytes and monocytes.12,13,15,16,19,24 Moreover, although some studies have found no statistically significant effect of sleep deprivation on diurnal rhythms in blood cell levels,11,18,22,24,25 other studies have reported elevated levels of lymphocytes or leukocytes.12,14 To our knowledge, there is only 1 detailed characterization of diurnal rhythmicity in circulating T cell subsets. Data presented in this study, however, were collapsed across conditions of a regular sleep-wake cycle and sleep deprivation when no significant differences among conditions were found.22 Observed inconsistencies and lack of reproducibility among the different studies may be partially explained by variations in experimental conditions, laboratory protocols, and the level of control exerted over extrinsic factors such as food intake and posture.18,22 Furthermore, sleep deprivation evokes an acute stress response within the organism, which may have a high degree of interindividual variation in humans. Thus, to be able to accurately characterize the effect of the stressor sleep loss on diurnal rhythmicity in circulating blood cell levels, a study using strictly controlled laboratory conditions, a within-subject design, and thorough statistical assessment of the sleep and the sleep deprivation condition is required. If the results are to be directly applicable to real-world scenarios such as night shift work, then it is also essential that the laboratory protocol, although highly controlled, emulates real life.
The goal of this study was to provide an in-depth characterization of diurnal rhythms in circulating levels of different blood cell populations under a highly controlled laboratory protocol incorporating a sleep-wake cycle, timed meals, controlled posture, and environmental lighting. In addition, the study assessed the effect of a night of acute sleep deprivation on the blood cell parameters in a within-subject design to characterize changes of the immune system in the body's acute stress response.
MATERIALS AND METHODS
Laboratory Study
The in-laboratory sessions were conducted at the Surrey Clinical Research Centre (CRC) at the University of Surrey (UK). A favorable ethical opinion was obtained from the University of Surrey Ethics Committee; all procedures were conducted in accordance with the Declaration of Helsinki and conformed to international ethical standards.
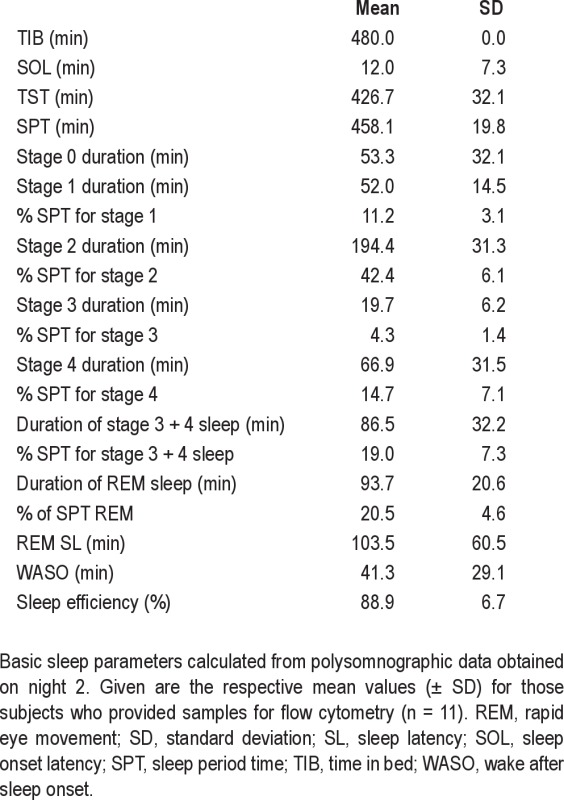
Healthy males 19–35 yr of age (n = 15; mean age ± SD: 23.7 ± 5.4 yr) participated in the study. Study eligibility was determined by questionnaires, medical and physical assessment, and analysis of blood and urine samples. Exclusion criteria included smoking, the taking of prescription medication, existing medical conditions, abnormal blood hematology, and testing positive for drugs of abuse. During the screening process the participants were required to complete a number of validated sleep questionnaires: Pittsburgh Sleep Quality Index (PSQI), Epworth Sleepiness Scale (ESS) and Horne-Östberg morningness-eveningness questionnaire (MEQ). Participants were excluded if PSQI was > 5 and ESS > 9, scores suggestive of a sleep disorder. Extreme morning and evening types were also excluded from study participation. Screening did not include full polysomnography (PSG); night 2 (N2) PSG data were analyzed for basic sleep parameters (see supplementary material, Table S1). Written and oral informed consent was obtained and participants were allowed to withdraw from the study at any time. All participant information was coded and held in strictest confidence according to the Data Protection Act (UK, 1998).
Study protocol
For 7 days prior to the laboratory session, participants were required to maintain a strict regular sleep-wake schedule (23:00–07:00 hr); compliance was confirmed using activity/light monitors (Actiwatch, CamNtech, Cambridge, UK), completion of sleep logs, and calling a time-stamped voicemail. In addition, they were required to be exposed to at least 15 min of outdoor light within 90 min of waking; participants were requested not to consume caffeine, alcohol, and medication for the final 3 days of this baseline period. This strict baseline period was applied to stabilize the circadian clock and ensure that participants were not sleep deprived upon entering the laboratory.
The 66-hr laboratory session incorporated 3 overnight periods, which were spent in individual sleep laboratories: the adaptation (night 1; N1) and baseline (night 2; N2) nights included a normal sleep period (23:00–07:00 hr), whereas the third night required the participants to remain awake. Upon awakening on day 2, participants experienced a 24-hr baseline wake and light (16 hr)/sleep and dark (8 hr) period followed by 29 hr of continuous wakefulness. Polysomnography monitoring occurred from 22:00–09:00 hr on nights 2 and 3 to confirm sleep on night 2 and that the participants remained awake on night 3 (23:00–07:00 hr extended wakefulness period, dim light, < 5 lux in the direction of gaze). Subjects were required to remain semirecumbent in dim light between 18:00-23:00 hr (artificial dusk period) and 07:00–09:00 hr (artificial dawn), recumbent in darkness between 23:00-07:00 hr on N1 and N2 (sleep condition) with the opportunity to sleep and semirecumbent in dim light on N3 (sleep deprivation condition), and free movement between 09:00–18:00 hr (100 lux). Participants had knowledge of clock time during the laboratory session, and had the opportunity to read or use a computer except for the darkness period on N2. Blood samples were collected into ethylenediaminetetraacetic acid-filled tubes at 3-hr intervals for 48 hr beginning at 12:00 on day 2 using an intravenous catheter. The blood samples on night 2 (23:00-07:00 hr) were taken through a portal in the wall so that sleep was not disturbed; however, nurses were allowed to enter the room to obtain the blood sample if required. An intravenous heparin infusion was used during this sampling period to ensure the system remained patent; sodium heparin in a 0.9 % sodium chloride solution was infused at a rate of 40 ml/hr (corresponding to 200 units/hr) using a volumetric pump. Identical meals were eaten by all participants during the study. The macronutrient composition of the daily food intake reflected the UK dietary guidelines (fat 35%, carbohydrate 50%, protein 15% of energy). Breakfast, lunch, and evening meal were each approximately 30% of daily energy intake, and the night snack was 10%. The breakfast, lunch, dinner, and snack were identical in composition on all days of the study. A detailed protocol of the laboratory study is shown in Figure 1.
Figure 1.
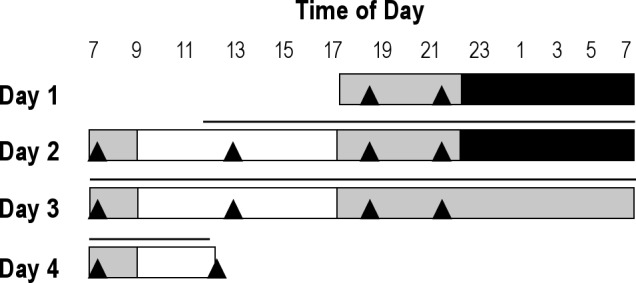
Full laboratory protocol. Black bars indicate sleep periods, 0 lux; gray bars, wake periods in a semirecumbent position, < 5 lux; white bars, free movement and wake, 100 lux; ▴controlled meals; — blood sampling period.
Sample Analysis
Blood samples obtained every 3 hr of the laboratory session (17 per participant) were stored at 4°C until the end of the laboratory session (Surrey CRC) and then shipped immediately on wet ice to Erasmus MC University Medical Center (Rotterdam, The Netherlands) to be analyzed by flow cytometry within 24 hr. The 3-hr sampling interval was chosen to ensure that all samples collected in 1 session could be processed simultaneously for flow cytometry, i.e., using 1 antibody mix for all samples. A pilot study was conducted to assess the effect of storage time on cytometry measures, because the time interval from sample collection to analysis would differ for samples taken on N2 and N3, respectively. Pilot samples were refrigerated at 4°C for up to 6 days at Surrey CRC prior to being shipped to Rotterdam. Flow cytometry measurements were found to be stable for samples kept at 4°C for 1-4 days (48–120 hr until measurement), demonstrating that the influence of these different sample storage times can be regarded as negligible. Samples from 4 participants were unavailable for analysis, resulting in n = 11 for flow cytometry.
Flow cytometry
The following monoclonal antihuman antibodies were used for flow cytometric analyses: Alexa Fluor 700-conjugated anti-CD56 (Exbio, Nuclilab, Ede, The Netherlands), PerCP-Cy5.5 anti-CD45 (BD, Biosciences, Becton Dickinson B.V., Breda, The Netherlands), fluorescein isothiocyanate anti-CD3 (eBioscience, ImmunoSource, Halle-Zoersel, Belgium), allophycocyanin-eFluor 780-conjugated anti-CD8 (eBioscience), phycoerythrin-Cy7 anti-CD4 (eBioscience), allophycocyanin-conjugated anti-CD45RO (eBioscience), phycoerythrin-conjugated anti-CD45RA (Exbio), and PE-dyomics 590-conjugated anti-CD19 (Exbio). Based on these antibodies we discriminated the following cell populations: white blood cells (WBC, all CD45 positive cells), granulocytes (CD45high, side scatterhigh), monocytes (CD45high, side scatterintermediate), lymphocytes (CD45intermediate, side scatterlow), B cells (lymphocyte and CD19+), T cells (lymphocyte and CD3+), CD4 cells (T cell and CD4+CD8-), CD4 memory/effector cells (CD4 m/e; CD4 cell and CD45RAlow, CD45ROhigh ), CD4 naïve cells (CD4 cell and CD45RAhigh, CD45ROlow), CD8 cells (T cell and CD4-CD8+), CD8 memory/effector cells (CD8 m/e; CD8 cell and CD45RAlow, CD45ROhigh), and CD8 naïve cells (CD8 cell and CD45RAhigh, CD45ROlow). Because of technical difficulties of the antibody manufacturer, the anti-CD 56 antibody could not be detected with the cell sorter, and a clear assignment of the natural killer (NK) cell population was not possible. Therefore, the remaining undefined cells in the lymphocyte gate being neither T nor B cells, which mainly consist of NK cells and dendritic cells, were analyzed as 1 population (NK/dendritic cells). The populations given in italics are referred to as ′independent cell types' in the following discussion; for more details on the gating strategy see Figure S1.
Whole blood samples (50 μl per sample) were incubated for 30 min on ice in the dark with a mix of the antibodies listed in the previous paragraph. Subsequently, 0.5 ml of 1x lysing solution IOTest 3 (Beckman Coulter, Mervue, Galway, Ireland) was added and 50 μl Flow-CountTM fluorospheres (Beckman Coulter) were added by reverse pipetting. After another 15 min incubation at room temperature in the dark, samples were kept on ice and analyzed within 2 hr. Data were acquired using a LSR II flow cytometer (Becton Dickinson) equipped with blue (488 nm), red (640 nm), and violet (405 nm) lasers. Raw data coming from the LSRII were analyzed using FlowJo software version 7.6 (Tree Star Inc., Ashland, Oregon).
Statistical analysis
Single cosinor analysis was used to determine peak time, amplitude and significance of fit, and rhythmicity of individual rhythms.26 Linear analysis of variance (ANOVA) was used to test for the effect of condition (sleep versus sleep deprivation) on peak time and amplitude of significant individual rhythms. To further investigate the effect of condition, we performed a paired t test with data obtained on night 2 (sleep) and night 3 (sleep deprivation) for all cell types. As an internal control, a paired t test was also performed for a daytime interval with data obtained on day 2 versus day 3. Nonlinear curve fitting using a cosine function with a 24-hr period on z-scored absolute counts was used to characterize rhythms in each cell subset (nls function of the stats package of R software, version 2.12.0). The model considered the amplitude and peak time as well as inter-individual variation. Equation: z-score = αi + β*cos(2*π*(TP-t)/24); where TP is the time point when the sample was taken, αi is the individual term for the individual i, β is the amplitude, and t the peak time of the cosine function. The null hypotheses to be tested for significance were that the amplitude is not different from zero, and peak times are not different from zero, i.e., close to midnight. To investigate interindividual variation of the different cell populations, the same nonlinear curve fitting was applied to the percentages of absolute counts for a given subset with respect to WBC. Pearson R squared correlation of z-scores between all pairs of independent cell types was computed for all individuals using SPSS version 17 (IBM, Amsterdam, The Netherlands). The correlation matrix was visualized by means of a heat plot.
RESULTS
Individual Rhythms and Effect of Condition in Blood Cell Populations
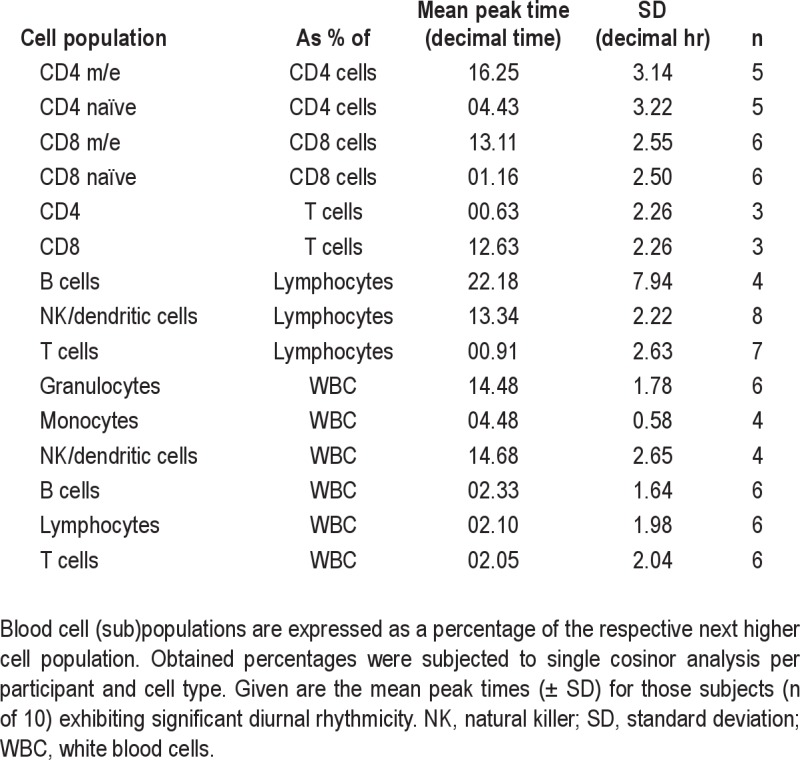
Single cosinor analyses were performed for each individual and cell type to determine significant diurnal rhythmicity and peak time for all the different cell populations investigated. Analyses were done separately for the sleep condition, the sleep deprivation condition, and the collapsed data of both conditions using absolute cell counts (Table 1). The number of participants with significant rhythms in a given cell type was highest for the collapsed data, with the weakest rhythms present in the monocytes and the CD8 m/e cells, whereas the strongest rhythms were present in the CD4 naïve subset. A graphic illustration of the cell counts per cell population in each individual is provided in the supplementary material (Figure S2). One of the participants (S39) showed signs of an acute inflammation, with constantly rising counts for WBC during the 48 hr of the blood sampling period (Pearson linear correlation adjusted R-squared between absolute WBC count and sampling time: 0.6944, P = 1.99e-05), and was therefore excluded from further analysis. To further characterize individual blood cell composition with time of day, cell subsets were expressed as a percentage of the respective next higher cell population (details in Figure S1). Cosine fitting for assessment of rhythmicity and peak time was applied to the obtained percentages for each cell subset and individual (Table S2).
Table 1.
Summary of individual single cosinor analysis for different blood cell (sub)populations
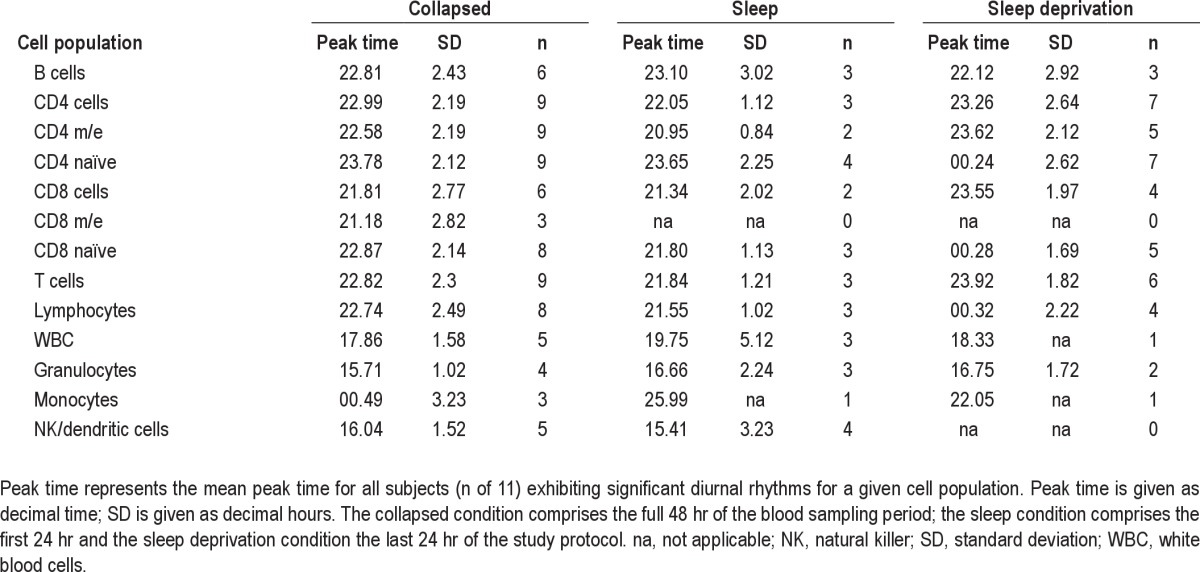
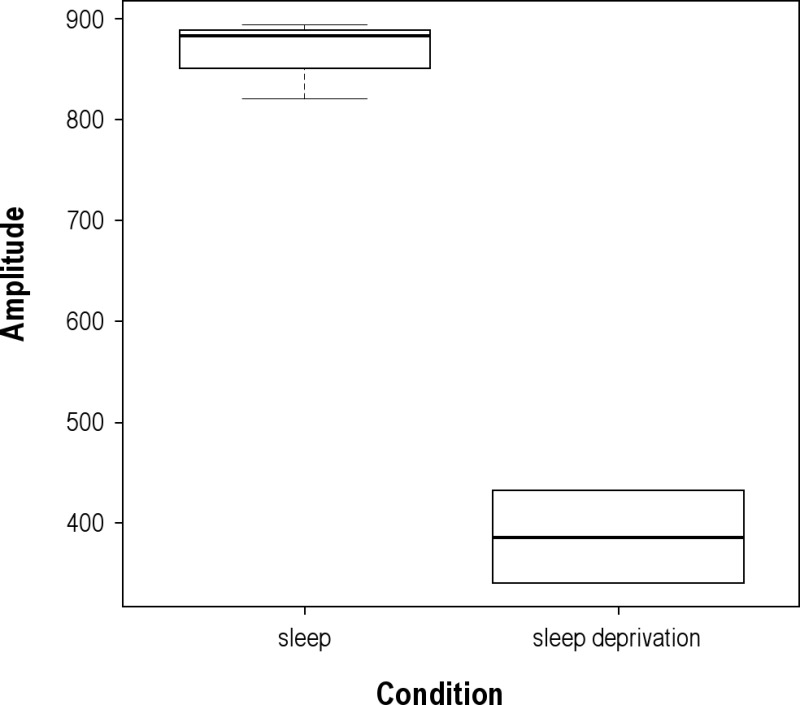
Participants exhibiting significant cosine rhythms were used to assess the effect of condition (sleep versus acute sleep deprivation) on observed amplitude and peak times of independent cell types (CD4 naïve cells, CD4 m/e cells, CD8 naïve cells, CD8 m/e cells, B cells, granulocytes, monocytes, NK/dendritic cells). Although no significant effect of condition on peak time was found, we observed a significant effect of condition on the amplitude (2-way ANOVA between cell type and condition, P = 0.019), which could be explained by the significant increase in the granulocyte population during sleep deprivation (1-way ANOVA between the sleep and sleep deprivation condition, P = 0.0018; see Figure S3). Amplitudes of all of the other independent cell types were not statistically significant, or it was not possible to compute differences due to insufficient sample sizes. Individual granulocyte patterns over the 48-hr sampling period are shown in Figure 2.
Figure 2.
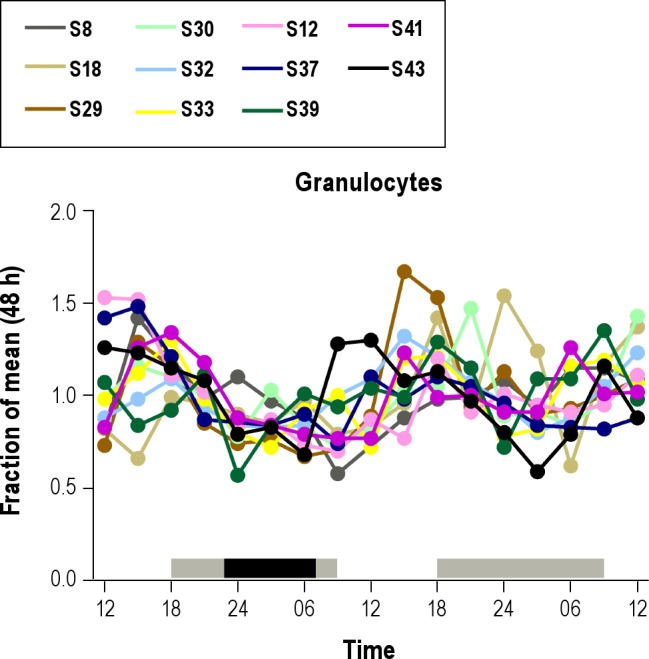
Changes in granulocyte population for each participant over the 48-hr sampling period. For better comparability, cell counts per time point were calculated as a fraction of the mean for each individual. The gray bars indicate wake periods in a semi-recumbent position, < 5 lux; the black bar indicates the sleep period, recumbent position, 0 lux. Note the elevated values in some of the subjects during the sleep deprivation part of the study.
In a second approach, data from all participants and all cell types (independent of single cosinor results) were analyzed by paired t test by time using a nighttime bin (from 21:00–06:00 hr) on both the sleep and sleep deprivation night. Paired t test revealed statistically significant differences at ?α = 0.05 for granulocytes and CD8 m/e cells (P = 0.0073 and P = 0.0125, respectively). Yet, after Bonferroni correction for multiple testing the P value needed for significance (P ≤ 0.0038) was not reached by any cell population; therefore no additional calculations for auto-correlation were performed. As an internal control, the same procedure was applied to a daytime bin (from 12:00–18:00 hr) to confirm that results obtained on day 2 and day 3 were not significantly different from each other (P > 0.093 for all cell types).
Assessment of Comprehensive Overall Rhythmicity in Blood Cell Populations
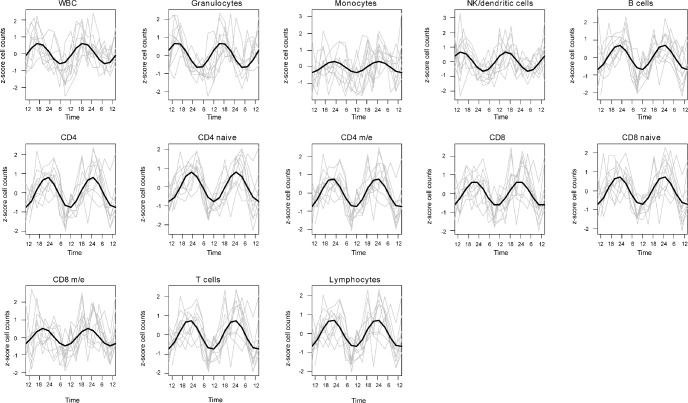
Peak and amplitude parameters of a nonlinear curve fitting using z-scored values for all cell (sub)population types are shown in Table 2 (part A: peak times, part B: amplitudes), and fitted plots are shown in Figure 3. To further investigate the effect of acute sleep deprivation, nonlinear curve fittings were also performed for the sleep and sleep deprivation periods, in addition to the collapsed data. Significant rhythms were detected for all cell (sub)populations investigated, independent of the experimental condition. CD4 (naïve) cells exhibited the most robust and high-amplitude rhythm (independent of condition), whereas the least robust and small-amplitude rhythm was found for monocytes. Notably, the strongest effect of condition was found for the granulocyte population, with the biggest loss in both rhythmicity and amplitude during sleep deprivation.
Table 2.
Summary of overall comprehensive nonlinear curve fitting analysis of z-scored blood cell counts for different cell (sub)populations from 10 individuals concerning peak time (A) and amplitude (B)
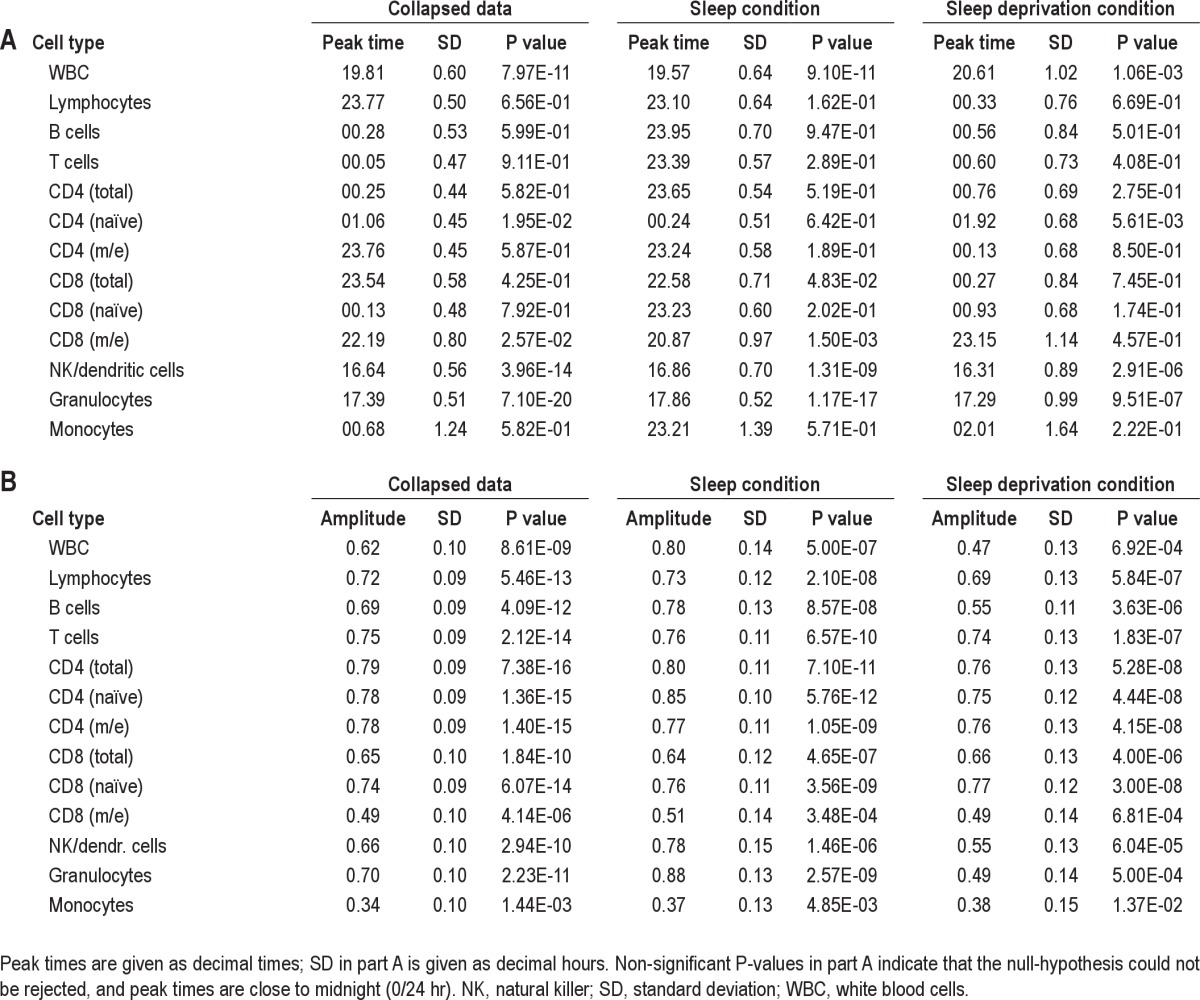
Figure 3.
Nonlinear curve fitting of z-scored blood cell counts. Changes in abundance over the 48-hr sampling period are given for each cell (sub)population under study. Gray lines indicate individual patterns; black lines indicate the cosine curve fitted to the data points for all 10 individuals.
Correlation of Independent Cell Types
To elucidate to what extent hematopoietic lineages are mirrored by the degree of linear association between cell populations as calculated from their observed daily changes in abundance, Pearson correlation for all independent cell types was performed. Results of the correlation between pairs of independent cell types computed with the z scores are shown in Table S3, and are depicted in Figure 4 (heat plot) and in more detail in Figure S4 (pairwise cell-type scatter plots). Cell types from the lymphocyte lineage tended to show large and statistically significant correlations between each other. By contrast, granulocytes showed the lowest correlations with any other given cell type.
Figure 4.
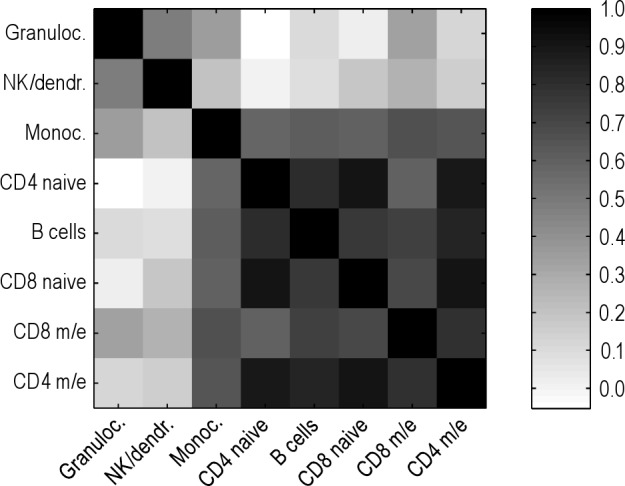
Heat plot for visualization of the correlation matrix. Higher correlation between independent cell types is depicted by darker squares. Rows and columns are sorted by the mean correlation coefficient per row, which is the same per corresponding column.
Interindividual Differences
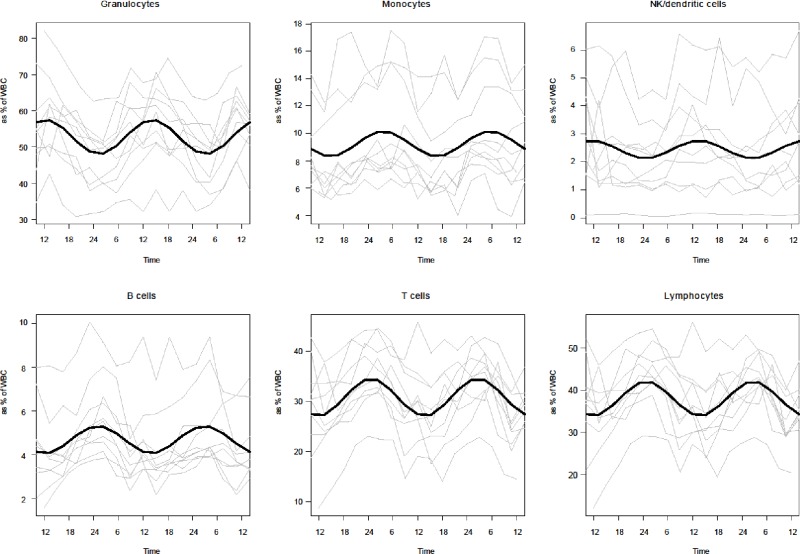
Nonlinear curve fitting performed with the percentages of the different cell types in relation to WBC for each individual showed large interindividual variation, although a general trend could be observed for all individuals and all cell types investigated (Figure S5). Percentage values ranged from approximately 30% up to approximately 80% in granulocytes (as % of WBC) for some individuals and time points.
DISCUSSION
In this study, we investigated diurnal rhythms in the circulating numbers of different blood cell populations during a normal sleep-wake cycle and characterized changes observed during subsequent acute sleep deprivation in a within-subject design. We show for the first time that the diurnal rhythm in granulocyte numbers is significantly affected by sleep loss, exhibiting lower amplitude and loss of rhythmicity, and this is accompanied by an overall increase in the circulating levels of granulocytes. Our results therefore confirm and extend recent findings describing an increase in neutrophil counts after only 1 night of partial sleep restriction.27 Our findings suggest that the observed changes in granulocyte levels directly mirror the body's immediate immune response upon exposure to stress.
Diurnal rhythmicity of blood cell populations was assessed both by individual cosinor analysis and by (comprehensive overall) nonlinear curve fitting, with both approaches assuming a 24-hr period. Although the single cosinor method allows assessment of peak time, amplitude, and rhythmicity of an individual parameter in a given participant and condition, the comprehensive overall approach, where datasets are analyzed in parallel, enables identification of the cell populations showing the most as well as the least robust rhythms over the 24-hr day, as well as exploring the overall effect of sleep versus sleep deprivation. Both methods are in good agreement concerning the observed rhythmicity of blood cell subsets. The strongest rhythms were detected for CD4 cells, including the subsets CD4 naïve and m/e, whereas monocytes were found to have the weakest rhythm. Observed differences in peak times (nonsignificant) were possibly due to the varying sample sets used for analysis (selected versus total) and the slightly different calculation methods.
In general, identified peak times of the different cell populations were in good agreement with values previously reported in the literature.12–20,22,23 Lymphocytes and their subpopulations, as well as monocytes, show peak times during the night, with the exception of NK/dendritic cells, which peak during the (late) afternoon. For granulocytes, we found a peak in circulating levels at approximately 17:30 hr, whereas other groups reported peak times for (neutrophil) granulocytes at a later time, at approximately 20:00 hr.12,19 Interestingly, a recent study by Mazzoccoli et al. describes opposing rhythms in T cell subsets, with circulating numbers of CD8 positive cells peaking at approximately 12:00 hr.28 The number of CD8+ cells, however, was expressed as a percentage of total lymphocytes. Similar findings were reported by Dimitrov and colleagues, who found a daytime peak for CD8+ effector cells.22 Our own dataset also revealed an acrophase at approximately 12:00 hr for CD8+ (m/e) cells when expressed as percentage (Table S2), whereas absolute numbers as used for the initial analysis showed a low-amplitude rhythm (especially for CD8 m/e cells) with a peak at night (Figure S2). Thus, we conclude that the reason for finding a peak of CD8 (m/e) cells at approximately 12:00 hr does not reflect the actual situation in absolute cell numbers, but is merely a result of low versus high diurnal variation between lymphocyte subgroups.
We observed a large heterogeneity in the correlation of the different independent cell types. Whereas granulocytes showed only very weak correlations with any other cell type investigated, populations from the lymphocyte lineage tended to correlate strongly between each other, especially the T cell subsets and B cells. Thus, populations of this lineage also show their relationship in a high degree of association in diurnal rhythmic behavior. NK/dendritic cells, however, showed a much weaker correlation with the lymphocyte lineage, which may be because we were not able to separate the NK cells cleanly from the dendritic cell population. Notably, although monocytes and granulocytes are part of another hematopoietic lineage, monocytes showed much stronger correlations with the lymphocyte lineage than granulocytes. Correlation results were also mirrored by the different nonlinear curve fitting patterns for the independent cell types and their peak times during the 24-hr day, where granulocytes (and NK/dendritic cells) were phase-shifted in comparison with the other populations.
Interindividual variation of the percentage composition of WBC was very high, particularly in the case of the granulocyte population, which ranged between 30-80%. This variation was slightly broader than commonly referred to in the literature.29 The biologic reason behind this marked variation, despite strictly controlled laboratory conditions and the absence of physical stressors known to result in an increased number of granulocytes,30 remain to be elucidated.
The effect of condition (sleep versus sleep deprivation) on observed rhythmicity was assessed by different approaches. Notably, our results consistently indicated that the granulocyte population is the most strongly affected by acute sleep deprivation. In our first approach we only compared data from participants who exhibited significant rhythms in either of the 2 conditions, revealing that a significant reduction in amplitude was observed exclusively for the granulocyte population during sleep deprivation. Comparing data from all subjects using a specified nighttime bin on the 2 study nights confirmed that granulocyte levels were significantly different between the 2 conditions, although this significance disappeared after Bonferroni correction. Importantly, comparing daytime bins before and after a night of 8-hr sleep showed no significant differences for any cell population investigated. In addition, nonlinear curve fitting revealed that granulocytes were most strongly affected by sleep deprivation, resulting in a much reduced amplitude and rhythmicity.
Several studies have addressed the question of the effect of a night of (partial) sleep deprivation on the diurnal rhythm in the number of circulating immune cells using different laboratory protocols. Although most studies did not detect significant differences between the sleep and the sleep deprivation condition,11,18,22,25 some studies described an increase of WBC (or subpopulations) during sleep deprivation.12,14 To our knowledge, an immediate effect of sleep loss on granulocyte rhythmicity with respect to peak time and/or amplitude has not been previously reported. Several studies have investigated the effect of (prolonged) sleep deprivation on blood cell counts using blood samples from a limited number of time points, thus without taking into account diurnal rhythmicity of circulating blood cell populations. For example, Dinges and colleagues reported an increase in granulocyte levels at the end of a 64-hr period of total sleep deprivation, comparing samples taken once per day.31 Another study analyzed blood samples obtained at 3 different time points per day (07:00, 13:00, 19.00 hr) from 3 consecutive days including a night of total sleep deprivation on night 2, and an 8-hr recovery sleep on night 3.32 These authors reported a significant increase in granulocytes after both sleep deprivation and recovery sleep for the 07:00 hr time point only. In agreement, Faraut and colleagues recently described a significant increase in neutrophil counts the morning after a night of sleep restriction, which persisted even after a night of 8-hr recovery sleep.27 The authors also investigated the effect of an additional nap or a lengthened recovery sleep of 10 hr, both of which were shown to be sufficient to reduce increased neutrophil levels to baseline values. In this study blood was also only sampled at 1 time point (07:00 hr). Results from these studies both strongly support our findings of an effect of acute sleep deprivation on diurnal rhythms in granulocytes,27,32 resulting in higher levels, reduced amplitude, and reduced rhythmicity. Furthermore, the 2 studies support the conclusion that granulocytes react immediately to the physical stress of sleep loss, and directly mirror the body's stress response.
Chronic (partial) sleep loss is part of our modern 24-hr, 7-days-a-week society, and long-term consequences on the immune system, accompanied by an increased risk of developing cardiovascular disease, metabolic syndrome, obesity, diabetes, etc., have been identified.3,8,9 In addition, it has recently been demonstrated that the effect of total sleep deprivation on the postprandial metabolic and insulin response was more pronounced in nonshift workers compared with shift workers, suggesting the possibility of an ′adaptation effect' accompanying long-term shift work.33 The molecular mechanisms leading to the pathologic changes, however, are not well characterized. Our demonstration of the effect of sleep deprivation on granulocyte levels needs further investigation to better understand its role in the development of these long-term diseases.34 This will have implications for clinical practice and for professions associated with long-term sleep loss such as rotating shift workers.
In summary, the current study offers a detailed analysis of diurnal rhythms in circulating levels of different blood cell populations, their correlation with each other, and a comprehensive statistical assessment of the influence of a night of total sleep deprivation. We have demonstrated that granulocyte rhythmicity is severely affected by acute sleep deprivation, with higher circulating levels, lower amplitude, and loss of rhythmicity. Future research will reveal the molecular mechanisms behind this immediate stress response and elucidate its role in the development of diseases associated with chronic sleep loss.
DISCLOSURE STATEMENT
This was not an industry supported study. Dr. Skene has received research support from Philips Lighting and is the co-director of Stockgrand Ltd. Dr. Revell is a scientific advisor to Lumie Ltd. and has received research support from Philips Lighting. The other authors have indicated no financial conflicts of interest.
ACKNOWLEDGMENTS
Work for this study was performed at University of Surrey (UK) and Erasmus MC University Medical Centre Rotterdam (NL). The authors thank Daniel Barrett and the Surrey CRC clinical and research teams for their help with the laboratory study, and Andreas Wollstein for generating the heat plot. This work was supported by the Netherlands Forensic Institute (NFI), and received additional support by a grant from the Netherlands Genomics Initiative (NGI)/Netherlands Organization for Scientific Research (NWO) within the framework of the Forensic Genomics Consortium Netherlands (FGCN).
ABBREVIATIONS
- ANOVA
analysis of variance
- CRC
Clinical Research Centre
- m/e
memory/effector
- NK cells
natural killer cells
- WBC
white blood cells
- PSQI
Pittsburgh Sleep Quality Index
- ESS
Epworth Sleepiness Scale
- MEQ
Horne-Östberg morningness-eveningness questionnaire
- PSG
polysomnography
Footnotes
A commentary on this article appears in this issue on page 895.
SUPPLEMENTAL MATERIAL
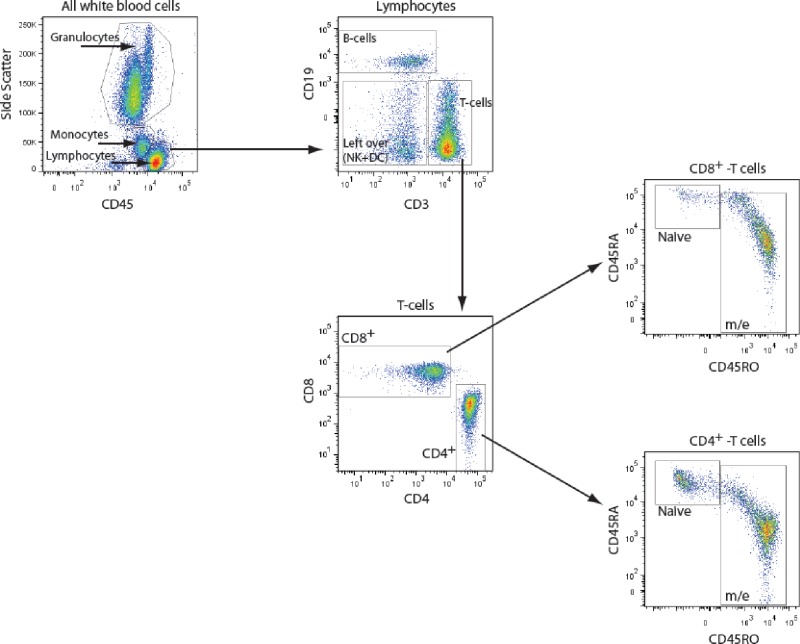
Gating strategy for flow cytometry measurements. Based on the antibodies used (see Materials and Methods) we defined the following cell populations: granulocytes (CD45high, side scatterhigh), monocytes (CD45high, side scatterintermediate), lymphocytes (CD45intermediate, side scatterlow), and total white blood cells (WBC) (all CD45+ cells). Cells in the lymphocyte gate were subsequently separated into B cells (CD19+) and T cells (CD3+). The remaining undefined cells in the lymphocyte gate being neither T nor B cells mainly consist of natural killer (NK) cells and dendritic cells (negative for CD3 and CD19, indicated in the plot as ′left over'). The T cell subset was further subdivided into CD4 positive T-helper cells and CD8 positive cytotoxic T cells, both of which could be separated into naïve and memory/effector cells based on the expression of CD45RA and CD45RO.
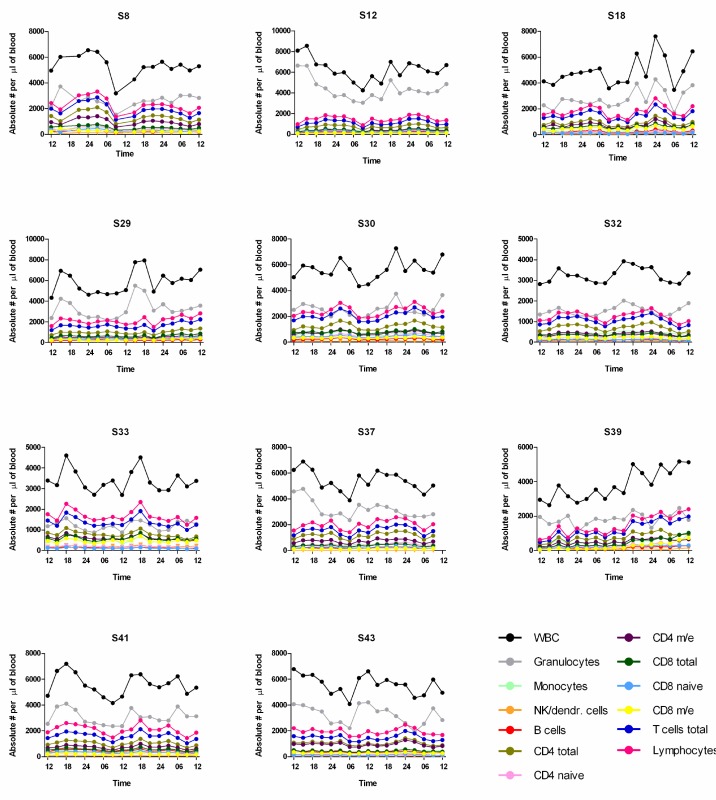
Absolute cell numbers per μl of blood per subject. Graphical illustration of individual absolute cell counts per μl of blood for each cell (sub)population over the 48-hr sampling period. Note the constantly rising values for white blood cells (WBC) in subject S39.
Granulocyte amplitude in different experimental conditions. Box-plot showing differences observed in the amplitude of the granulocyte population for sleep versus sleep deprivation. Participants exhibiting significant rhythms as obtained by single cosinor analysis were used to assess the effect of condition (sleep versus acute sleep deprivation) on the observed amplitude of granulocytes by one-way analysis of variance (n = 3 for the sleep condition, n = 2 for the sleep deprivation condition, P = 0.0018).
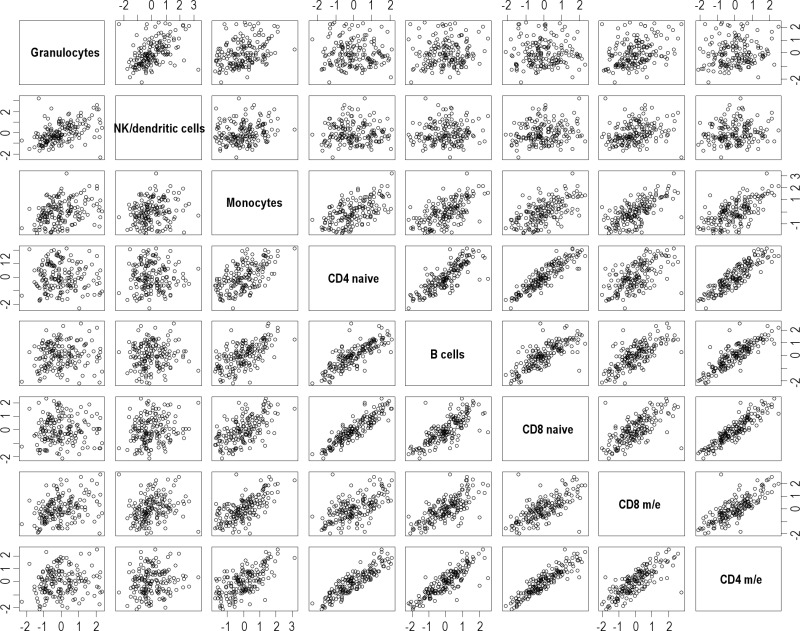
Pairwise cell type scatter plots. Pairwise cell-type scatter plots for detailed representation of the correlation matrix. Rows and columns are sorted by the mean correlation coefficient per row, which is the same per corresponding column.
Interindividual differences in WBC composition. Cell counts for granulocytes, monocytes, natural killer (NK)/dendritic cells, B cells, T cells, and lymphocytes are expressed as % of white blood cells (WBC). Depicted are individual curves over the 48-hr sampling period (gray lines), and the respective curves resulting from nonlinear curve fitting of all individuals (black lines). Note the large interindividual variation in percentages, especially with respect to the granulocyte population.
Polysomnography (PSG) data obtained on night 2 (N2)
Single cosinor analysis of percentage blood cell populations
Pearson correlation of independent cell types
REFERENCES
- 1.Hastings MH, Reddy AB, Maywood ES. A clockwork web: circadian timing in brain and periphery, in health and disease. Nat Rev Neurosci. 2003;4:649–61. doi: 10.1038/nrn1177. [DOI] [PubMed] [Google Scholar]
- 2.Bollinger T, Bollinger A, Oster H, Solbach W. Sleep, immunity, and circadian clocks: a mechanistic model. Gerontology. 2010;56:574–80. doi: 10.1159/000281827. [DOI] [PubMed] [Google Scholar]
- 3.Lange T, Dimitrov S, Born J. Effects of sleep and circadian rhythm on the human immune system. Ann N Y Acad Sci. 2010;1193:48–59. doi: 10.1111/j.1749-6632.2009.05300.x. [DOI] [PubMed] [Google Scholar]
- 4.Laposky AD, Bass J, Kohsaka A, Turek FW. Sleep and circadian rhythms: key components in the regulation of energy metabolism. FEBS Lett. 2008;582:142–51. doi: 10.1016/j.febslet.2007.06.079. [DOI] [PubMed] [Google Scholar]
- 5.Bass J, Takahashi JS. Circadian integration of metabolism and energetics. Science. 2010;330:1349–54. doi: 10.1126/science.1195027. [DOI] [PMC free article] [PubMed] [Google Scholar]
- 6.Gangwisch JE. Epidemiological evidence for the links between sleep, circadian rhythms and metabolism. Obes Rev. 2009;10(Suppl 2):37–45. doi: 10.1111/j.1467-789X.2009.00663.x. [DOI] [PMC free article] [PubMed] [Google Scholar]
- 7.Wang XS, Armstrong ME, Cairns BJ, Key TJ, Travis RC. Shift work and chronic disease: the epidemiological evidence. Occup Med (Lond) 2011;61:78–89. doi: 10.1093/occmed/kqr001. [DOI] [PMC free article] [PubMed] [Google Scholar]
- 8.Mullington JM, Haack M, Toth M, Serrador JM, Meier-Ewert HK. Cardiovascular, inflammatory, and metabolic consequences of sleep deprivation. Prog Cardiovasc Dis. 2009;51:294–302. doi: 10.1016/j.pcad.2008.10.003. [DOI] [PMC free article] [PubMed] [Google Scholar]
- 9.Mullington JM, Simpson NS, Meier-Ewert HK, Haack M. Sleep loss and inflammation. Best Pract Res Clin Endocrinol Metab. 2010;24:775–84. doi: 10.1016/j.beem.2010.08.014. [DOI] [PMC free article] [PubMed] [Google Scholar]
- 10.Benedict C, Dimitrov S, Marshall L, Born J. Sleep enhances serum interleukin-7 concentrations in humans. Brain Behav Immun. 2007;21:1058–62. doi: 10.1016/j.bbi.2007.04.004. [DOI] [PubMed] [Google Scholar]
- 11.Bollinger T, Bollinger A, Skrum L, Dimitrov S, Lange T, Solbach W. Sleep-dependent activity of T cells and regulatory T cells. Clin Exp Immunol. 2009;155:231–8. doi: 10.1111/j.1365-2249.2008.03822.x. [DOI] [PMC free article] [PubMed] [Google Scholar]
- 12.Born J, Lange T, Hansen K, Molle M, Fehm HL. Effects of sleep and circadian rhythm on human circulating immune cells. J Immunol. 1997;158:4454–64. [PubMed] [Google Scholar]
- 13.Dimitrov S, Lange T, Nohroudi K, Born J. Number and function of circulating human antigen presenting cells regulated by sleep. Sleep. 2007;30:401–11. doi: 10.1093/sleep/30.4.401. [DOI] [PubMed] [Google Scholar]
- 14.Dimitrov S, Lange T, Tieken S, Fehm HL, Born J. Sleep associated regulation of T helper 1/T helper 2 cytokine balance in humans. Brain Behav Immun. 2004;18:341–8. doi: 10.1016/j.bbi.2003.08.004. [DOI] [PubMed] [Google Scholar]
- 15.Kronfol Z, Nair M, Zhang Q, Hill EE, Brown MB. Circadian immune measures in healthy volunteers: relationship to hypothalamic-pituitary-adrenal axis hormones and sympathetic neurotransmitters. Psychosom Med. 1997;59:42–50. doi: 10.1097/00006842-199701000-00006. [DOI] [PubMed] [Google Scholar]
- 16.Melchart D, Martin P, Hallek M, Holzmann M, Jurcic X, Wagner H. Circadian variation of the phagocytic activity of polymorphonuclear leukocytes and of various other parameters in 13 healthy male adults. Chronobiol Int. 1992;9:35–45. doi: 10.3109/07420529209064514. [DOI] [PubMed] [Google Scholar]
- 17.Palm S, Postler E, Hinrichsen H, Maier H, Zabel P, Kirch W. Twenty-four-hour analysis of lymphocyte subpopulations and cytokines in healthy subjects. Chronobiol Int. 1996;13:423–34. doi: 10.3109/07420529609020913. [DOI] [PubMed] [Google Scholar]
- 18.Ritchie AW, Oswald I, Micklem HS, et al. Circadian variation of lymphocyte subpopulations: a study with monoclonal antibodies. Br Med J (Clin Res Ed) 1983;286:1773–5. doi: 10.1136/bmj.286.6380.1773. [DOI] [PMC free article] [PubMed] [Google Scholar]
- 19.Selmaoui B, Bogdan A, Auzeby A, Lambrozo J, Touitou Y. Acute exposure to 50 Hz magnetic field does not affect hematologic or immunologic functions in healthy young men: a circadian study. Bioelectromagnetics. 1996;17:364–72. doi: 10.1002/(SICI)1521-186X(1996)17:5<364::AID-BEM3>3.0.CO;2-1. [DOI] [PubMed] [Google Scholar]
- 20.Vagnucci AH, Winkelstein A. Circadian rhythm of lymphocytes and their glucocorticoid receptors in HIV-infected homosexual men. J Acquir Immune Defic Syndr. 1993;6:1238–47. [PubMed] [Google Scholar]
- 21.Tsinkalovsky O, Smaaland R, Rosenlund B, et al. Circadian variations in clock gene expression of human bone marrow CD34+ cells. J Biol Rhythms. 2007;22:140–50. doi: 10.1177/0748730406299078. [DOI] [PubMed] [Google Scholar]
- 22.Dimitrov S, Benedict C, Heutling D, Westermann J, Born J, Lange T. Cortisol and epinephrine control opposing circadian rhythms in T cell subsets. Blood. 2009;113:5134–43. doi: 10.1182/blood-2008-11-190769. [DOI] [PMC free article] [PubMed] [Google Scholar]
- 23.Mazzoccoli G, Inglese M, De Cata A, et al. Neuroendocrine-immune interactions in healthy aging. Geriatr Gerontol Int. 2010;11:98–106. doi: 10.1111/j.1447-0594.2010.00628.x. http://dx.doi.org/10.1111/j.1447-0594.2010.00628.x. [DOI] [PubMed] [Google Scholar]
- 24.Haus E, Smolensky MH. Biologic rhythms in the immune system. Chronobiol Int. 1999;16:581–622. doi: 10.3109/07420529908998730. [DOI] [PubMed] [Google Scholar]
- 25.Redwine L, Dang J, Irwin M. Cellular adhesion molecule expression, nocturnal sleep, and partial night sleep deprivation. Brain Behav Immun. 2004;18:333–40. doi: 10.1016/j.bbi.2004.01.001. [DOI] [PubMed] [Google Scholar]
- 26.Minors D, Waterhouse J. Analysis of biological time series. In: Arendt J, Minors D, Waterhouse J, editors. Biological rhythms in clinical practice. London: Wright; 1989. pp. 272–93. [Google Scholar]
- 27.Faraut B, Boudjeltia KZ, Dyzma M, et al. Benefits of napping and an extended duration of recovery sleep on alertness and immune cells after acute sleep restriction. Brain Behav Immun. 2011;25:16–24. doi: 10.1016/j.bbi.2010.08.001. [DOI] [PubMed] [Google Scholar]
- 28.Mazzoccoli G, De Cata A, Greco A, et al. Opposing circadian rhythms of CD3+, CD4+ and CD3+, CD8+ lymphocyte subpopulations in healthy humans. Biological Rhythm Research. 2011;42:111–8. [Google Scholar]
- 29.Pagana KD, Pagana TJ. Mosby's Diagnostic and Laboratory Test Reference. 3rd ed. St. Louis: Mosby; 1997. [Google Scholar]
- 30.Landmann RM, Muller FB, Perini C, Wesp M, Erne P, Buhler FR. Changes of immunoregulatory cells induced by psychological and physical stress: relationship to plasma catecholamines. Clin Exp Immunol. 1984;58:127–35. [PMC free article] [PubMed] [Google Scholar]
- 31.Dinges DF, Douglas SD, Zaugg L, et al. Leukocytosis and natural killer cell function parallel neurobehavioral fatigue induced by 64 hours of sleep deprivation. J Clin Invest. 1994;93:1930–9. doi: 10.1172/JCI117184. [DOI] [PMC free article] [PubMed] [Google Scholar]
- 32.Heiser P, Dickhaus B, Schreiber W, et al. White blood cells and cortisol after sleep deprivation and recovery sleep in humans. Eur Arch Psychiatry Clin Neurosci. 2000;250:16–23. doi: 10.1007/pl00007534. [DOI] [PubMed] [Google Scholar]
- 33.Wehrens SM, Hampton SM, Finn RE, Skene DJ. Effect of total sleep deprivation on postprandial metabolic and insulin responses in shift workers and non-shift workers. J Endocrinol. 2010;206:205–15. doi: 10.1677/JOE-10-0077. [DOI] [PubMed] [Google Scholar]
- 34.Lange T, Born J. The immune recovery function of sleep: tracked by neutrophil counts. Brain Behav Immun. 2011;25:14–5. doi: 10.1016/j.bbi.2010.08.008. [DOI] [PubMed] [Google Scholar]
Associated Data
This section collects any data citations, data availability statements, or supplementary materials included in this article.
Supplementary Materials
Gating strategy for flow cytometry measurements. Based on the antibodies used (see Materials and Methods) we defined the following cell populations: granulocytes (CD45high, side scatterhigh), monocytes (CD45high, side scatterintermediate), lymphocytes (CD45intermediate, side scatterlow), and total white blood cells (WBC) (all CD45+ cells). Cells in the lymphocyte gate were subsequently separated into B cells (CD19+) and T cells (CD3+). The remaining undefined cells in the lymphocyte gate being neither T nor B cells mainly consist of natural killer (NK) cells and dendritic cells (negative for CD3 and CD19, indicated in the plot as ′left over'). The T cell subset was further subdivided into CD4 positive T-helper cells and CD8 positive cytotoxic T cells, both of which could be separated into naïve and memory/effector cells based on the expression of CD45RA and CD45RO.
Absolute cell numbers per μl of blood per subject. Graphical illustration of individual absolute cell counts per μl of blood for each cell (sub)population over the 48-hr sampling period. Note the constantly rising values for white blood cells (WBC) in subject S39.
Granulocyte amplitude in different experimental conditions. Box-plot showing differences observed in the amplitude of the granulocyte population for sleep versus sleep deprivation. Participants exhibiting significant rhythms as obtained by single cosinor analysis were used to assess the effect of condition (sleep versus acute sleep deprivation) on the observed amplitude of granulocytes by one-way analysis of variance (n = 3 for the sleep condition, n = 2 for the sleep deprivation condition, P = 0.0018).

Pairwise cell type scatter plots. Pairwise cell-type scatter plots for detailed representation of the correlation matrix. Rows and columns are sorted by the mean correlation coefficient per row, which is the same per corresponding column.
Interindividual differences in WBC composition. Cell counts for granulocytes, monocytes, natural killer (NK)/dendritic cells, B cells, T cells, and lymphocytes are expressed as % of white blood cells (WBC). Depicted are individual curves over the 48-hr sampling period (gray lines), and the respective curves resulting from nonlinear curve fitting of all individuals (black lines). Note the large interindividual variation in percentages, especially with respect to the granulocyte population.
Polysomnography (PSG) data obtained on night 2 (N2)

Single cosinor analysis of percentage blood cell populations

Pearson correlation of independent cell types


