

Abstract
Study Objectives:
To investigate the relative contributions of the homeostatic and circadian processes on sleep regulation under conditions of severe sleep restriction.
Design:
The 13-day laboratory based study consisted of 3 × 24-h baseline days (8 h sleep opportunity, 16 h wake) followed by 7 × 28-h forced desynchrony days (4.7 h sleep opportunity, 23.3 h wake).
Setting:
The study was conducted in a time isolation unit at the Centre for Sleep Research, University of South Australia.
Participants:
Fourteen healthy, nonsmoking males, aged 21.8 ± 3.8 (mean ± SD) years participated in the study.
Interventions:
N/A
Measurements:
Sleep was measured using standard polysomnography. Core body temperature (CBT) was recorded continuously using a rectal thermistor. Each epoch of sleep was assigned a circadian phase based on the CBT data (6 × 60-degree bins) and an elapsed time into sleep episode (2 × 140-min intervals).
Results:
The percentage of SWS decreased with elapsed time into the sleep episode. However, no change in the percentage of REM sleep was observed with sleep progression. Whilst there was a circadian modulation of REM sleep, the amplitude of the circadian variation was smaller than expected. Sleep efficiency remained high throughout the sleep episode and across all circadian phases.
Conclusions:
Previous forced desynchrony studies have demonstrated a strong circadian influence on sleep, in the absence of sleep restriction. The current study suggests that in the presence of high homeostatic pressure, the circadian modulation of sleep, in particular sleep efficiency and to a lesser extent, REM sleep, are reduced.
Citation:
Paech GM; Ferguson SA; Sargent C; Kennaway DJ; Roach GD. The relative contributions of the homeostatic and circadian processes to sleep regulation under conditions of severe sleep restriction. SLEEP 2012;35(7):941-948.
Keywords: Homeostatic, circadian, slow wave sleep, REM sleep, sleep restriction
INTRODUCTION
Three processes underlie sleep regulation; a homeostatic process determined by prior sleep and wake, the output from an endogenous circadian pacemaker located in the suprachiasmatic nucleus in the hypothalamus, and an ultradian process occurring during sleep. The original two-process model, defined by Borbáely, describes the interactive and individual effects of the homeostatic and circadian processes on sleep structure and consolidation.1 The ultradian process defines the oscillations between the two basic sleep states, NREM and REM sleep.1–5 The slow wave sleep (SWS) component of NREM sleep is largely influenced by the homeostatic process,1,4,6–8 and REM sleep is primarily regulated by the endogenous circadian pacemaker.2,4,8–10 In addition, sleep propensity and consolidation are also influenced by the endogenous circadian pacemaker.4,7,8
Sleep initiated around the minimum of the endogenous core body temperature rhythm is associated with high sleep propensity and consolidation,4,7,8,11–14 while sleep initiated around the maximum of the endogenous core body temperature rhythm is associated with poor sleep propensity and consolidation.4,7,8,11,12 The increased wakefulness observed around the acrophase of the endogenous core body temperature rhythm results from a strong wake-promoting signal.4 REM sleep is also strongly modulated by circadian timing, with maximal REM sleep observed around the endogenous circadian temperature nadir, and minimal REM sleep observed around the acrophase of the endogenous core body temperature rhythm.4,8–10 The strong circadian modulation of REM sleep indicates that the circadian process is the main contributing factor on the regulation and timing of REM sleep.2,4,8–10 However, there is evidence to support a degree of homeostatic regulation on REM sleep.4,7,8,15,16
Although SWS, specifically the slow wave activity facet of NREM sleep, is recognized as a primary indicator of homeostatic pressure,1,6,13,17,18 a mild homeostatic modulation of REM sleep also exists.16 Following periods of extended wakefulness, the sleep episode contains a high percentage of SWS.1 With sleep progression, homeostatic pressure dissipates and a sleep-dependent disinhibition of REM sleep occurs. Concomitantly, a decline in SWS and an increase in REM sleep are observed with each subsequent NREM-REM cycle.4,7,8 Under conditions of restricted nocturnal sleep, the percentage of SWS remains unchanged or increases from baseline levels, whereas the percentage of REM sleep is reduced, indicating a stronger homeostatic influence for SWS than for REM sleep.17,18 Although the homeostatic process regulates SWS largely independently of circadian timing, REM sleep is regulated by the combined actions of the homeostatic and circadian processes.4,7,8
As sleep pressure declines, the circadian modulation of REM sleep becomes increasingly prominent, so that when the latter portion of the sleep episode coincides with the minimum of the endogenous core body temperature rhythm, higher amounts of REM sleep are observed.4,7,8 Equally, when the latter portion of the sleep episode coincides with the maximum of the endogenous core body temperature rhythm, lower amounts of REM sleep are observed.4,7,8 The interactions between the homeostatic and circadian processes are not limited to REM sleep. Circadian modulation of sleep consolidation also increases with dissipating homeostatic pressure.4,7,8
The influences of the homeostatic and circadian processes on sleep regulation involve complex interactions between these two processes. Current understanding of the interactions between the homeostatic and circadian processes has largely been derived from forced desynchrony studies. Forced desynchrony studies enable the contributions of both the homeostatic and circadian influences on sleep regulation to be investigated within a single protocol.19 In previous forced desynchrony studies the sleep-wake ratio has been set at 1:2 or the equivalent of an 8-h sleep opportunity within a standard 24-h day. However, the relative influences of the homeostatic and circadian processes on sleep regulation when the sleep opportunity is restricted are currently unknown. Therefore, the aim of the current study was to investigate the relative contributions of homeostatic pressure and the circadian pacemaker on sleep during forced desynchrony with a restricted sleep opportunity. It was hypothesized that under conditions of severe sleep restriction, the increased homeostatic pressure would be associated with a reduction in the circadian modulation of wake within a scheduled sleep episode and the circadian modulation of REM sleep, albeit to a lesser extent.
METHODS
Participants
Fourteen healthy, nonsmoking males (age: 21.8 ± 3.8 [mean ± SD], BMI: 22.4 ± 2.5 kg/m2) participated in the study. Participants' health status was assessed using a general health questionnaire. Based on responses to the questionnaire, participants were assessed as being free from any medical conditions, psychiatric disorders, or sleep disorders. Participants were not taking any prescription medication and were low-to-moderate consumers of alcohol (i.e., < 7 standard drinks/week) and caffeine (i.e., < 350 mg caffeine/day). Participants had not undertaken shiftwork or transmeridian travel within 3 months prior to the start of the study. Participants had regular habitual sleep-wake patterns, with an average bedtime of 23:00 ± 00:42, an average get-up time of 08:15 ± 00:52, and an average sleep duration of 8.0 ± 1.0 hours. This was verified with sleep diaries and wrist activity monitors (Actiwatch-64, Philips Respironics, Bend, Oregon) collected over a 1-week period during initial screening. This study had approval from the University of South Australia Human Ethics Committee, using guidelines established by the National Health and Medical Research Council of Australia. All participants gave written consent to participate in the study and were aware that their participation was completely voluntary and that they could withdraw at any time. Upon exiting the study, participants were given a financial compensation for the time spent in the laboratory.
Study Design
For one week prior to study commencement, participants were required to maintain their habitual sleep-wake pattern with ≥ 8-h sleep opportunity each night, which was verified using sleep diaries and wrist activity monitors (Actiwatch-64, Philips Respironics, Bend, Oregon). Participants lived in the laboratory for 13 consecutive days. During this time, participants were scheduled to two 24-h adaptation days (Adaptation 1 and 2) with 8-h sleep opportunity and 16 h of wakefulness and one baseline day (FD0) with 4.7-h sleep opportunity. This was followed by seven 28-h forced desynchrony days (FD1-FD7). The forced desynchrony portion of the study consisted of a 4.7-h sleep opportunity and a 23.3-h wake episode (Figure 1). In this way sleep and wake episodes occurred 4 h later each day and across all circadian phases.
Figure 1.
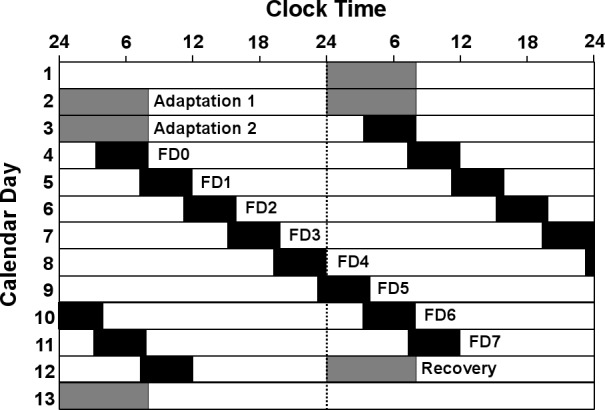
Double raster plot of the forced desynchrony protocol. Successive days are plotted both next to and underneath each other. Solid black bars indicate the given sleep opportunity.
Participants completed the protocol in groups of 3, with each participant assigned an individual bedroom, lounge area, and bathroom facility. During wake periods, light intensity at angle of gaze was 10-15 lux and < 0.03 lux during sleep periods. Ambient temperature was 22 ± 1°C at all times. All time cues were absent throughout the study (e.g., clocks, sunlight, internet, noise). Experimenters were trained not to convey time of day information to participants. During wake periods beginning 1.5 h after waking, 1-h neurobehavioral test batteries were performed every 2.5 hours. Results from neurobehavioral tests are reported in Zhou et al.20 During free periods, participants refrained from physical activity but were allowed to watch movies, read, and listen to music. Participants were free to chat among themselves but were discouraged from doing this regularly (i.e., for only a few minutes during any given free period). Bedrooms and lounges were equipped with a closed circuit video camera to monitor participants' behavior during sleep and wake periods. Participants ate meals in a shared dining area. Approximately 1 h prior to the start of the scheduled sleep episode, electrodes were applied to participants and removed following the sleep episode.
Core Body Temperature
Core body temperature (CBT) was recorded continuously at 1-min intervals using a rectal thermistor (Steri-probe 491B, Cincinnati Sub-Zero Products, Cincinnati, Ohio) connected to a Mini Mitter datalogger (Philips Respironics, Bend, Oregon), inserted 10 cm into the rectum. The CBT data provided a circadian phase estimate for each participant. CBT data were assessed visually throughout waking periods and immediately prior to sleep episodes to ensure that temperature was being recorded accurately. Activity levels were recorded continuously with wrist activity monitors (Actiwatch-64, Philips Respironics, Bend, Oregon).
Circadian Phase Estimates
The generation of phase estimates from the CBT data was a 5-step process which involved: (1) cleaning of the raw CBT data to account for invalid or missing values due to downloading of the data, probe slippage, or technical malfunctions; (2) de-masking for physical activity using a purification by intercepts approach21; (3) de-masking for sleep-wake differences using a sleep state correction factor; (4) fitting a cosine equation with a fundamental period and a single harmonic to the de-masked CBT data using a method of least squares; and (5) assigning a circadian phase estimate (0-360°) to each minute of the forced desynchrony proportion of the protocol using the resultant cosine equation. This process is described in greater detail in Darwent et al.22 The endogenous period length of the circadian rhythm ranged between 23.8 h and 24.6 hours. The average endogenous period length was 24.2 ± 0.2 h, which is consistent with previous reports.23
Sleep Recordings
Sleep was recorded for all scheduled sleep periods using standard polysomnography techniques acquired with the Compumedics 10-20 E-Series EEG/PSG (Melbourne, Victoria). Participants were fitted with Grass Gold Cup Electrodes (Abbotsford, Victoria) according to a standard montage including 2 electroencephalographic (EEG) channels (C3, C4) referenced to contralateral mastoids (A1, A2), 2 electrooculograms (left and right outer canthi), and 2 submental electromyograms. EEG signals were sampled with a high-pass filter of 0.30 Hz and a low-pass filter of 30 Hz at a sampling rate of 250 Hz. Sleep was scored according to standard criteria.24
Sleep onset latency was defined as the duration taken to fall asleep from the start of recording (i.e., “lights-out”) to the first epoch of any stage of sleep. REM latency was defined as the time taken from sleep onset to the first epoch of REM sleep. Stages of sleep (stage 2, SWS [stages 3-4], and REM sleep) were expressed as a percentage of total sleep time (TST). Sleep efficiency was expressed as a percentage of recording time (RT) from lights-out to lights-on.
Data Analyses
To assess the circadian influence on sleep, each 30-sec epoch of sleep was assigned a circadian phase between 0° and 359°. Data were then averaged into 60° circadian bins, which were centered at 0° (330°-30°), 60° (30°-90°), 120° (90°-150°), 180° (150°-210°), 240° (210°-270°), and 300° (270°-330°), irrespective of time elapsed into the sleep episode. To assess the sleep-dependent influence on sleep, each 30-sec epoch of sleep was assigned an elapsed time from the start of recording (“lights-out”) and binned into 140-min intervals (halves) irrespective of circadian phase. All data were first averaged within participants and then averaged across participants.
Statistical Analyses
All data were analyzed using SPSS v.17 for Windows. Mixed model analyses were performed to assess the main and interaction effects of “circadian phase” and “elapsed time” on sleep efficiency, stage 2, SWS, and REM sleep. Mixed model analyses were also performed to assess the main effect of “circadian phase” on sleep latency and REM latency. Sleep latency was not normally distributed, so was log transformed prior to statistical analyses. To determine if increased homeostatic pressure reduces the circadian modulation of sleep, separate mixed model analyses between the first (0–140 min) and second (141–280 min) halves of the sleep episodes were performed to assess the main effect of “circadian phase” on sleep efficiency, stage 2, SWS, and REM sleep. Where significant main effects were observed, post hoc analyses using pairwise comparisons (least significant difference) were performed for closer examination of the variables “circadian phase” and “elapsed time.” Data are presented as mean ± SD, and significance was assumed at P ≤ 0.05.
RESULTS
Sleep Initiation and Consolidation
There was a main effect of “circadian phase” on sleep latency (F5,63 = 6.9, P < 0.001). Sleep latency was longest (4.6 ± 2.8 min) when the circadian phase at the start of the sleep episode was centered at 240° and was shortest (1.8 ± 0.6 min) when the start of the sleep episode was centered at 60° (Figure 2). There was no main effect of “circadian phase” on REM latency (F5,63 = 0.4, P = 0.8). REM latency ranged between 57.0 ± 23.8 min and 64.8 ± 11.5 min when the start of the sleep episode was centered at 60° and 240°, respectively (Figure 2).
Figure 2.
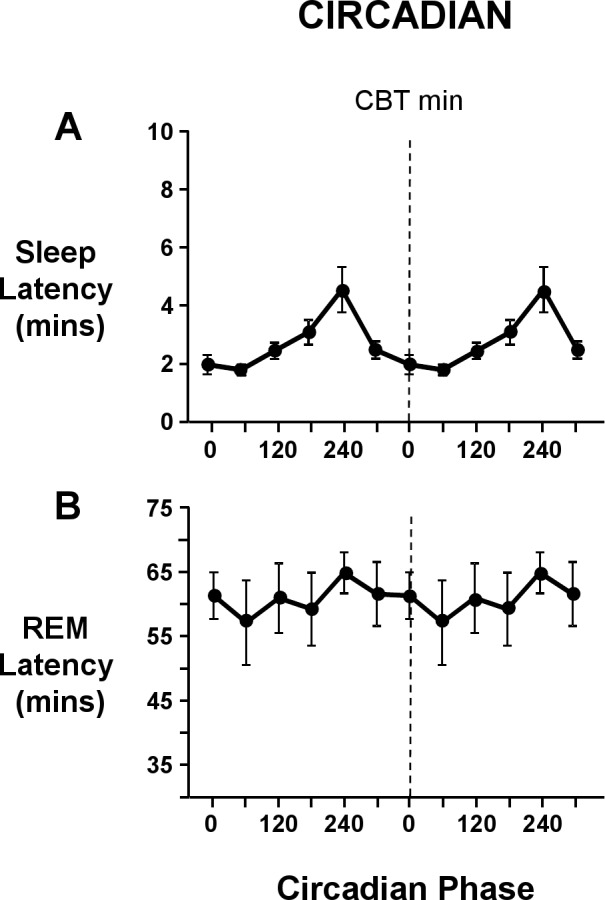
Circadian variation at lights out of sleep latency (A) and REM latency (B). Both circadian waveforms are double plotted, with the dashed line representing the core body temperature minimum. Sleep latency and REM latency are expressed in minutes. Sleep onset latency was defined as the elapsed time from lights out to the first epoch of any stage of sleep, and REM latency was defined as the elapsed time from sleep onset until the first epoch of REM sleep. Error bars shown are standard error of the mean.
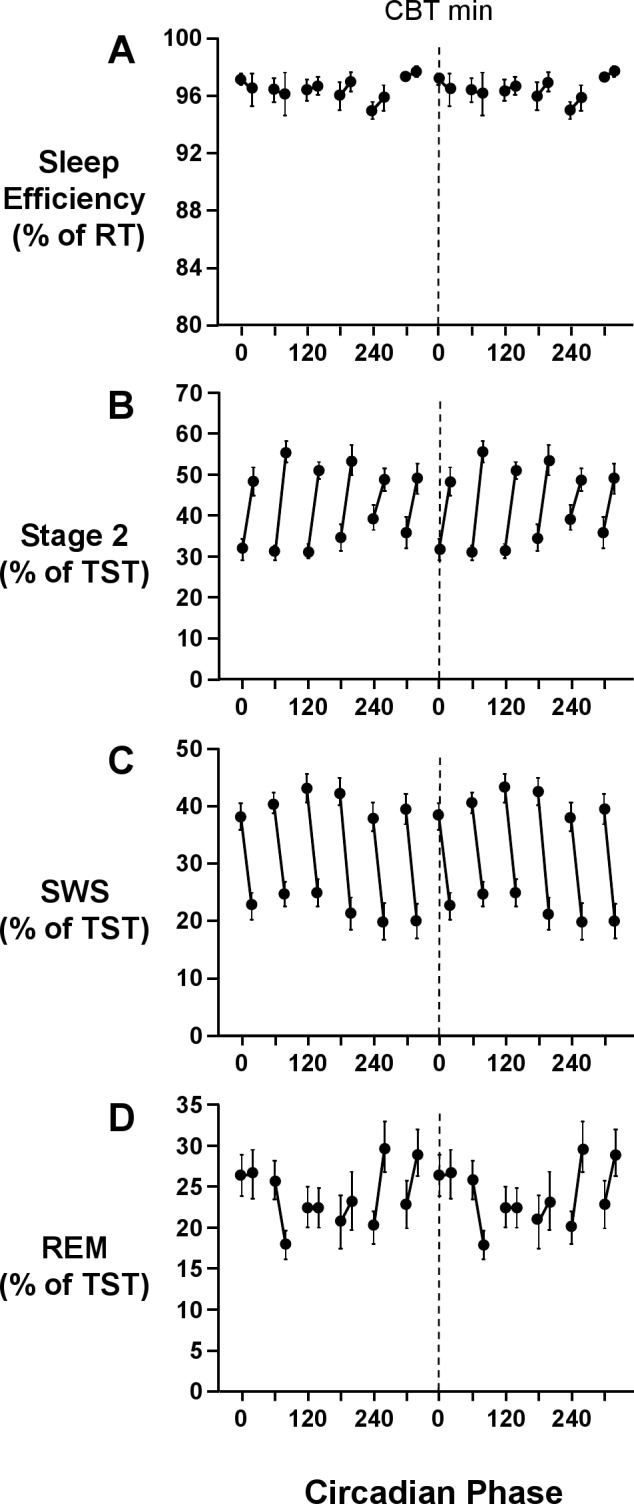
There was no main effect of “elapsed time” (F1,13 = 0.1, P = 0.8) or “circadian phase” (F5,65 = 2.1, P = 0.1), or interaction effect between “elapsed time” and “circadian phase” (F5,143 = 1.1, P = 0.4) on sleep efficiency. Sleep efficiency remained unchanged with elapsed time into the sleep episode and remained high at all circadian phases (Figure 3). Further, there was no change in the circadian modulation of sleep efficiency as sleep progressed (Figure 4). This was confirmed by mixed model analyses which revealed no main effect of “circadian phase” in the first (F5,65 = 1.8, P = 0.2) or second (F5,65 = 0.6, P = 0.7) half of the sleep episode on sleep efficiency. Sleep efficiency did not vary within scheduled sleep episodes, remaining above 95%, regardless of the circadian phase at the start of the sleep episode (Figure 5).
Figure 3.

Circadian (left panel) and sleep-dependent (right panel) variation of sleep efficiency (A), stage 2 sleep (B), SWS (C), REM sleep (D), and core body temperature (E). Sleep efficiency is expressed as a percentage of recording time. Stage 2 sleep, SWS, and REM sleep are expressed as a percentage of total sleep time. Core body temperature is expressed in degrees Celsius. Circadian waveforms are double plotted with a resolution of 60 degrees, except core body temperature, which is plotted with a resolution of 5 degrees. For all circadian waveforms, the dashed line represents the core body temperature minimum. Error bars shown are standard error of the mean.
Figure 4.

Interaction effects between circadian phase and elapsed time into sleep episode on sleep efficiency (A), stage 2 sleep (B), SWS (C), and REM sleep (D). Sleep efficiency is expressed as a percentage of recording time and stage 2 sleep, SWS, and REM sleep are expressed as a percentage of total sleep time. Circadian waveforms are double plotted with the dashed line representing the core body temperature minimum. Error bars shown are standard error of the mean.
Figure 5.
Interaction effects between circadian phase at the start of the scheduled sleep episode and elapsed time into sleep episode on sleep efficiency (A), stage 2 (B), SWS (C), and REM sleep (D). Sleep episodes were assigned to 6 × 60° circadian bins, based on the circadian phase at lights out. Sleep efficiency is expressed as a percentage of recording time; stage 2 sleep, SWS, and REM sleep are expressed as a percentage of total sleep time. Each graph is double plotted, with the dashed line representing the core body temperature minimum. Error bars shown are standard error of the mean.
NREM Sleep
There was a main effect of “elapsed time” (F1,26 = 66.5, P < 0.001) but not of “circadian phase” (F5,65 = 2.0, P = 0.1) on stage 2 sleep. The percentage of stage 2 sleep was significantly lower in the first half of the sleep episode (33.5% ± 6.8%) than the second half of the sleep episode (51.7% ± 4.8%) (Figure 3). There was an interaction effect between “elapsed time” and “circadian phase” (F5,143 = 2.9, P < 0.05) on stage 2 sleep. Stage 2 sleep increased within sleep episodes, with the greatest increase observed when the sleep episode began shortly after the minimum of the core body temperature rhythm (Figure 5). Further, the circadian modulation of stage 2 sleep was more prominent in the first half of the sleep episode than in the second half of the sleep episode (Figure 4). Indeed, there was a main effect of “circadian phase” in the first half of the sleep episode (F5,65 = 5.1, P < 0.01) on stage 2 sleep, but not in the second half of the sleep episode (F5,65 = 0.7, P = 0.6). In the first half of the sleep episode, stage 2 sleep was lowest (27.8% ± 5.6%) shortly after the nadir of the endogenous core body temperature rhythm and highest (39.7% ± 14.3%) around the acrophase of the endogenous core body temperature rhythm (Figure 4).
There was a main effect of “elapsed time” (F1,13 = 87.8, P < 0.001) on SWS. SWS was higher in the first half of the sleep episode (40.5% ± 5.7%) than the second half of the sleep episode (21.9% ± 5.3%) (Figure 3). There was no main effect of “circadian phase” (F5,65 = 2.1, P = 0.1) or interaction effect between “elapsed time” and “circadian phase” (F5,143 = 1.7, P = 0.1) on SWS. The percentage of SWS decreased in all sleep episodes independent of the circadian phase at the start of the sleep episode (Figure 5). Further, the decrease in SWS was a global decrease (Figure 4), with no main effect of “circadian phase” on SWS in either the first (F5,65 = 2.0, P = 0.1) or second half of the sleep episode (F5,65 = 2.0, P = 0.1).
REM Sleep
There was no main effect of “elapsed time” (F1,26 = 0.4, P = 0.6), but there was a main effect of “circadian phase” (F5,65 = 3.0, P < 0.05) on REM sleep. Maximum values (26.6% ± 6.7%) of REM sleep were observed around the nadir of the endogenous core body temperature rhythm, and minimum values (20.8% ± 5.9%) were observed around the acrophase of the endogenous core body temperature rhythm (Figure 3). There was an interaction effect between “elapsed time” and “circadian phase” (F5,156 = 4.2, P < 0.001) on REM sleep. The circadian modulation of REM sleep increased with sleep progression (Figure 4). The time course of REM sleep within sleep episodes was dependent on the circadian phase at the start of the sleep period (Figure 5). When the start of the sleep episode was centered at 240° and 300°, the percentage of REM sleep increased as sleep progressed (Figure 5). When the start of the sleep episode was centered at 60°, or shortly after the minimum of the endogenous core body temperature rhythm, the percentage of REM sleep decreased across the sleep episode (Figure 5). There was no main effect of “circadian phase” in the first half of the sleep episode (F5,65 = 2.2, P = 0.1), but there was a main effect of “circadian phase” in the second half of the sleep episode (F5,65 = 4.1, P < 0.05) on REM sleep. In the second half of the sleep episode, maximum values of REM sleep (33.0% ± 11.3%) were observed around 300°, and minimum values of REM sleep (17.2% ± 7.9%) were observed around 120° (Figure 4).
Assessment of Possible Sleep Debt
Due to the severity of sleep restriction, a possible confounding sleep debt18 may have occurred across the protocol. Due to the nature of the protocol, the first (FD0) and second to last (FD6) forced desynchrony days occurred at the same clock time. Further, the second (FD1) and last (FD7) FD days occurred at the same clock time (Figure 1). The average endogenous circadian cycle length in the current study was 24.2 ± 0.2 h, and so it might be assumed that sleep periods on FD0 and FD6, and FD1 and FD7 fell within the same circadian phase bins. Simple t-tests assessing differences between FD0 and FD6, and FD1 and FD7 were performed for each sleep parameter (stage 2, SWS, REM, and sleep efficiency). No significant differences (P > 0.05) were observed in any of the sleep parameters between the start and end of the protocol.
DISCUSSION
The individual and interactive effects of the circadian and homeostatic processes on sleep have been widely investigated. The current study explored the relative contributions of the homeostatic and circadian processes to sleep under conditions of severe sleep restriction. Previous research has shown a significant circadian modulation of sleep, specifically in relation to sleep consolidation, sleep propensity, and REM sleep.4,7,8,11 In contrast, we found no circadian modulation of sleep consolidation and a weakened circadian modulation of REM sleep. The current results suggest that high homeostatic pressure may reduce the circadian modulation of sleep. Results suggest that the two-process model for sleep regulation may best describe the individual and interactive effects of the homeostatic and circadian processes on sleep structure and consolidation in the absence of sleep restriction.
In concordance with previous studies,4,7,8,11 sleep initiation was highest when the sleep episode was scheduled around the circadian temperature nadir and lowest around the circadian temperature acrophase. Despite this consistency, the longest latency was just 5 minutes, compared to a low of 2 minutes (Figure 2). Further, previous forced desynchrony studies have consistently demonstrated a circadian modulation of sleep consolidation,4,7,8,11 whereas no such circadian drive for sleep consolidation was observed in the current study. The low values of wakefulness observed within scheduled sleep epsiodes in the current study support the hypothesis that in the presence of high homeostatic pressure due to severe sleep restriction, the homeostatic drive for sleep overrides any circadian drive for wakefulness, virtually eradicating wake following sleep onset.
The sleep-dependent changes in stage 2 and SWS in the current study were in concordance with previous reports.4,7,8,11 As the sleep episode progressed, SWS decreased, concurrent with an increase in the percentage of stage 2 sleep. The decrease in SWS with sleep progression occurred independently of the circadian phase at the start of the scheduled sleep episode, while the increase in stage 2 sleep varied slightly with circadian phase (Figure 5). Neither SWS nor stage 2 sleep exhibited an overall circadian modulation. The absence of circadian modulation of SWS is expected.4,7,8 However, previous studies have demonstrated a significant circadian modulation of stage 2 sleep.7 While there was no overall circadian modulation of stage 2 sleep in the current study, a circadian modulation of stage 2 sleep was apparent within the first half of the sleep episode. As sleep progressed the circadian modulation decreased, a finding similar to that observed by Wyatt et al.7 Although there is some inconsistency between the current study and previous reports7 surrounding the circadian modulation of stage 2 sleep, results from the current study confirm the sleep-dependent increase in stage 2 sleep and the strong homeostatic drive for SWS.
Previous studies have shown a sleep-dependent disinhibition of REM sleep, whereby decreased SWS and increased REM sleep are observed as the sleep episode progresses.4,7,8,11 While SWS decreased with sleep progression, REM sleep in the current study remained consistent throughout the sleep episode. Within the first 140 minutes of the sleep episode REM sleep was elevated in relation to previous reports.4,7,8 Further, although a circadian modulation of REM sleep was present in the current study, the amplitude of this circadian variation was smaller than previously reported.4,7,8 Specifically, Dijk and Czeisler4 reported a maximum of approximately 35% shortly after the minimum of the endogenous core body temperature rhythm and a minimum of approximately 17% when sleep fell around the maximum of the endogenous core body temperature rhythm. Although the maximum and minimum values of REM sleep occurred at similar circadian phases in the current study, the maximum values (27%) were lower than previously reported, and the minimum values (21%) were higher than previously reported.4 Although there are some discrepancies between current findings and previous reports,4,7,8 the current study confirms that REM sleep is influenced by the interactions of the sleep homeostat and circadian process. The absence of a sleep-dependent increase and a decreased circadian modulation of REM sleep suggest that there is an increased homeostatic drive for REM sleep. This increased homeostatic regulation of REM sleep may override, at least in part, the strong circadian modulation of REM sleep.
The current study offers new insights into the relative contributions of the circadian and homeostatic processes on sleep structure. However, there are several factors that should be taken into account when considering the results. Primarily, power spectral analysis of the sleep was not conducted. Spectral analysis can provide more accurate representation of homeostatic pressure, usually measured as slow wave activity (SWA).25 The homeostatic influence on SWS and indeed other stages of sleep may be marginally underestimated in the current study. Although an attempt was made to assess for a possible sleep debt, the current study only involved one repetition of the forced desynchrony cycle, compared to multiple repetitions previously reported. Multiple repetitions would have made it possible to assess the differences in sleep parameters over a longer period of time and directly compare between weeks of forced desynchrony, in a similar fashion to Cohen et al.26 Comparison over several weeks may have given a better indication what, if any, effects sleep debt had on sleep parameters. It is also worthwhile noting that the level of sleep restriction (sleep-wake ratio of 1:5, equivalent to a 4-h sleep opportunity within a standard 24-h day) is considered to be “severe.” While this level of sleep restriction may not be commonly observed within the general population, it is not uncommon for sleep restriction studies to involve a severe sleep restriction condition. Previous sleep restriction studies such as those by Banks et al.,27 Belenky et al.,28 Dinges et al.,29 and Van Dongen et al.18 have investigated the effects of sleep restriction with a sleep-wake ratio of, or close to, 1:5.
The current study demonstrates the complexity of the individual and interactive influences of the endogenous circadian pacemaker and the sleep homeostat on sleep regulation. Results show that in the presence of high homeostatic pressure, the homeostatic drive for sleep overrides the circadian drive for wakefulness. Further, in the presence of high homeostatic pressure due to severe sleep restriction the homeostatic regulation of REM sleep is increased, and this increased homeostatic drive for REM sleep may reduce, at least in part, the strong circadian modulation of REM sleep. While the two-process model is accurate at describing the relative contributions of the homeostatic and circadian processes on sleep, this model may be most applicable to non-restricted sleep opportunities.
DISCLOSURE STATEMENT
This was not an industry supported study. Ms. Paech and Dr. Roach have received industry research support unrelated to this study. The other authors have indicated no financial conflicts of interest.
ACKNOWLEDGMENTS
This research was financially supported by the Australian Research Council. The authors thank the two anonymous reviewers for their valuable comments on this manuscript. A special thanks goes to Dr. David Darwent for his contribution to the circadian phase data. The authors also thank the participants, PhD and honours students who gave up a considerable amount of time to collect this data.
REFERENCES
- 1.Borbély AA. A two-process model of sleep regulation. Hum Neurobiol. 1982;1:195–204. [PubMed] [Google Scholar]
- 2.Czeisler CA, Weitzman E, Moore-Ede MC, Zimmerman JC, Knauer RS. Human sleep: its duration and organization depend on its circadian phase. Science. 1980;210:1264–7. doi: 10.1126/science.7434029. [DOI] [PubMed] [Google Scholar]
- 3.Daan S, Beersma DG, Borbely AA. Timing of human sleep: recovery process gated by a circadian pacemaker. Am J Physiol Regul Integr Comp Physiol. 1984;246:R161–83. doi: 10.1152/ajpregu.1984.246.2.R161. [DOI] [PubMed] [Google Scholar]
- 4.Dijk D-J, Czeisler CA. Contribution of the circadian pacemaker and the sleep homeostat to sleep propensity, sleep structure, electroencephalographic slow waves, and sleep spindle activity in humans. J Neurosci. 1995;15:3526–38. doi: 10.1523/JNEUROSCI.15-05-03526.1995. [DOI] [PMC free article] [PubMed] [Google Scholar]
- 5.Webb WB, Agnew HW., Jr. Sleep cycling within twenty-four hour periods. J Exp Psychol. 1967;74:158–60. doi: 10.1037/h0024564. [DOI] [PubMed] [Google Scholar]
- 6.Webb WB, Agnew HW., Jr. Stage 4 sleep: influence of time course variables. Science. 1971;174:1354–6. doi: 10.1126/science.174.4016.1354. [DOI] [PubMed] [Google Scholar]
- 7.Wyatt JK, Ritz-DeCecco A, Czeisler CA, Dijk D-J. Circadian temperature and melatonin rhythms, sleep, and neurobehavioral function in humans living on a 20-h day. Am J Physiol Regul Integr Comp Physiol. 1999;277:R1152–63. doi: 10.1152/ajpregu.1999.277.4.r1152. [DOI] [PubMed] [Google Scholar]
- 8.Paech GM, Ferguson SA, Sargent C, et al. A 28 hour day, sleep and a single beat period; revisiting forced desynchrony studies? Ergonomia IJE&HF. 2010;32:125–32. [Google Scholar]
- 9.Endo S, Kobayashi T, Yamamoto T, Fukuda H, Sasaki M, Ohta T. Persistence of the circadian rhythm of REM sleep: a variety of experimental manipulations of the sleep-wake cycle. Sleep. 1981;4:319–28. doi: 10.1093/sleep/4.3.319. [DOI] [PubMed] [Google Scholar]
- 10.Zulley J. Distribution of REM sleep in entrained 24 hour and free-running sleep--wake cycles. Sleep. 1980;2:377–89. [PubMed] [Google Scholar]
- 11.Dijk D-J, Duffy JF, Riel E, Shanahan TL, Czeisler CA. Ageing and the circadian and homeostatic regulation of human sleep during forced desynchrony of rest, melatonin and temperature rhythms. J Physiol. 1999;516:611–27. doi: 10.1111/j.1469-7793.1999.0611v.x. [DOI] [PMC free article] [PubMed] [Google Scholar]
- 12.Dijk D-J, Czeisler CA. Paradoxical timing of the circadian rhythm of sleep propensity serves to consolidate sleep and wakefulness in humans. Neurosci Lett. 1994;166:63–8. doi: 10.1016/0304-3940(94)90841-9. [DOI] [PubMed] [Google Scholar]
- 13.Strogatz SH, Kronauer RE, Czeisler CA. Circadian regulation dominates homeostatic control of sleep length and prior wake length in humans. Sleep. 1986;9:353–64. doi: 10.1093/sleep/9.2.353. [DOI] [PubMed] [Google Scholar]
- 14.Akerstedt T, Gillberg M. The circadian variation of experimentally displaced sleep. Sleep. 1981;4:159–69. doi: 10.1093/sleep/4.2.159. [DOI] [PubMed] [Google Scholar]
- 15.Barbato G, Wehr TA. Homeostatic regulation of REM sleep in humans during extended sleep. Sleep. 1998;21:267–76. doi: 10.1093/sleep/21.3.267. [DOI] [PubMed] [Google Scholar]
- 16.Endo T, Roth C, Landolt H-P, et al. Selective REM sleep deprivation in humans: effects on sleep and sleep EEG. Am J Physiol Regul Integr Comp Physiol. 1998;274:R1186–94. doi: 10.1152/ajpregu.1998.274.4.R1186. [DOI] [PubMed] [Google Scholar]
- 17.Brunner DP, Dijk D-J, Borbely AA. Repeated partial sleep deprivation progressively changes in EEG during sleep and wakefulness. Sleep. 1993;16:100–13. doi: 10.1093/sleep/16.2.100. [DOI] [PubMed] [Google Scholar]
- 18.Van Dongen HPA, Maislin G, Mullington JMM, Dinges DF. The cumulative cost of additional wakefulness: dose-response effects on neurobehavioral functions and sleep physiology from chronic sleep restriction and total sleep deprivation. Sleep. 2003;26:117–26. doi: 10.1093/sleep/26.2.117. [DOI] [PubMed] [Google Scholar]
- 19.Kleitman N. Sleep and wakefulness. Chicago: The University of Chicago Press; 1939. [Google Scholar]
- 20.Zhou X, Ferguson SA, Matthews RW, et al. Sleep, wake and phase dependent changes in neurobehavioural function under forced desynchrony. Sleep. 2011;34:931–41. doi: 10.5665/SLEEP.1130. [DOI] [PMC free article] [PubMed] [Google Scholar]
- 21.Waterhouse J, Weinert D, Minors D, et al. A comparision of some different methods for purifying core temperature data from humans. Chronobiol Int. 2000;17:539. doi: 10.1081/cbi-100101063. [DOI] [PubMed] [Google Scholar]
- 22.Darwent D, Ferguson SA, Sargent C, et al. Contribtion of core body temperature, prior wake time, and sleep stages to cognitive throughput perfomance during forced desynchrony. Chronobiol Int. 2010;27:898–910. doi: 10.3109/07420528.2010.488621. [DOI] [PubMed] [Google Scholar]
- 23.Czeisler CA, Duffy JF, Shanahan TL, et al. Stability, precision, and near-24-hour period of the human circadian pacemaker. Science. 1999;284:2177–81. doi: 10.1126/science.284.5423.2177. [DOI] [PubMed] [Google Scholar]
- 24.Rechtschaffen A, Kales A. Los Angeles, CA: Brain Information Service/Brain Research Institute; 1968. A manual of standardized terminology, techniques and scoring system for sleep stages of human subjects. [Google Scholar]
- 25.Borbáely AA, Baumann F, Brandeis D, Strauch I, Lehmann D. Sleep deprivation: Effect on sleep stages and EEG power density in man. Electroencephalogr Clin Neurophysiol. 1981;51:483–93. doi: 10.1016/0013-4694(81)90225-x. [DOI] [PubMed] [Google Scholar]
- 26.Cohen DA, Wang W, Wyatt JK, et al. Uncovering residual effects of chronic sleep loss on human performance. Sci Transl Med. 2010;2:14ra3. doi: 10.1126/scitranslmed.3000458. [DOI] [PMC free article] [PubMed] [Google Scholar]
- 27.Banks S, Van Dongen HP, Maislin G, Dinges DF. Neurobehavioral dynamics following chronic sleep restriction: dose-response effects of one night for recovery. Sleep. 2010;33:1013–26. doi: 10.1093/sleep/33.8.1013. [DOI] [PMC free article] [PubMed] [Google Scholar]
- 28.Belenky G, Wesensten NJ, Thorne DR, et al. Patterns of performance degradation and restoration during sleep restriction and subsequent recovery: a sleep dose-response study. J Sleep Res. 2003;12:1–12. doi: 10.1046/j.1365-2869.2003.00337.x. [DOI] [PubMed] [Google Scholar]
- 29.Dinges D, Pack F, Williams K, et al. Cumulative sleepiness, mood disturbance, and psychomotor vigilance performance decrements during a week of sleep restricted to 4-5 hours per night. Sleep. 1997;20:267–77. [PubMed] [Google Scholar]