

Abstract
Study Objective:
Sleep and mood disorders have long been understood to have strong genetic components, and there is considerable comorbidity of sleep abnormalities and mood disorders, suggesting the involvement of common genetic pathways. Here, we examine a candidate gene implicated in the regulation of both sleep and affective behavior using a knockout mouse model.
Design:
Previously, we identified a quantitative trait locus (QTL) for REM sleep amount, REM sleep bout number, and wake amount in a genetically segregating population of mice. Here, we show that traits mapping to this QTL correlated with an expression QTL for neurotensin receptor 1 (Ntsr1), a receptor for neurotensin, a ligand known to be involved in several psychiatric disorders. We examined sleep as well as behaviors indicative of anxiety and depression in the NTSR1 knockout mouse.
Measurements and Results:
NTSR1 knockouts had a lower percentage of sleep time spent in REM sleep in the dark phase and a larger diurnal variation in REM sleep duration than wild types under baseline conditions. Following sleep deprivation, NTSR1 knockouts exhibited more wake and less NREM rebound sleep. NTSR1 knockouts also showed increased anxious and despair behaviors.
Conclusions:
Here we illustrate a link between expression of the Ntsr1 gene and sleep traits previously associated with a particular QTL. We also demonstrate a relationship between Ntsr1 and anxiety and despair behaviors. Given the considerable evidence that anxiety and depression are closely linked with abnormalities in sleep, the data presented here provide further evidence that neurotensin and Ntsr1 may be a component of a pathway involved in both sleep and mood disorders.
Citation:
Fitzpatrick K; Winrow CJ; Gotter AL; Millstein J; Arbuzova J; Brunner J; Kasarskis A; Vitaterna MH; Renger JJ; Turek FW. Altered sleep and affect in the neurotensin receptor 1 knockout mouse. SLEEP 2012;35(7):949-956.
Keywords: Sleep, neurotensin, NTSR1, anxiety, depression
INTRODUCTION
Sleep, a behavioral trait controlled by an intrinsic circadian clock and a homeostatic process, has long been understood to be under genetic control, although the specific genes involved have largely remained unidentified.1,2 It is also clear that mood disorders have a strong genetic component, which is likely to be the result of a group of genetic and even epigenetic factors that create a complex gene-environment interaction leading to a disorder.3,4 It has been shown that there is overlap in genes involved in circadian rhythms and those implicated in psychiatric disorders, suggesting that the control of the two phenotypes are related.5 Also, sleep disturbances are listed as criteria in the diagnosis of specific mood and anxiety disorders in the Diagnostic and Statistical Manual of Mental Disorders, including major depressive disorder, bipolar disorder, dysthymic disorder, cyclothymic disorder, and generalized anxiety disorder.6 Utilizing the power of genetic approaches to identify novel targets for not only sleep processes, but also for any other biological process with which sleep interacts (e.g., mood and anxiety disorders), is an advantageous and potentially prolific technique for better understanding fundamental relationships as well as developing new treatment options.2,7,8
In a previous study we utilized a large genetically segregating population of mice to identify multiple quantitative trait loci (QTL) for different sleep-wake phenotypes.9 Among those identified was a QTL for rapid eye movement (REM) sleep amount, REM sleep bout number, wake amount, and non-REM (NREM) sleep amount that mapped to chromosome 17 at 29 centimorgans (hereby referred to as 17@29cM).9 Microarrays assaying 28,053 transcripts were used to analyze gene expression in 3 brain regions in a subset of the population.10 Here, we utilize a combination of these datasets and new analyses to identify a candidate gene, Neurotensin Receptor 1 (Ntsr1), whose expression levels correlated with the traits mapping to the chromosome 17@29cM QTL. Neurotensin, as well as Ntsr1, has been implicated in several psychiatric disorders, and Ntsr1 is expressed widely in the brain.11 To further test the relationship of Ntsr1, sleep, and psychiatric disorders, we performed a battery of behavioral tests and sleep quantification on a NTSR1 knockout mouse.
Neurotensin has been previously shown to have acute effects on sleep-wake regulation. Neurotensin has also been shown to interact closely with the dopaminergic system,12 and there is pharmacological evidence that neurotensin is associated with anxiety13 and depression,14 as well as other psychiatric and neurological diseases.15 Central nervous system administration of neurotensin has been associated with acute changes in EEG states and sleep amounts in rats,16,17 including a reduction in EEG power in the lower frequency ranges and an increase in higher frequency ranges. One study also showed a dose-dependent increase in REM sleep in response to neurotensin administration in the basal forebrain and observed narcoleptic-like behavior in that rats went from wake to REM sleep with no intermediate NREM sleep evident.17 While short-term effects of central neurotensin administration have been characterized, the constant state effects of neurotensin, or lack thereof, have not yet been studied, especially in terms of overall baseline sleep patterns over 24 hours. Because of the associations of sleep disturbances with anxiety18 and depression19,20 in humans, and the evidence that neurotensin is involved with anxiety and depression,13,14 we characterized these NTSR1 knockout animals in classic anxiety and despair tests. This was of particular interest because of the specific sleep phenotypes associated with the Ntsr1-related QTL: REM sleep traits and wake amount, both of which are associated with depression and anxiety through polysomnography data in humans including reduced REM sleep latency, increased REM sleep percentage of total sleep, insomnia, decreased total sleep time, and increased wake time during sleep, among other traits.20 Therefore, in the present study we look at how the disruption of a specific gene implicated in the control of sleep, neurotensin receptor 1, affects both sleep and affect in the mouse.
METHODS
Animals
All experimental mice were housed and handled according to the Federal Animal Welfare guidelines and all studies were approved in advance by the Institutional Animal Care and Use Committee at Northwestern University. All animals were maintained continuously on a 12-h light: 12-h dark cycle at a room temperature of 23 ± 2°C. Food and water were available ad libitum.
The experiments were conducted on 10 male C57BL/6N wild-type mice and 10 male congenic mice containing a targeted mutation for Ntsr1 (hereafter referred to as NTSR1 knockout mice) of a line originating from Deltagen, Inc. (San Mateo, CA; line ID: T64121). The mice were shipped to Northwestern University from the colony (bred and maintained at Taconic, Germantown, NY) at 6 weeks of age. The animals were given 12 days to acclimate prior to any experimental testing.
Quantitative Trait Loci (QTL) and Expression Analysis in Prior Studies
Previously, we conducted a study utilizing 269 adult male mice from a [C57BL/6J × (BALB/cByJ × C57BL/6J) F1] N2 segregating cross and identified 52 QTL.9 In a subset of the population (n = 101), 28,053 transcripts were analyzed via microarray for gene expression levels in the frontal cortex, hypothalamus, and thalamus/midbrain.10
Neighbor Analysis
Utilizing the sleep-wake phenotype data, the QTL data, and the expression data from our previous studies,9,10 a subsequent exploratory analysis was performed to identify genes that are candidate mediators of sleep QTL. Permissive filtering criteria were used to maximize statistical power. The filtering criteria were: (a) sleep QTL logarithm of odds (LOD) score > 2, (b) expression QTL LOD score > 2, (c) distance between expression QTL peak and sleep QTL peak < 10 cM, (iv) nominal P-value < 0.001 for a two degrees of freedom test measuring the main effect of expression and its interaction with the light/dark periods on the sleep trait using a repeated measures model. While several genes were identified using this analysis, we specifically chose to pursue Ntsr1 because of the association with a QTL for REM sleep, the association of neurotensin with psychiatric disorders, and the availability of a knockout mouse for the high-affinity neurotensin receptor NTSR1.
Behavioral Testing
Elevated plus maze and open field activity were assessed at 8 weeks of age, the tail suspension test was administered at 8 weeks of age and repeated at 9 weeks of age, and the forced swim test was administered at 10 weeks of age. All behavioral testing was performed in the light (inactive) period. All animals went through all of the behavioral tests as well as the sleep recording and subsequent sleep deprivation and recovery. All animals successfully completed each of the behavioral tests without meeting any exclusion criteria.
Elevated plus maze
Mice were placed in the center of an elevated plus maze (each arm 57.8 cm long and 5.7 cm wide with 2 opposite closed arms with 14-cm high walls) elevated 30.5 cm in a dimly lit room and allowed to explore for 5 minutes. The animals were monitored from above by a video camera connected to a computer running video tracking software (LimeLight, Actimetrics, Evanston, IL) to determine the total distance traveled, the percentage of the distance traveled in the open arms, and the percentage of the distance traveled in the closed arms. LimeLight tracking software tracks a midpoint over the animal's shoulders in determining the animal's path traversed and boundary crossings within the maze. The mazes were wiped down with ethanol and allowed to dry between mice. Data were analyzed with Student t test.
Open field activity
Mice were placed in the center of a novel open field environment (52.7 × 52.7 cm) in a dimly lit room and allowed to explore for 5 minutes. The animals were monitored from above by a video camera connected to a computer running video tracking software (LimeLight, Actimetrics, Evanston, IL) to determine the total distance traveled, the percentage of time spent in the center and percentage of time spent in the corners. The area of the arena is subdivided into a grid of 5 sections by 5 sections with each section of equal size, and the center is defined as the center 31.62 cm × 31.62 cm area consisting of the center 9 sections in the grid, and the corners being the 10.54 cm × 10.54 cm sections abutting the corners. LimeLight tracking software tracks a midpoint over the animal's shoulders in determining the animal's path traversed and boundary crossings within the open field. The open field arenas were wiped down with ethanol and allowed to dry between mice. Data were analyzed with Student t test.
Tail suspension test
Mice were placed in a closed and lighted chamber suspended by the end of their tail using a custom modified clip. The mice remained in the chamber for 6 minutes. If a mouse successfully climbed its tail, they were immediately discouraged by placing the animal back into the hanging position. These observations were noted, and animals that repeated the behavior more than twice were removed from data analysis. Each animal was tested twice under the same protocol, 7 days apart. The animals were monitored by a video camera mounted behind the chamber connected to a computer, and the digital video files were stored for later analysis. The entire 6-min video was scored at a 1-sec resolution. Immobility was defined as no voluntary body or limb movement, and video files were analyzed to determine total number of seconds of immobility, latency to the first immobility bout (defined as ≥ 1 sec of immobility), and number of bouts of immobility. Data were analyzed with Student t test.
Forced swim (porsolt) test
Mice were placed in a beaker (25 cm tall, 15 cm diameter) of water (25-26°C) filled to a depth of 16 cm. The mice remained in the water for 6 min and were then removed and allowed to dry in a clean cage placed halfway on a heating pad, allowing the mouse to freely regulate its temperature preference. Cage mates were tested in the same beaker after any fecal boli were removed, and the water was changed between the testing of each cage. The mice were monitored from the side by a video camera, and digital video files were stored for later analysis. The entire 6-min video was scored at a 1-sec resolution, and the animal was determined to be either mobile or immobile at each second in the video. Immobility was defined as either no voluntary body or limb movement or passive paddling with ≤ 2 paws moving at a time, and video files were analyzed to determine total number of seconds of immobility. Data were analyzed with Student t test.
Sleep-Wake Recording
At 11 weeks of age, the mice were fitted with a head implant for the recording of the electroencephalogram and electromyogram (EEG and EMG, respectively). A minimum 10-day post-surgery recovery period was allowed prior to the onset of sleep recording. Mice were acclimated to individual housing conditions in cylindrical (25.5 cm diameter) sleep recording cages with free access to food and water for 5 days during this time. EEG and EMG data were collected for 48 continuous hours starting at light onset following the acclimation period, as previously reported.22 Briefly, the EEG signals were amplified 10,000 times with high- and low-pass filters set at 1 and 30 Hz, respectively. EMG signals were amplified 5,000 times with high- and low-pass filters set at 30 and 100 Hz, respectively. Both signals were digitized at 100 Hz/channel by an analog-to-digital converter (Data Translation, Marlboro, MA). The first 24 h were used for baseline sleep-wake measures, and sleep deprivation via the gentle handling technique22 was performed at ZT2-8 during the second 24 h, with the remaining 16 h constituting the recovery period. EEG and EMG recordings were divided into 10-sec epochs and scored via visual inspection as wake, NREM sleep, or REM sleep using a custom software package (Sleep Report, Actimetrics, Evanston, IL). For quantitative analysis of the EEG signal, each 10-sec epoch was divided into five 2-sec intervals and subjected to fast Fourier transformation; the normalized power density relative to the overall frequency range was calculated in the delta (1-4 Hz), theta I (4-8 Hz), theta II (8-11 Hz), sigma (11-15 Hz), and beta (15-30 Hz) frequency bands for NREM sleep. For a detailed description of sleep scoring and EEG signal analysis, see Winrow et al.9
We restricted the sleep data analyzed in the present study to those traits indicated by the QTL from the N2 study, which were traits falling into the REM sleep and state amount categories through factor analysis as outlined previously.9 The specific traits analyzed were REM sleep minutes, percentage of REM sleep over total sleep, REM sleep bout number, inter-REM sleep interval, wake minutes, and NREM sleep minutes. These traits were quantified and analyzed for the light phase, dark phase, 24 hours, and the diurnal variation (light phase value – dark phase value = diurnal variation) phases. Additionally, due to the unusual phenotype observed in response to sleep deprivation, we also analyzed the EEG spectral data for NREM sleep at baseline and as a response to the sleep deprivation. All data were analyzed with Student t test. Nine animals of each genotype completed the baseline sleep portion of the experiment, and 9 wild-type animals and 8 NTSR1 knockouts completed the sleep deprivation and recovery portion of the experiment. Exclusions were a result of health reasons or hardware malfunctions.
RESULTS
NTSR1
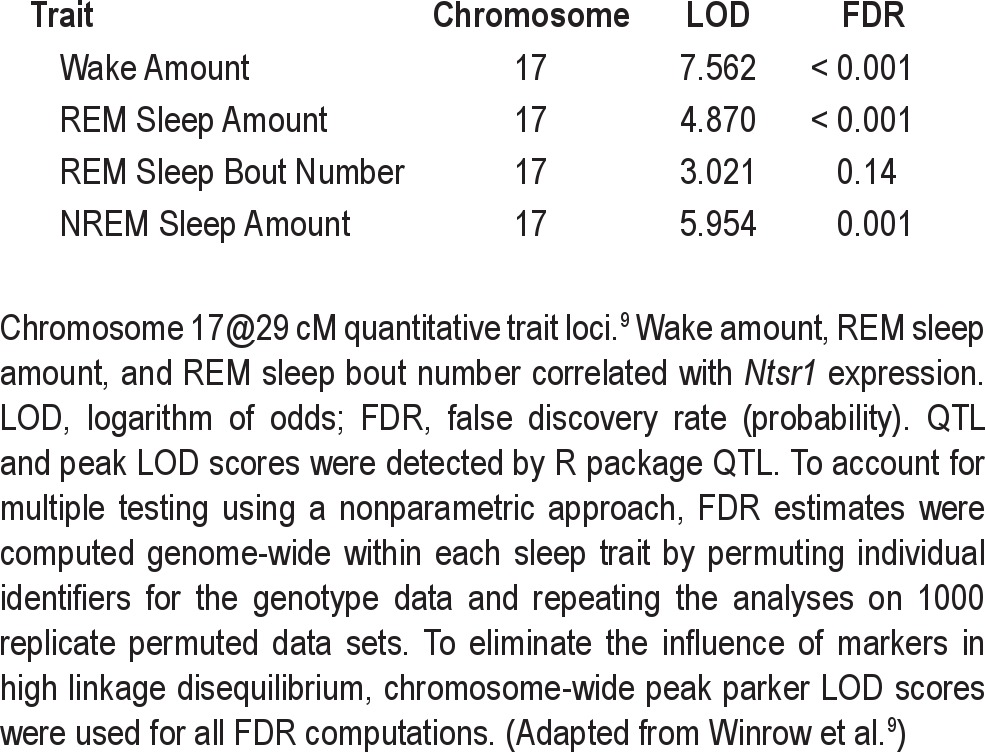
The gene expression for the neurotensin receptor 1 gene correlated with some of the sleep traits mapping to the chromosome 17@29cM QTL in the previous study.9 The QTL on chromosome 17@29cM was associated with wake amount, REM sleep amount, REM sleep bout number, and NREM sleep amount with LOD scores of 7.562, 4.870, 3.021, 5.954, respectively (Table 1).9 The LOD for Ntsr1 expression on chromosome 2 was 3.385. Furthermore, expression levels of Ntsr1 correlated specifically with the wake amount, REM sleep amount, and REM sleep bout number traits mapping to the chromosome 17@29cM QTL. The NREM sleep amount trait did not meet the established thresholds for correlation.
Table 1.
Quantitative trait loci logarithm of odds scores
Sleep, Sleep Deprivation, and Recovery
In unperturbed baseline conditions, the NTSR1 knockouts had a lower percentage of total sleep spent in REM sleep in the dark phase than wild-type controls (t[16] = 2.69, P < 0.05, Figure 1A). There were no significant differences in total sleep between the 2 genotypes; thus the NTSR1 knockouts had a higher percentage of total sleep spent in NREM sleep during the dark phase (t[16] = −2.69, P < 0.05, data not shown). REM sleep bout number, which produced the lowest LOD score in the associated QTL, did not reach statistical significance (t[16] = −1.99, P = 0.0639 for the diurnal difference) between the genotypes.
Figure 1.
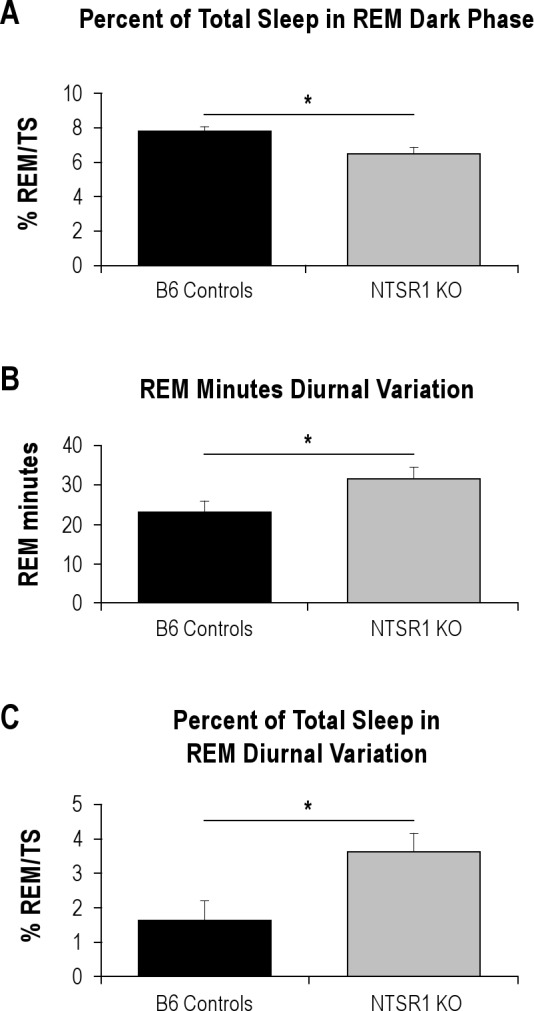
Significant differences in baseline sleep amounts between wild type B6 controls and NTSR1 knockouts. %REM/TS, percentage of REM sleep over total sleep. Results are expressed as mean ± SEM; P-values were obtained using the Student t test. (A) Percentage of total sleep spent in REM sleep in the dark (active) phase, *P < 0.05. (B) Diurnal variation of REM sleep minutes (light – dark), *P < 0.05. (C) Diurnal variation of the percentage of total sleep spent in REM sleep (light – dark), *P < 0.05.
Considering that the chromosome 17@29cM QTL was time-of-day dependent, we evaluated the diurnal differences in sleep in these animals. The NTSR1 knockout animals had a significantly higher variation in REM sleep minutes over the 24-h day than the wild-type controls (t[16] = −2.15, P < 0.05, Figure 1B). This was a result of the NTSR1 knockouts having more REM sleep in the light and less REM sleep in the dark, neither of which was significant when taken alone, but was significant for the magnitude of diurnal variation (the difference between the light phase and dark phase values). This is also true for the percentage of total sleep spent in REM sleep, in that the NTSR1 knockouts have a higher percentage than the wild type controls (t[16] = −2.58, P < 0.05, Figure 1C). In response to the abnormal recovery phenotype observed after sleep deprivation in the NTSR1 knockouts, we also analyzed the EEG spectral data for NREM sleep but did not find any significant differences for any of the frequency bands (data not shown).
To examine the homeostatic response to sleep deprivation, both genotypes underwent a 6-h sleep deprivation period (ZT2-8) followed immediately by a 16-h unperturbed recovery period consisting of the remaining 4 h of the light period and the subsequent 12-h dark period. While there were no significant differences between the genotypes in wake or NREM sleep amounts under baseline conditions, the NTSR1 knockouts exhibited differences in recovery sleep of wake and NREM sleep amounts as compared to the wild-type controls. Relative to baseline amounts, the NTSR1 knockouts were awake significantly more than the wild-type controls in both the remainder of the light phase and the subsequent dark phase (light phase: t[15] = −2.57, P < 0.05, dark phase: t[15] = −2.28, P < 0.05, Figure 2A) following 6 h of sleep deprivation. Inversely, the knockouts experienced significantly less rebound NREM sleep in the recovery period (light phase: t[15] = 2.63, P < 0.05, dark phase: t[15] = 2.60, P < 0.05, Figure 2B). There were no significant differences in REM sleep amount during the recovery period. Because of the unusual recovery phenotype displayed by the NTSR1 knockouts following sleep deprivation, the EEG spectral data for NREM sleep was also analyzed, but no significant differences were found in any of the frequency bands during the recovery period as compared to wild-type controls (data not shown).
Figure 2.
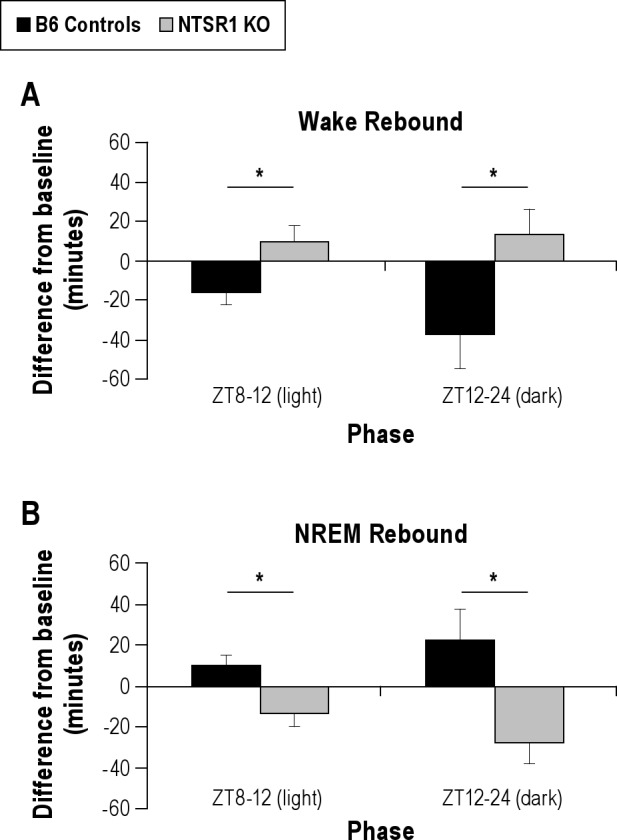
Significant differences in rebound sleep amounts as compared to baseline. Results are expressed as mean ± SEM; P-values were obtained using the Student t test. (A) Wake rebound after 6-h sleep deprivation period (ZT2-8), separated out into light phase (inactive, left) and dark phase (active, right), *P < 0.05. (B) NREM sleep rebound after 6-h sleep deprivation period (ZT2-8), separated out into light phase (inactive, left) and dark phase (active, right), *P < 0.05.
Anxiety and Despair Phenotypes
The NTSR1 knockouts displayed a more anxious phenotype in the open field activity test, with less distance traveled (t[18] = −3.55, P < 0.01), less time spent in the center (t[18] = −2.60, P < 0.05), and more time spent in the corners (t[18] = 3.38, P < 0.01) than the wild-type controls (Figure 3). There were no significant differences in the elevated plus maze.
Figure 3.
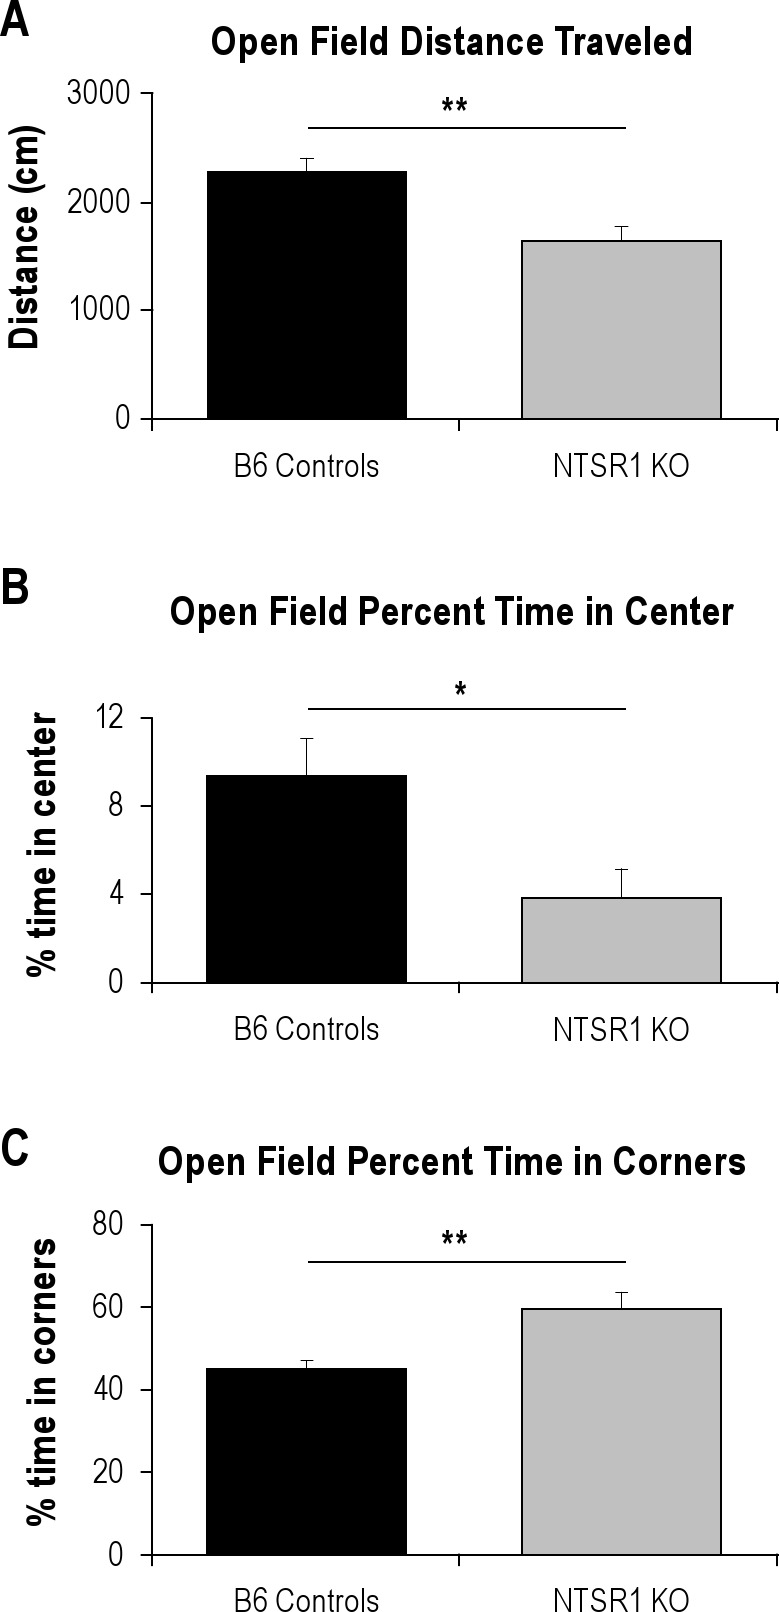
Significant differences in open field activity. Results are expressed as mean ± SEM; P-values were obtained using the Student t test. (A) Total distance traveled (cm) in the open field, **P < 0.01. (B) Percentage of time spent in the center portion of the open field, *P < 0.05. (C) Percentage of time spent in the corners of the open field, **P < 0.01.
The NTSR1 knockouts also displayed a despair phenotype in the tail suspension test with a higher number of bouts of immobility in the first minute of the second day of the tail suspension test (t[18] = −2.99, P < 0.01) than the wild-type controls (Figure 4). This phenotype was independently confirmed in the same knockout line with 8 animals per group in tests performed at another laboratory location where the NTSR1 knockouts displayed a higher amount of immobility in the tail suspension test (2-way repeated measures ANOVA F1,36 = 6.180, P < 0.05; please refer to Supplementary Materials for data and methods). There was also a trend in the same direction with immobility in the first minute of the forced swim test, but this did not reach statistical significance (t[18] = −1.66, P = 0.11, data not shown).
Figure 4.
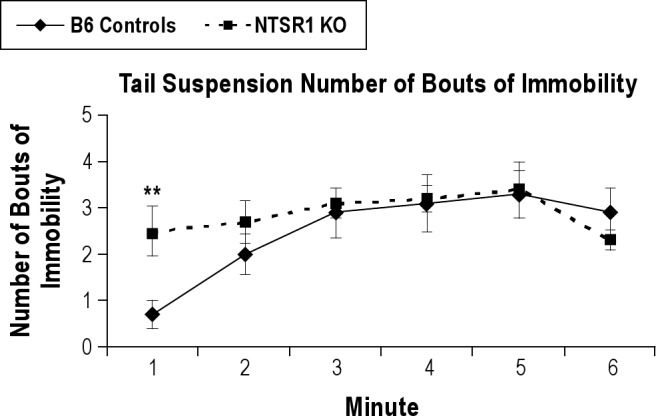
Time course of number of bouts of immobility on the second day in the tail suspension test. Results are expressed as mean ± SEM; P-values were obtained using the Student t test; **P < 0.01.
DISCUSSION
Neurotensin/NTSR1 and Sleep
While there are four known receptors that bind neurotensin, the peptide exerts its effects primarily through two G-protein coupled receptors, NTSR1, the high-affinity receptor, and NTSR2, the low-affinity receptor, and the direction of effect differs depending on the location of the receptor.12 The chromosome 17@29cM QTL traits found to be associated with the expression of Ntsr1 were wake amount, REM sleep amount, and REM sleep bout number in the mixed category (Table 1). The term “mixed effect” indicates that a genotype at a particular locus has the opposite or a statistically different effect on the same trait during the light versus the dark phase, i.e., a statistically significant diurnal variation. Factor analysis was performed on the 20 sleep-wake traits reported to identify unbiased groupings of these traits, and the traits in the QTL grouped into REM sleep and state amount dimensions.9 Because of the close relationships among the traits within the same dimension, all of the traits in the two dimensions (REM sleep and state amount) were analyzed in the present study. While we did not find specific differences in REM sleep bout number in the NTSR1 knockout mice, we did find differences in the percentage of total sleep spent in REM sleep, which fell into the same trait dimension, in both the dark period and the diurnal variation. We also found differences in wake amount in the NTSR1 knockouts after they were exposed to a six-hour period of sleep deprivation.
Disrupting the function of the neurotensin receptor 1 alters both baseline sleep and the recovery after sleep deprivation, in addition to influencing anxiety and depressive-like behaviors in the mouse. Baseline sleep is altered, specifically in terms of REM sleep traits, such that the NTSR1 knockout animals display altered REM sleep regulation and REM sleep distribution over the 24-hour period. This is demonstrated by the lower percentage of total sleep spent in REM sleep in the dark phase, as well as the larger difference in the diurnal variation of REM sleep and the percentage of total sleep spent in REM sleep in the knockouts than in the wild types. This result supports the initial chromosome 17@29cM QTL finding for a mixed effect in REM sleep amount. The knockouts also experience a paradoxical recovery phenotype in response to sleep deprivation, in that they display more wake time and less NREM sleep following six hours of sleep deprivation than under baseline conditions, opposite that of the standard recovery phenotype displayed by the wild type controls. This difference persisted in both the remainder of the light period following sleep deprivation, and in the full dark period immediately following. This result in the NTSR1 knockouts supports the initial chromosome 17@29cM QTL finding for a mixed effect in wake amount.
Neurotensin has been previously linked with sleep, but only in terms of acute sleep responses resulting from direct central nervous system administration. It has been shown that neurotensin microinjections directly into the brain produce acute short-term changes in sleep-wake behaviors and EEG parameters in rats. In one study, it was shown that a low dose (10.0 μg) of neurotensin administered intracerebroventricularly produced a decrease of the EEG power in the lower frequency ranges (2-4 Hz in the anterior amygdaloid nucleus, 2-6 Hz in the nucleus accumbens) and in the higher frequency range (16-32 Hz) only in the nucleus accumbens, while a high dose (30.0 μg) produced an overall decrease of the EEG power in both lower and higher frequency ranges, as well as placing the animal into a behaviorally inactive state.16 In another study, microinjections of neurotensin into the basal forebrain of rats produced a dose-dependent decrease in the lower frequency ranges (1-4 Hz) and increases in the 4-9 Hz and 30-60 Hz ranges.17 This study also demonstrated that the animals displayed a dose-dependent decrease in NREM sleep following neurotensin administration during the time period in which the rats would normally be experiencing the highest concentration of NREM sleep; interestingly, the injections produced a narcoleptic-like phenotype such that the rats would transition from wake to REM sleep without any intermediate NREM sleep.
Here we demonstrate for the first time that the functional disruption of the high-affinity receptor for neurotensin leads to changes in the baseline sleep of mice, particularly in REM sleep. These animals displayed a decrease in REM sleep in the dark period proportionate to the total sleep amount and an altered distribution of REM sleep over the 24-hour period. Based on these results, it is clear that neurotensin plays a role in the regulation of sleep, particularly the regulation and distribution of REM sleep over the 24-hour day.
Neurotensin, Anxiety, and Depression
Neurotensin interacts significantly with the dopaminergic system, and it follows that the peptide and its receptors are involved in several psychiatric disorders.11,12,15 Its role in anxiety and depression, while not as extensively studied as its role in schizophrenia and drug abuse, has been implicated in a few studies. Neurotensin and NTSR1 are present in several brain regions that are implicated in anxiety and depression, such as the prefrontal cortex, amygdala, and hippocampus.23–27 In a human study, plasma levels of neurotensin were significantly decreased in patients with depression and anxiety, which returned to normal levels following recovery.28
Specifically, one study found that a NTSR1 agonist, PD149163, modulated neural circuitry involved in fear and anxiety by acting as an anxiolytic and blocking fear-potentiated startle in rats.13 Thus, we hypothesized that our study in animals lacking a functional NTSR1 receptor would elicit an anxious phenotype, which we demonstrated using the open field activity test. The lack of significant differences in the elevated plus maze may be attributable to differences in the testing apparatus and environment, potentially elucidating a subtle difference in the presentation of the anxious phenotype in the knockout animals.
Another study found that administration of neurotensin to the ventral tegmental area produced an antidepressant-like effect in rats in the forced swim test.14 In the present study, we demonstrated that animals lacking the high-affinity receptor for neurotensin demonstrated a higher level of depressive-like behavior in the tail suspension test by exhibiting a higher number of bouts of immobility in the first minute on the second day of testing as compared to wild types, which was also independently confirmed in the same knockout strain at another laboratory location with the animals displaying a higher amount of immobility overall. Body weight, which could potentially contribute to differences in the tail suspension test, was not found to be significantly different in the NTSR1 knockouts as compared to wild types when measured following the tail suspension test at 11 weeks of age (data not shown), despite previous reports on increased body weight in NTSR1 knockouts.29,30 Additionally, general phenotypic analysis of the NTSR1 knockouts revealed no effects of the mutation on general muscle strength as indicated by the string and grip tests (see Supplementary Materials), suggesting the tail suspension results are indicative of a depressive-like phenotype in the NTSR1 knockout animals. We did not find any significant differences between knockouts and wild types in the forced swim test, although there was a trend in the same direction as the tail suspension test.
Sleep, Depression, and Anxiety
Sleep has long been associated with anxiety and depression, and sleep disturbances are even criteria used to diagnose each of the major mood disorders in the Diagnostic and Statistical Manual of Mental Disorders.6 Insomnia is the most prevalent of the reported sleep disturbances in humans suffering from mood disorders, but further research into the association of sleep and mood disorders has revealed that other factors that are not acutely observable by the patients themselves are also prevalent, particularly REM sleep changes.20,31 Generalized anxiety disorder and major depressive disorder are also highly comorbid in humans.32
Insomnia and a reduction in NREM sleep are found in patients with depression, but signs of REM sleep dysregulation, including shortened REM latency, larger amount of REM sleep in the first part of the night, and increased percentage of REM sleep are believed to be the most consistent and specific sleep abnormalities associated with depression.20 The shortened latency to enter REM sleep was first reported several years ago33,34 and has since been extensively studied and verified in a meta-analysis, along with an increase in REM minutes and the percent of sleep spent in REM in depressed patients.35 Here we report that mice experiencing dysregulation of REM sleep in the form of a reduction of the percentage of sleep spent in REM sleep and an altered distribution of REM sleep also show a depressive-like phenotype in the tail suspension test with an increased number of bouts of immobility in the first minute. While the specific changes in REM sleep reported here do not exactly mimic the REM sleep changes observed in humans, the association of dysregulated REM sleep and depressive-like behavior remains.
In addition to insomnia being associated with depression, insomnia is the main complaint in patients suffering from all types of anxiety.19,35,36 There are several different classifications of anxiety, including panic disorder, generalized anxiety disorder, obsessive-compulsive disorder, and posttraumatic stress disorder; the specifics of the timing and origin of the insomnia change somewhat depending upon the subtype of anxiety.18 There do not appear to be REM sleep changes associated with anxiety disorders, but a reduction in total sleep time and sleep efficiency, along with an increase in sleep latency are often found in polysomnography studies on patients with anxiety disorders.35 Although there were no differences in baseline wake amount, here we have shown that the NTSR1 knockout mouse demonstrated an anxious phenotype in the open field activity test and an increased amount of wake following sleep deprivation.
CONCLUSION
A better understanding of the genetics that underlie sleep and mood disorders will help us address fundamental relationships as well as develop novel drug targets and therapies to treat both disorders. We demonstrated here that there is a strong link between the expression of the Ntsr1 gene and the sleep traits associated with these QTL, and the studies on the NTSR1 knockout animal add further support to the hypothesis that Ntsr1 is linked not only to anxiety and depression traits as previously reported, but also to sleep-wake traits. There is considerable evidence that anxiety and depression are closely linked with abnormalities in sleep, including both REM sleep traits and increased wake time. The data presented here are further evidence that sleep and affective disorders share a common pathway, one that potentially includes neurotensin receptor 1
DISCLOSURE STATEMENT
This study was supported by the Defense Advanced Research Projects Agency (grant number DAAD 19-02-1-0038), as well as by Merck & Co., Incorporated (USA). Drs. Winrow, Gotter, Bruner, and Renger are employees of Merck & Co., Inc. (USA) and potentially own stock and/or stock options in the company. Dr. Kasarskis was an employee of Pacific Biosciences while this work was done and owns stock in the company. Dr. Turek acknowledges receiving research support from Merck & Co., Inc.; has received research support from American Waterways Operators, has made presentations for the Servier Pharmaceutical Company and received consulting fees from Ingram Barge Company. The other authors have indicated no financial conflicts of interest.
ACKNOWLEDGMENTS
The authors thank Susan Losee-Olson, Chris Olker, and Rebecca Rosales for their technical assistance. This work was supported by the Defense Advanced Research Projects Agency (grant number DAAD 19-02-1-0038). The views, opinions, and/or findings contained in this article are those of the author and should not be interpreted as representing the official views or policies, either expressed or implied, of the Defense Advanced Research Projects Agency or the Department of Defense. This work was also supported by Merck & Co., Incorporated (USA). Work for this study was performed at the following institutions: Northwestern University – animal experiments, data and statistical analysis; Merck Research Laboratories – animal experiments, data and statistical analysis; Sage Bionetworks, Mount Sinai – data and statistical analysis.
SUPPLEMENTAL MATERIAL
SUPPLEMENTAL DATA
Figure S1.
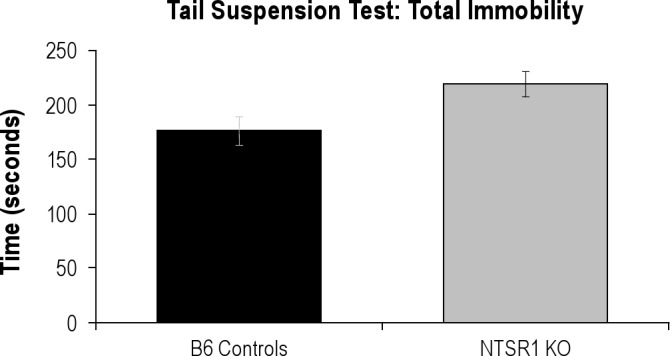
Total Immobility in seconds over the 6-minute tail suspension test. Two-way repeated measures ANOVA F1,36 = 6.180, P = 0.0262.
Figure S2.
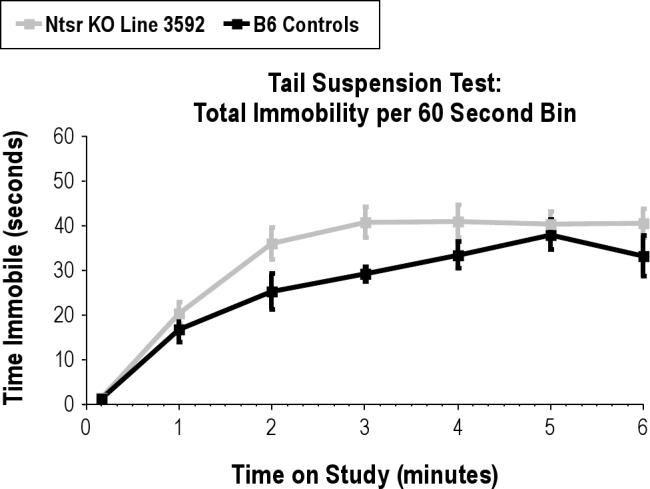
Total Immobility by minute over the 6-minute tail suspension test. Two-way repeated measures ANOVA F1,36 = 6.180, P = 0.0262.
SUPPLEMENTAL METHODS
Tail Suspension Test Performed at Merck & Co., Inc.
The mouse tail suspension test was conducted using Med-associates (St. Albans, Vermont) equipment (MED-TSS-MS). The animals were on a 12-h light: 12-h dark cycle and tested in the light phase at 8-12 weeks of age. Mice are suspended and inverted in a lighted test chamber, attached to a tail hanger in the cubicle ceiling using a piece of microfoam surgical tape (3M Corporation, St. Paul, MN). Recording is started immediately after each mouse is attached, and automated scoring is achieved using the Med-Associates software package (SOF-821). The mice remained in the chamber for 6 minutes. Mobility is detected as a vibration frequency transmitted through the tail hanger to an attached transducer. The mobility threshold is predetermined by observation and through a series of validation experiments. Immobility is scored continuously and is defined as no voluntary body or limb movement. Data were analyzed using ANOVA stats with Bonferroni posttests.
String and Grip Tests
General phenotypic analysis of the NTSR1 knockout mice from Deltagen (San Mateo, CA; line ID: T641) was performed at a satellite facility by the Mouse Clinical Institute (Illkirch Cedex, France) as contracted by Merck & Co., Inc. Included in this phenotypic analysis were the string and grip tests.
The string test was performed by taking a mouse by its tail and placing it over a wire situated 40 cm above a table so that it grips the wire with its forepaws. The latency until the mouse catches the wire with at least one of its hindpaws is recorded. The mouse is given 60 seconds to perform this test, and if it fails to catch the wire with at least one hindpaw, it is given a score of 60 seconds. If the animal falls, it is given a score of 60 seconds provided it remained gripping the wire ≥ 3 seconds. Each animal was given 3 trials of the test separated by 10-15 minutes. The average latency was calculated for each animal, and data were analyzed using Student t test. No differences were found between wild-type controls and NTSR1 knockout animals (t(22) = 0.44, P = 0.66).
The grip test was performed using an isometric dynamometer connected to a grid (Bioseb, France). The animal is placed on the grid and once it is gripping the apparatus with all four paws it is slowly and horizontally moved backwards until it releases the grid, and the maximal grip strength is recorded. Each animal was given three trials of the test separated by a few seconds. The average grip strength was calculated for each animal and data were analyzed using Student t test. No differences were found between wild type controls and NTSR1 knockout animals (t(22) = −0.314, P = 0.76).
NTSR1 Knockouts
NTSR1 knockout animals were obtained from Deltagen (San Mateo, CA; line ID: T641, bred and maintained at Taconic, Germantown, NY). The sequence that has been deleted is as follows:
(base 672 to 999) GGCACTGTGGGCAACTCGGTGACAGCCTTCACTCTAGCGCGGAAGAAGTCGCTGCAGAGCCTGCAGAGCACTGTGCATTACCACCTGGGTAGCCTGGCACTGTCTGACCTGCTCATCCTGCTGCTGGCCATGCCCGTGGAGCTGTACAACTTCATCTGGGTGCACCATCCCTGGGCCTTTGGGGATGCTGGCTGCCGTGGCTACTATTTCCTGCGAGATGCCTGCACCTATGCCACAGCCCTCAATGTAGCCAGCCTGAGTGTGGAGCGCTACTTGGCCATCTGCCATCCCTTCAAGGCCAAGACCCTCATGTCCCGCAGCCGCACCA
REFERENCES
- 1.Andretic R, Franken P, Tafti M. Genetics of sleep. Annu Rev Genet. 2008;42:361–88. doi: 10.1146/annurev.genet.42.110807.091541. [DOI] [PubMed] [Google Scholar]
- 2.O'Hara BF, Ding J, Bernat RL, Franken P. Genomic and proteomic approaches towards an understanding of sleep. CNS Neurol Disord Drug Targets. 2007;6:71–81. doi: 10.2174/187152707779940745. [DOI] [PubMed] [Google Scholar]
- 3.Lohoff F. Overview of the genetics of major depressive disorder. Curr Psychiatry Rep. 2010;12:539–46. doi: 10.1007/s11920-010-0150-6. [DOI] [PMC free article] [PubMed] [Google Scholar]
- 4.Martin EI, Ressler KJ, Binder E, Nemeroff CB. The neurobiology of anxiety disorders: brain imaging, genetics, and psychoneuroendocrinology. Clin Lab Med. 2010;30:865–91. doi: 10.1016/j.cll.2010.07.006. [DOI] [PubMed] [Google Scholar]
- 5.Lamont EW, Coutu DL, Cermakian N, Boivin DB. Circadian rhythms and clock genes in psychotic disorders. Isr J Psychiatry Relat Sci. 2010;47:27–35. [PubMed] [Google Scholar]
- 6.American Psychiatric Association. Diagnostic criteria from DSM-IV-TR. Washington, DC: American Psychiatric Association; 2000. [Google Scholar]
- 7.Kilduff TS, Lein ES, de la Iglesia H, Sakurai T, Fu YH, Shaw P. New developments in sleep research: molecular genetics, gene expression, and systems neurobiology. J Neurosci. 2008;28:11814–8. doi: 10.1523/JNEUROSCI.3768-08.2008. [DOI] [PMC free article] [PubMed] [Google Scholar]
- 8.Wisor JP, Kilduff TS. Molecular genetic advances in sleep research and their relevance to sleep medicine. Sleep. 2005;28:357–67. [PubMed] [Google Scholar]
- 9.Winrow CJ, Williams DL, Kasarskis A, et al. Uncovering the genetic landscape for multiple sleep-wake traits. PLoS One. 2009;4:e5161. doi: 10.1371/journal.pone.0005161. [DOI] [PMC free article] [PubMed] [Google Scholar]
- 10.Millstein J, Winrow CJ, Kasarskis A, et al. Identification of causal genes, networks, and transcriptional regulators of rem sleep and wake. Sleep. 2011;34:1469–77. doi: 10.5665/sleep.1378. [DOI] [PMC free article] [PubMed] [Google Scholar]
- 11.St-Gelais F, Jomphe C, Trudeau LE. The role of neurotensin in central nervous system pathophysiology: what is the evidence? J Psychiatry Neurosci. 2006;31:229–45. [PMC free article] [PubMed] [Google Scholar]
- 12.Mustain WC, Rychahou PG, Evers BM. The role of neurotensin in physiologic and pathologic processes. Curr Opin Endocrinol Diabet Obes. 2011;18:75–82. doi: 10.1097/MED.0b013e3283419052. 10.1097/MED.0b013e3283419052. [DOI] [PubMed] [Google Scholar]
- 13.Shilling PD, Feifel D. The neurotensin-1 receptor agonist PD149163 blocks fear-potentiated startle. Pharmacol Biochem Behav. 2008;90:748–52. doi: 10.1016/j.pbb.2008.05.025. [DOI] [PMC free article] [PubMed] [Google Scholar]
- 14.Cervo L, Rossi C, Tatarczynska E, Samanin R. Antidepressant-like effect of neurotensin administered in the ventral tegmental area in the forced swimming test. Psychopharmacology (Berl) 1992;109:369–72. doi: 10.1007/BF02245885. [DOI] [PubMed] [Google Scholar]
- 15.Cáceda R, Kinkead B, Nemeroff CB. Neurotensin: Role in psychiatric and neurological diseases. Peptides. 2006;27:2385–404. doi: 10.1016/j.peptides.2006.04.024. [DOI] [PubMed] [Google Scholar]
- 16.Robledo P, Kaneko WM, Ehlers CL. Effects of neurotensin on EEG and event-related potentials in the rat. Psychopharmacology. 1995;118:410–8. doi: 10.1007/BF02245941. [DOI] [PubMed] [Google Scholar]
- 17.Cape EG, Manns ID, Alonso A, Beaudet A, Jones BE. Neurotensin-induced bursting of cholinergic basal forebrain neurons promotes gamma and theta cortical activity together with waking and paradoxical sleep. J Neurosci. 2000;20:8452–61. doi: 10.1523/JNEUROSCI.20-22-08452.2000. [DOI] [PMC free article] [PubMed] [Google Scholar]
- 18.Papadimitriou GN, Linkowski P. Sleep disturbance in anxiety disorders. Int Rev Psychiatry. 2005;17:229–36. doi: 10.1080/09540260500104524. [DOI] [PubMed] [Google Scholar]
- 19.Ohayon MM, Caulet M, Lemoine P. Comorbidity of mental and insomnia disorders in the general population. Compr Psychiatry. 1998;39:185–97. doi: 10.1016/s0010-440x(98)90059-1. [DOI] [PubMed] [Google Scholar]
- 20.Peterson MJ, Benca RM. Sleep in mood disorders. Psychiatr Clin North Am. 2006;29:1009–32. doi: 10.1016/j.psc.2006.09.003. abstract ix. [DOI] [PubMed] [Google Scholar]
- 21.Deltagen. NIH initiative supporting placement of Deltagen, Inc. mice into public repositories. MGI Direct Data Submission 2005 ed. 2005 [Google Scholar]
- 22.Laposky AD, Shelton J, Bass J, Dugovic C, Perrino N, Turek FW. Altered sleep regulation in leptin-deficient mice. Am J Physiol Regul Integr Comp Physiol. 2006;290:R894–903. doi: 10.1152/ajpregu.00304.2005. [DOI] [PubMed] [Google Scholar]
- 23.David DJ, Wang J, Samuels BA, et al. Implications of the functional integration of adult-born hippocampal neurons in anxiety-depression disorders. Neuroscientist. 2010;16:578–91. doi: 10.1177/1073858409360281. [DOI] [PubMed] [Google Scholar]
- 24.Wand G. The anxious amygdala: CREB signaling and predisposition to anxiety and alcoholism. J Clin Invest. 2005;115:2697–9. doi: 10.1172/JCI26436. [DOI] [PMC free article] [PubMed] [Google Scholar]
- 25.Geisler S, Bérod A, Zahm DS, Rosténe W. Brain neurotensin, psychostimulants, and stress - emphasis on neuroanatomical substrates. Peptides. 2006;27:2364–84. doi: 10.1016/j.peptides.2006.03.037. [DOI] [PubMed] [Google Scholar]
- 26.Engin E, Treit D. The role of hippocampus in anxiety: intracerebral infusion studies. Behav Pharmacol. 2007;18:365–74. doi: 10.1097/FBP.0b013e3282de7929. [DOI] [PubMed] [Google Scholar]
- 27.Kalia M. Neurobiological basis of depression: an update. Metabolism. 2005;54:24–7. doi: 10.1016/j.metabol.2005.01.009. [DOI] [PubMed] [Google Scholar]
- 28.Saiz Ruiz J, Carrasco Perera JL, Hernanz A. Plasma neuropeptides in affective and anxiety disorders. Arch Neurobiol (Madr) 1992;55:1–5. [PubMed] [Google Scholar]
- 29.Remaury A, Vita N, Gendreau S, et al. Targeted inactivation of the neurotensin type 1 receptor reveals its role in body temperature control and feeding behavior but not in analgesia. Brain Res. 2002;953:63–72. doi: 10.1016/s0006-8993(02)03271-7. [DOI] [PubMed] [Google Scholar]
- 30.Kim ER, Leckstrom A, Mizuno TM. Impaired anorectic effect of leptin in neurotensin receptor 1-deficient mice. Behav Brain Res. 2008;194:66–71. doi: 10.1016/j.bbr.2008.06.024. [DOI] [PubMed] [Google Scholar]
- 31.Perlis ML, Giles DE, Buysse DJ, Thase ME, Tu X, Kupfer DJ. Which depressive symptoms are related to which sleep electroencephalographic variables? Biol Psychiatry. 1997;42:904–13. doi: 10.1016/S0006-3223(96)00439-8. [DOI] [PubMed] [Google Scholar]
- 32.Kessler RC, Gruber M, Hettema JM, Hwang I, Sampson N, Yonkers KA. Co-morbid major depression and generalized anxiety disorders in the National Comorbidity Survey follow-up. Psychol Med. 2008;38:365–74. doi: 10.1017/S0033291707002012. [DOI] [PMC free article] [PubMed] [Google Scholar]
- 33.Snyder F. Dynamic aspects of sleep disturbance in relation to mental illness. Biol Psychiatry. 1969;1:119–30. [PubMed] [Google Scholar]
- 34.Kupfer D, Foster FG. Interval between onset of sleep and rapid-eye-movement sleep as an indicator of depression. Lancet. 1972;300:684–6. doi: 10.1016/s0140-6736(72)92090-9. [DOI] [PubMed] [Google Scholar]
- 35.Benca RM, Obermeyer WH, Thisted RA, Gillin JC. Sleep and psychiatric disorders: a meta-analysis. Arch Gen Psychiatry. 1992;49:651–68. doi: 10.1001/archpsyc.1992.01820080059010. [DOI] [PubMed] [Google Scholar]
- 36.Lee EK, Douglass AB. Sleep in psychiatric disorders: Where Are We Now? Car J Psych. 2010;55:403–12. doi: 10.1177/070674371005500703. [DOI] [PubMed] [Google Scholar]