

Abstract
Objectives:
To identify common genetic variants that predispose to caffeine-induced insomnia and to test whether genes whose expression changes in the presence of caffeine are enriched for association with caffeine-induced insomnia.
Design:
A hypothesis-free, genome-wide association study.
Setting:
Community-based sample of Australian twins from the Australian Twin Registry.
Participants:
After removal of individuals who said that they do not drink coffee, a total of 2,402 individuals from 1,470 families in the Australian Twin Registry provided both phenotype and genotype information.
Measurements and Results:
A dichotomized scale based on whether participants reported ever or never experiencing caffeine-induced insomnia. A factor score based on responses to a number of questions regarding normal sleep habits was included as a covariate in the analysis. More than 2 million common single nucleotide polymorphisms (SNPs) were tested for association with caffeine-induced insomnia. No SNPs reached the genome-wide significance threshold. In the analysis that did not include the insomnia factor score as a covariate, the most significant SNP identified was an intronic SNP in the PRIMA1 gene (P = 1.4 × 10⁻⁶, odds ratio = 0.68 [0.53 – 0.89]). An intergenic SNP near the GBP4 gene on chromosome 1 was the most significant upon inclusion of the insomnia factor score into the model (P = 1.9 × 10⁻⁶, odds ratio = 0.70 [0.62 – 0.78]). A previously identified association with a polymorphism in the ADORA2A gene was replicated.
Conclusions:
Several genes have been identified in the study as potentially influencing caffeine-induced insomnia. They will require replication in another sample. The results may have implications for understanding the biologic mechanisms underlying insomnia.
Citation:
Byrne EM; Johnson J; McRae AF; Nyholt DR; Medland SE; Gehrman PR; Heath AC; Madden PAF; Montgomery GW; Chenevix-Trench G; Martin NG. A genome-wide association study of caffeine-related sleep disturbance: confirmation of a role for a common variant in the adenosine receptor. SLEEP 2012;35(7):967-975.
Keywords: Caffeine, insomnia, genetics
INTRODUCTION
Caffeine is the most widely used psychoactive drug in the world, being used habitually by more than 80% of adults worldwide.1 Many different types of food and beverages contain caffeine, and caffeine consumption and withdrawal is known to cause many side effects. One of the most common side effects of caffeine consumption is sleep loss. The ability to stay awake longer is one of the major reasons for people to consume caffeine, whereas sleep loss is also a major reason for some not to consume caffeine.2 Caffeine can also help to alleviate negative mood effects brought on by lack of sleep.3 Negative effects of caffeine on sleep have been consistently found, including shortened total sleep time, prolonged sleep latency, and changes in the duration of light and deep sleep.4 In general, coffee consumption is lower in good sleepers than in poor sleepers and one study has shown that coffee consumed close to bedtime caused delayed onset of sleep, independent of total caffeine consumption throughout the day.5
Caffeine is thought to be metabolized mainly in the liver by the cytochrome p450 CYP1A2, and metabolites are broken down further by the enzymes CYP2A6 and NAT2.6–8 Evidence suggests that caffeine mediates its effects by acting as a competitive inhibitor at the adenosine receptors1 and the A2A receptor is hypothesized to be the main target for caffeine in the brain. Consistent with the mechanism of caffeine action on the A2A receptor, a polymorphism in the ADORA2A gene has been associated with caffeine consumption.9
The adenosine pathway is known to affect general sleep,10,11 and caffeine's antagonism of this pathway is thought to explain its effects on sleep. Hence, differential sensitivity to caffeine may explain individual differences in caffeine-related sleep loss. It has been previously shown in our sample that caffeine-related sleep loss is heritable and there are genetic effects independent of those on general insomnia,12 and a polymorphism in the ADORA2A gene is known to explain some of the variation in sleep loss after caffeine consumption.4 This finding is supported by mouse models, in which animals lacking A2A receptors did not experience caffeine-induced wakefulness.13
So far, efforts to find genetic variants that contribute to variation in caffeine-related sleep effects have been confined to candidate gene studies and this approach has had some success,4 whereas the only known linkage scan that was performed on the same sample used in the current study was less successful.12 Genome-wide association studies (GWAS) allow testing of several million common variants across the genome and require no prior hypothesis about potential association between a gene or variant and the phenotype of interest. GWAS have been successful in identifying variants that influence complex traits,14 and in many cases, those variants have been part of biologic pathways that had never previously been implicated in those traits. Here, we carry out GWAS for caffeine-related sleep disruption in an attempt to identify additional variants that influence this trait, and to replicate the previous association finding in the ADORA2A gene. In addition, we carry out a gene-based test to identify genes that show evidence of association at multiple single nucleotide polymorphisms (SNPs). We combine the results of GWAS with gene expression data from cells that have been treated with caffeine, to test whether genes regulated by caffeine are more likely to show evidence of association than would be expected by chance. Finally, we use pathway analysis to test whether there is enrichment of association of genes in known biologic pathways.
METHODS
Participants
Between 1980 and 1982, a health and lifestyle questionnaire was administered by mail to 5,867 complete pairs of twins who had been registered with the Australian Twin Registry. Responses were received from a total of 7,526 individuals (2,746 males and 4,780 females) and they had a mean age of 34.5 yr (standard deviation = 14.3). After removal of individuals who said that they do not drink tea or coffee, a total of 2,402 individuals from 1,470 families provided both phenotype and genotype information. Phenotypic and genotypic data collection was approved by the Queensland Institute of Medical Research Ethics Committee and informed consent was obtained from all participants.
Sleep Disturbance Measures
As part of the questionnaire, respondents were asked a number of questions about their sleep habits and how often they experience sleep disturbance. These included questions about the overall quality of sleep, variability in quality, depth of sleep, difficulty initiating sleep, anxious insomnia, depressed insomnia, and frequency of night waking. Principal components analysis applied to this dataset previously showed that the sleep measures assessed in the questionnaire - sleep quality, variability of quality, initial insomnia, sleep latency, night-time waking, anxious insomnia, and depressed insomnia - appear to load strongly on a general sleep disturbance component that measures general insomnia.15 In the current analysis, principal components analysis was performed on the same variables to derive an overall score for insomnia for each individual. The analysis supported a single factor loading on these variables. Further information on the sleep disturbance measures in the questionnaire can be found in several studies.12,15,16
Participants were also asked the following question:
If you were to drink COFFEE in the evening would it stop you from getting to sleep at night?
1) Always 2) Usually 3) Sometimes 4) Never
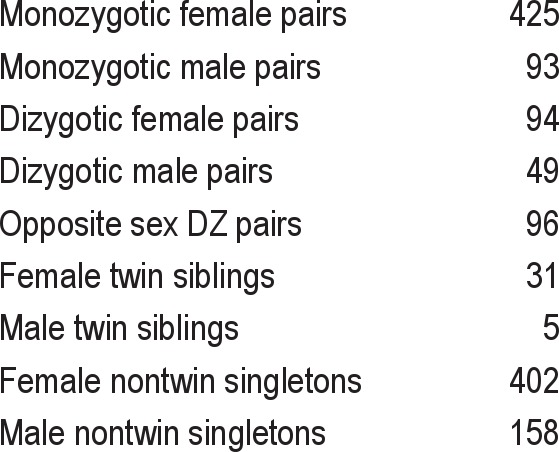
Given the low endorsement of the first two categories – Always (3.1%) and Usually (6.0%) – they were pooled with those who were sometimes affected. This divided the sample into those who were ever affected and those who were never affected. After pooling, 678 individuals (32.1%) were classified as having ever suffered from caffeine-related sleep disturbance, whereas 1,432 individuals (67.8%) had never experienced sleep disturbance. The breakdown of the sample by zygosity is given in Table 1.
Table 1.
Breakdown of the sample by zygosity
Genotyping
Genotype information was collected as part of a number of genotyping projects undertaken by the genetic epidemiology group at Queensland Institute of Medical Research. DNA samples were collected in accordance with standard protocols and submitted to different genotype centers using different single nucleotide polymorphism platforms (Illumina 317K, IlluminaHumanCNV370- Quadv3, and Illumina Human 610-Quad, Illumina Inc. San Diego, CA). A standard quality control procedure was used for all of the genotyping projects prior to imputation. A detailed description of the quality control steps and procedure for detection of ancestry outliers is given elsewhere.17 A set of 274,604 SNPs that were common to all of the genotyping chips were used for imputation, which was performed using the Markov chain-based haplotyper (MACH) program.18 The imputation process uses information on the haplotype structure in the human genome from the HapMap project (Release22, Build36) to impute nongenotyped SNPs in the sample. The process that transfers pieces of DNA from one chromosome to another and thus shuffles the combinations, known as recombination, occurs nonrandomly throughout the genome. Therefore, segments of chromosomes are always transmitted as a unit and thus knowledge of the genotype at one allele provides information on the genotypes at other alleles in the same segment of chromosome. The imputation process uses the information from genotyped SNPs to infer genotypes at nongenotyped SNPs. This process therefore allows for combining of genotype information from different SNP platforms as the missing SNPs on each platform can be imputed.
The imputed SNPs were screened further for mendelian errors, minor allele frequency, and missingness. Only SNPs with an imputation quality score (r2 – the squared correlation between the estimated genotype scores and true genotypes) greater than 0.3 were retained, which resulted in a total number of 2,380,486 SNPs.
Genome-wide Association Study
Two separate genome-wide association analyses were performed. In both cases generalized estimating equations19 were used to test for association. This method allows inclusion of family members in case-control analysis by adjusting the expected SNP variance due to familial relationships using a kinship matrix. The generalized estimating equations method was implemented in the freely available Generalized Disequilibrium Test software.20 In the first analysis, only age and sex were included as covariates. In the second analysis, the insomnia factor score was included as a covariate in addition to age and sex. The second test was performed to account for the variance in caffeine-induced insomnia caused by genetic variants that increase risk of insomnia independent of caffeine consumption. In both cases, an allelic test of association was used, which assumes an additive mode of action for each SNP and ignores dominance effects.
We used the threshold of 7.2 × 10⁻⁸ derived using simulations in a Caucasian population by Dudbridge and Gusnanto21 as the genome-wide significance level.
Post-GWAS analysis and annotation was carried out using the program WGAViewer.22 Because of the highly correlated nature of the results from imputed data, some regions will have many SNPs with similar P values. The clumping algorithm in PLINK23 was used to filter results and find the most significant independent signals. SNPs with pairwise r2 < 0.5 (a measure of linkage disequilibrium between SNPs) were considered to be independent signals.
Gene-Based Test
To determine whether there are any genes that harbor an excess of SNPs with small P values, a gene-based test of association was performed.24 The test uses the P values from the single SNP association analysis and computes an overall gene-based test statistic by aggregating the individual SNP effects in each gene, accounting for the number of SNPs in each gene, and the correlation between them due to linkage disequilibrium (non-independence of SNPs). The association results from the analysis that included the insomnia factor score were used for computing the gene-based P values. A total of 17,681 genes were included in the gene-based analysis.
Gene Expression Analysis
Caffeine treatment was performed on three different cell types: (1) lymphoblastoid cell lines established from the blood of 24 females from hereditary non-BRCA1/2 breast cancer families recruited into the Kathleen Cuningham Foundation for Research into Breast Cancer (kConFab); (2) the colon cancer cell line, HT29; and (3) a cell line established from a breast to bone metastasis tumor. Experiments were performed in triplicate for each sample. Optimization experiments determined cell number and caffeine concentration for each cell type. Full details of the methods are provided in the study by Amin et al.25 Total RNA was extracted from both caffeine-treated and untreated control cells using the RNeasy RNA extraction kit (Qiagen, Hilden, Germany). A total of 156 samples (750 ng complementary RNA per sample) were hybridized to HumanHT-12 Expression BeadChips (Illumina Inc, San Diego, CA, USA) using all manufacturer's reagents for washing, detecting, and scanning as per the whole-genome gene expression direct hybridization assay protocol (Illumina Inc, San Diego, CA, USA).
The HumanHT-12 Expression BeadChips (Illumina Inc, San Diego, CA, USA) contains 48,803 probes that cover more than 25,000 annotated genes. Expression data were collated and quality checked in the Illumina BeadStudio and then imported into GeneSpring V10.0 (Agilent Technologies, Santa Clara, CA, USA). Data were quantile normalized to the baseline of the median of all samples and then filtered using an Illumina detection score of 0.95 or greater in at least one sample. To identify differentially expressed genes between each caffeine-treated sample to its own untreated control sample, a linear model was implemented using R and the LInear Mixed Models for MicroArray data (LIMMA)26 package. Data were adjusted for multiple testing with a false discovery rate of 5%. Two criteria were used to select the set of relevant genes. First, a set of genes with a log odds > (B-statistic) was selected, followed by a hierarchical search of genes based on log-fold changes.
Gene lists were then imported into GeneSpring V10.0 (Agilent Technologies) for data visualization and to determine overlapping genes between different cell types.
Enrichment Analysis
A rank-test was used to test for enrichment of genes whose expression level changed after treatment with caffeine. A total of 647 genes were differentially expressed in all three cell types and had at least one SNP typed for the gene-based test. To test whether this gene set was enriched in the gene-based test, an empirical distribution of mean ranks was generated by randomly drawing 647 genes from the list in the gene-based test, and calculating the mean position on the list. This was repeated 1 million times, and a P value was calculated by testing how many of the randomly drawn gene sets had a lower mean than the set of differentially expressed genes. In addition, the same test was carried out to compare whether genes that showed the greatest log-fold change either up or down in expression in the lymphoblastoid cell lines were enriched in the analysis.
Pathway Analysis
To test whether there was an enrichment of associations in genes that act in the same biologic pathway or genes that have strongly related functions, all genes with a P value less than 0.05 from the gene-based test were included in a pathway analysis in the Ingenuity Pathway analysis software (Ingenuity Systems Release 6.0, Ingenuity Systems Inc, Redwood City, CA, USA). The Ingenuity program collates information from published research articles regarding the structure, function, localization, and interactions of proteins and molecules and assigns them to functional and canonical pathways. This permits testing for enrichment of a particular pathway that may be relevant to the trait of interest. The Fisher exact test is used initially to test whether a particular pathway is overrepresented, and the Benjamini-Hochberg method is used to correct the P values for multiple testing. A corrected P < 0.05 was considered to be significant.
RESULTS
The quantile-quantile plots of the observed versus expected –log10(P) from the two (noninsomnia adjusted and insomnia adjusted) association analyses are presented in Figure 1. No SNPs passed the genome-wide significance threshold (P < 7.2 × 10⁻⁸) and there was no evidence of population stratification as evidenced by the genomic control λ (the median χ2 association statistic divided by the median expected under the null hypothesis of no association) being 0.99 for both analyses. Manhattan plots for both analyses are provided in Figure 2.
Figure 1.
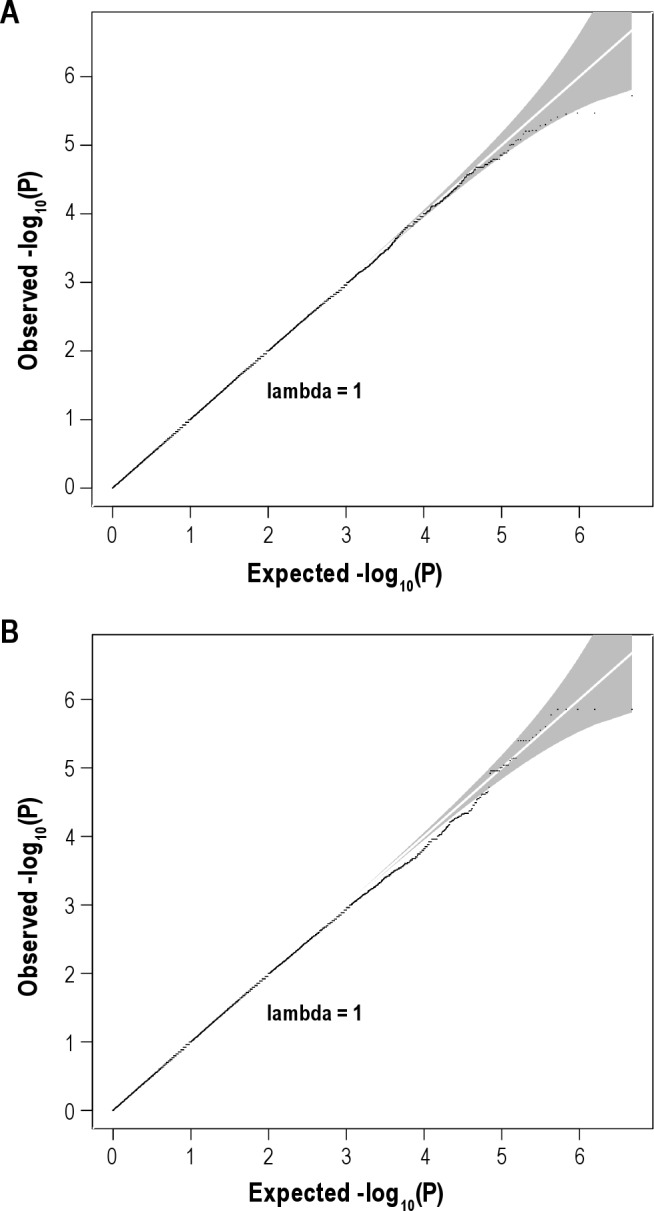
(A) Quantile-quantile (Q-Q) plot for analysis with age and sex as covariates only. (B) Q-Q plot for analysis with insomnia factor score included as a covariate.
Figure 2.
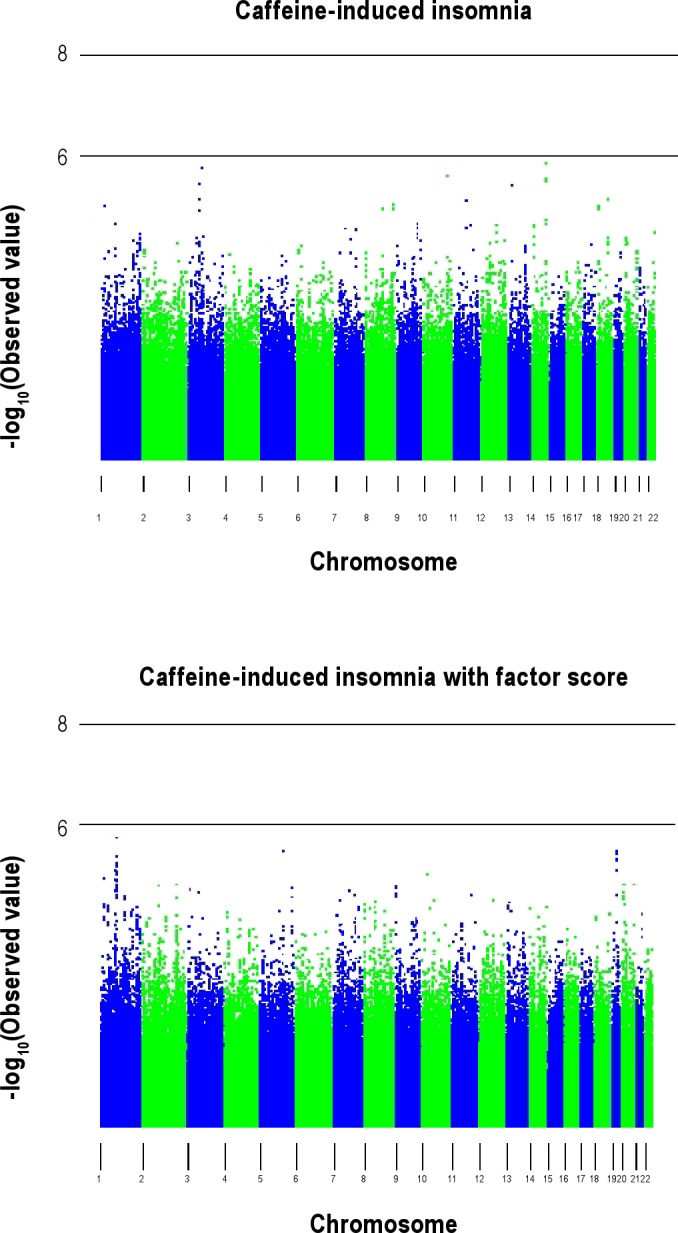
Manhattan plots for the 2 association analyses.
Table 2 shows the most significant SNPs for the association analysis that was not adjusted for the general insomnia factor score. Many of the most significant associations are with SNPs that are found in intergenic regions some distance from the nearest gene, whereas others are found in or near genes that have not been well annotated and about whom little is known. The most significant SNP – rs6573232 (P = 1.4 × 10⁻⁶) – is found in an intron of the PRIMA1 gene that codes for a proline-rich protein whose function is to organize acetylcholinesterase into tetramers and anchor it to the membrane of neurons.27 The gene has been shown to be upregulated during the neuronal differentiation process,28 and as such, may represent a good candidate to influence caffeine-induced insomnia.
Table 2.
Annotated list of the most highly associated independent SNPs (P < 10−5) for the association analysis that was unadjusted for general insomnia
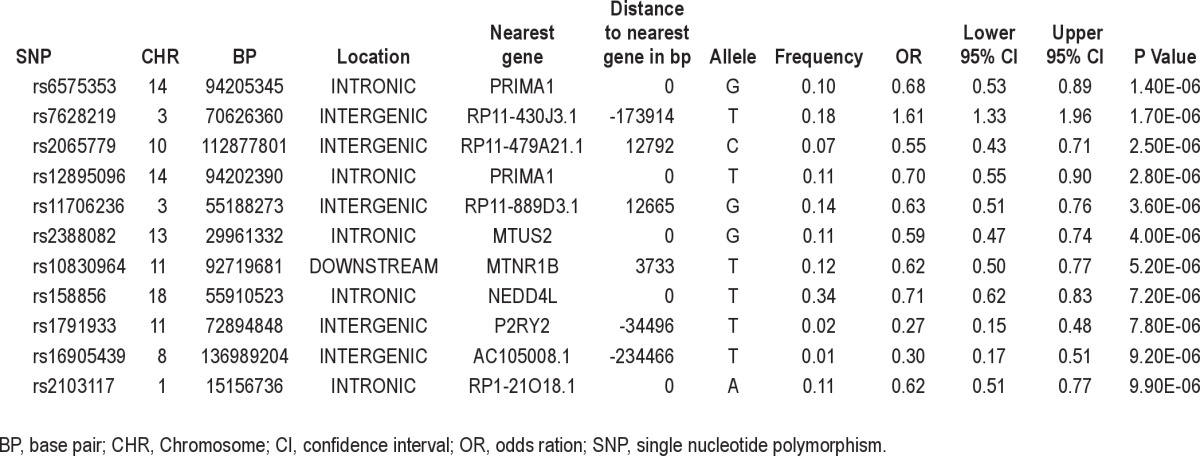
A set of intronic SNPs in the MTUS2 gene also shows evidence of association (P = 4.0 × 10⁻⁶) with caffeine-induced insomnia (Table 2). The MTUS2 gene encodes the microtubule-associated tumor suppressor candidate 2. The gene is also known as CAZIP and TIP150 and is known to be involved in development of the nervous system.29
Of the well-annotated genes, perhaps the most interesting is MTNR1B, which codes for one of two melatonin receptors. rs10830964, a SNP found downstream of this gene, shows strong evidence for association (P = 5.2 × 10⁻⁶, minor allele frequency (MAF) = 0.12, odds ratio (OR) = 0.62 [0.50 – 0.77]).
Among the other genes that harbor SNPs showing evidence of association are NEDD4L, a gene that is known to regulate and interact with ion channels30,31 and that has previously been associated with hypertension,32 and P2RY2, a gene that codes for a G protein coupled receptor that is known to bind adenosine and control Ca2+ influx in cells.
The most strongly associated SNPs from the analysis that included the general insomnia factor score as a covariate are shown in Table 3. The most significant SNP (rs521704, P = 1.9 × 10⁻⁶, MAF = 0.45, OR = 0.70 [0.62 – 0.78]) is an intergenic SNP, the nearest gene being GBP4, which codes for guanylate binding protein 4. GBP4 is part of a cluster of guanylate-binding genes on chromosome 1 that are induced by the immune system and hydrolyze guanosine triphosphate to guanosine diphosphate.33 Another SNP – rs12407812 - located nearby in GBP1, was also among the most significant variants, and the GBP genes ranked at or near the top of the gene-based test (Table 4). There is no evidence to suggest that these genes also act on adenosine, but adenosine and guanine have a similar structure. Like caffeine, both molecules are purines, and it is possible that proteins that bind to guanine may be inhibited by caffeine occupying the active site.
Table 3.
Annotated list of the most highly associated independent SNPs (P < 10−5) for the association analysis that included the general insomnia factor score as a covariate
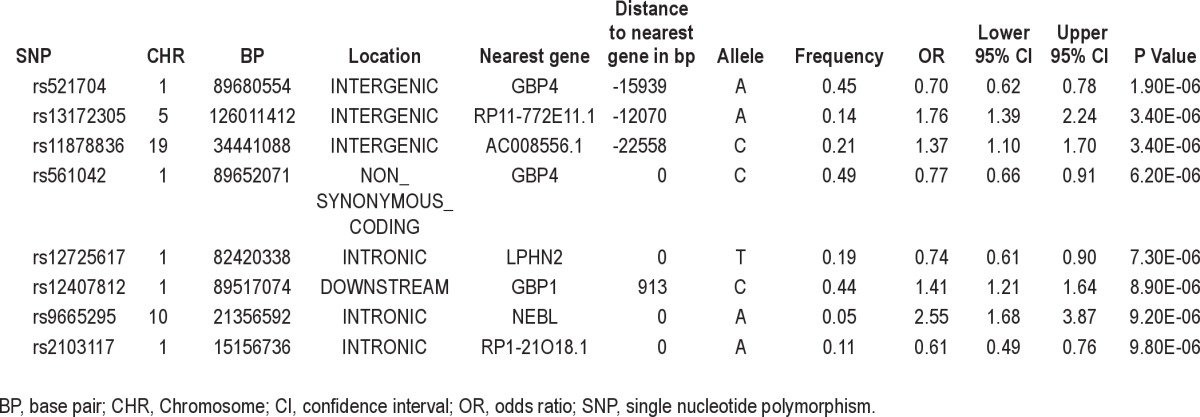
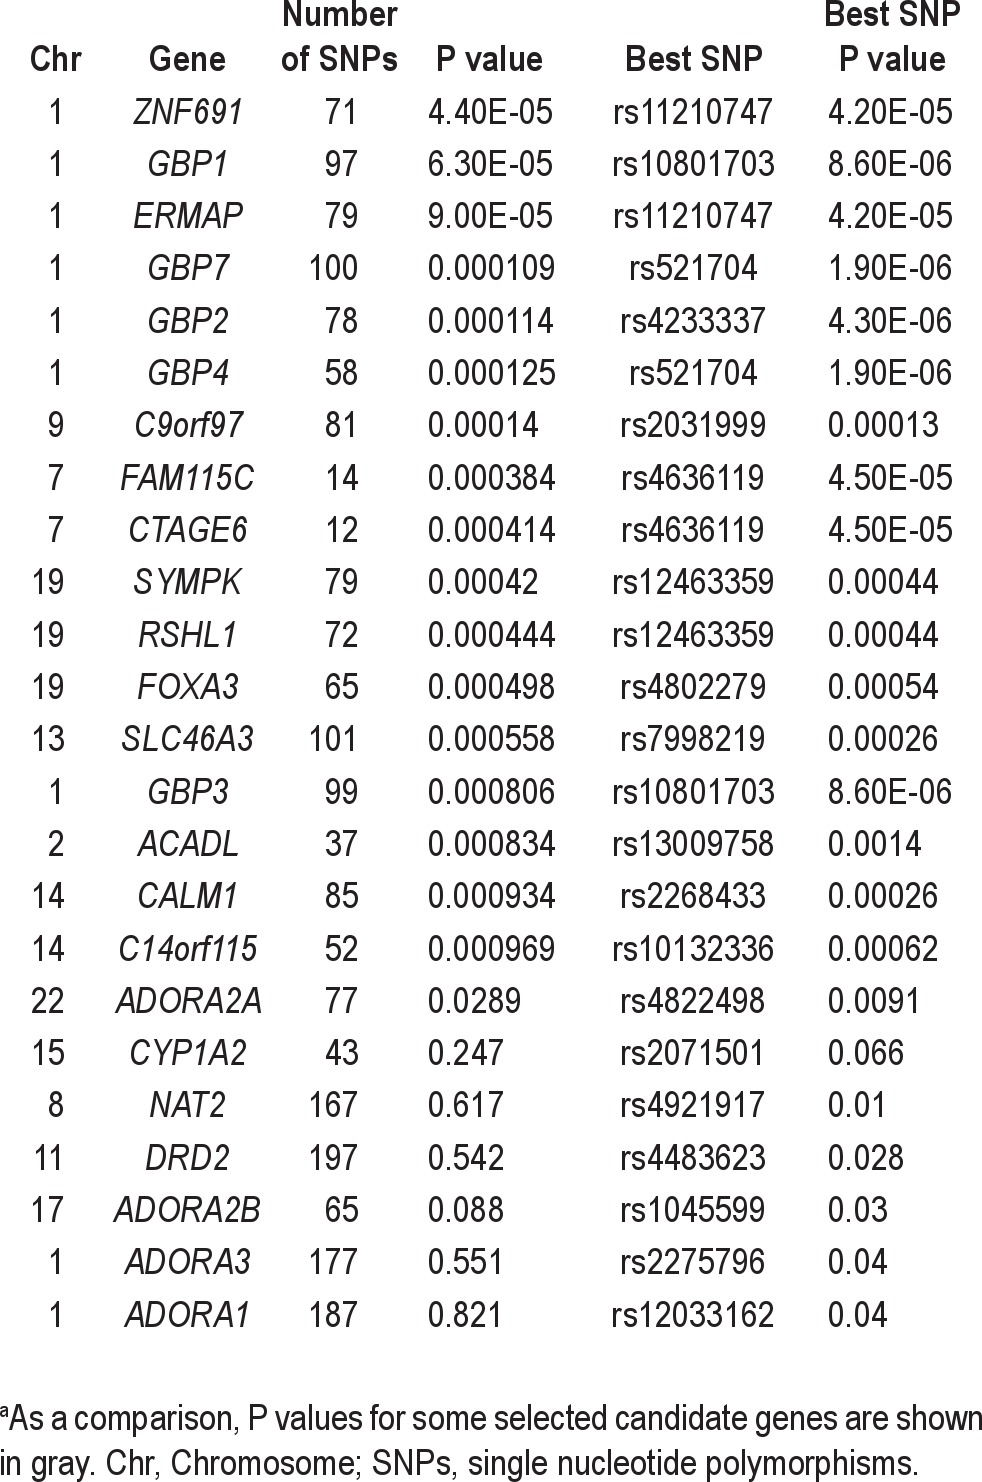
Table 4.
List of genes with P < 10−3 for gene-based association testa
Other SNPs that rank among the most associated include SNPs located in introns of the LPHN2 and NEBL genes on chromosomes 1 and 10, respectively. LPHN2 encodes a G protein-coupled receptor that is expressed in brain that is the primary receptor for alpha-latrotoxin.34 This gene has been implicated in breast cancer.35 NEBL encodes a nebulin-like protein that is expressed primarily in cardiac tissue.
Testing of Previously Reported Association with rs5751876
A previous study identified rs5751876, a SNP in the adenosine receptor gene ADORA2A, as being associated with individual sensitivity to caffeine's effects on sleep (P = 0.03).4 It was noted that those with C/C genotype were more likely to be sensitive to caffeine's effects on sleep. The C allele is the major allele with a frequency of 59%, so those carrying the minor allele were less likely to be sensitive. Because this SNP was not included in the HapMap project and was also not included on the genotyping chips used here, we could not directly try to replicate those results. However, based on data from the 1000 Genomes Project (www.1000genomes.org), we identified a number of SNPs (rs5760423, rs5760425, rs3761422, MAF = 0.38) in the ADORA2A gene in perfect linkage disequilibrium (LD) with the previously identified variant that were imputed in our dataset. We were able to replicate the previous findings, with the LD proxy SNPs having P = 0.019 with an OR of 0.62 (0.50 – 0.78) for the minor allele. From the OR it can be seen that the minor allele decreases the likelihood of experiencing insomnia after coffee consumption, replicating the findings of Retey et al.4 A further SNP, rs4822498, that is in very strong LD (r2 = 0.99) with the previously associated SNP showed the strongest evidence for association of all the SNPs within 50 kb either side of the ADORA2A gene (P = 0.0091, OR = 0.61 [0.50 – 0.76]). This SNP is located in an open reading frame that is downstream of the ADORA2A gene on chromosome 22 and is encoded on the opposite strand (C22orf45). A test for nonadditive effects (dominance and recessive) was performed for the most significant ADORA2A SNP (rs4822498) and for one of the SNPs in perfect LD with the previously identified SNP, but no significant effects were found. In addition, a test for interaction effects between rs4822498 and rs5760423 was performed, but there was no evidence of an interaction (P = 0.98). Furthermore, an association scan of the region that conditioned upon the SNP rs4822498 failed to identify any other significant SNPs in the ADORA2A region.
Gene-Based Test
The most associated genes from the Versatile Gene-based Association Study (VEGAS) gene-based test are provided in Table 4. As a comparison, the results for a number of candidate genes for caffeine-related insomnia are shown in gray. The ADORA2A gene ranked 527th on the list and had a P value of 0.028.
A total of 647 autosomal genes were found to be differentially expressed in all 3 cell types and also analyzed in the gene-based test. The highest ranking of these, at 43rd, is PDCD4 (P = 0.0025), a gene that is thought to play a role in programmed cell death. This gene is a tumor suppressor gene that is downregulated in a number of different forms of cancer.36,37 There was no evidence to suggest that the differentially expressed genes are more highly associated than would be expected by chance (P = 0.21).
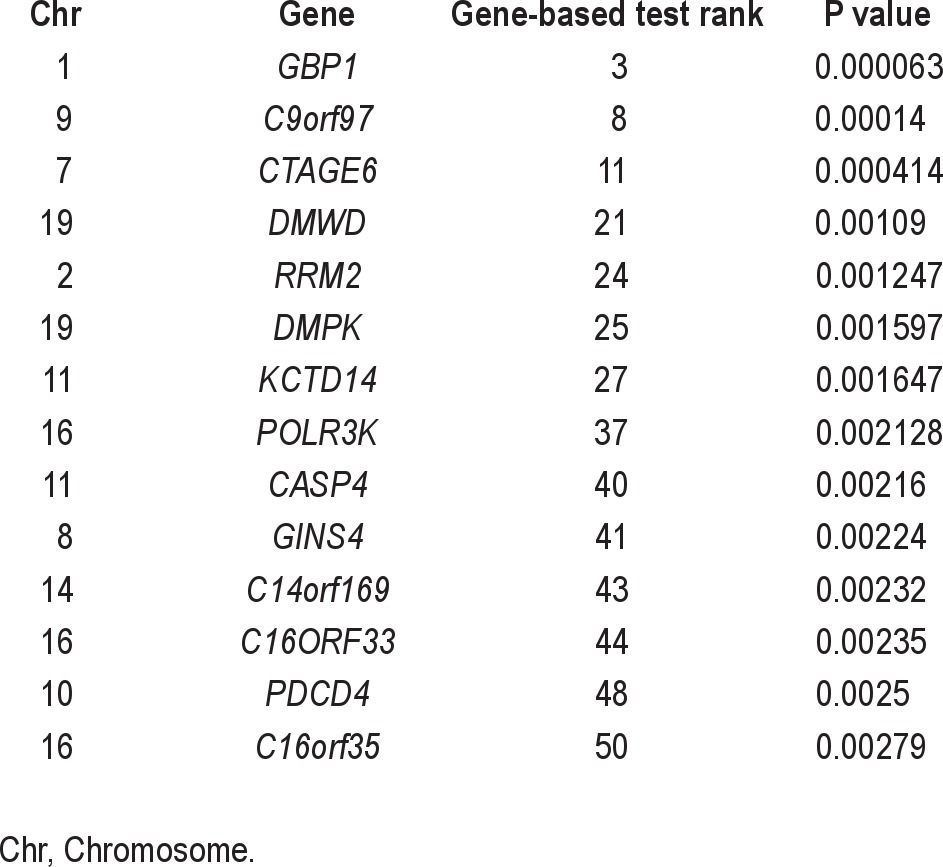
Interestingly, the second highest-ranked gene in the gene-based test, GBP1, was found to be differentially expressed in two of the cell types (lymphoblastoid cell lines and bone metastasis), but not the other. After relaxing the constraints for inclusion in the rank-test to those genes that are differentially expressed in at least two genes (n = 2,038), there is still no evidence for enrichment of association (P = 0.16). A similar analysis of the most highly changed genes as measured by log-fold change in expression levels also showed no evidence for enrichment. Table 5 lists genes ranked in the top 50 most significant genes in the gene-based test and that are differentially expressed in at least two of the cell types.
Table 5.
List of genes ranked in the top 50 most significant in the gene-based test and that were found to be differentially expressed in at least 2 of the cell types
Pathway Analysis
A total of 628 genes had P < 0.05 from the gene-based test and could be assigned a function or pathway in the Ingenuity program. After accounting for multiple testing, no functional or canonical pathways showed evidence for enrichment. The most strongly significant biologic function was nucleic acid metabolism (P = 1.6 × 10⁻⁴). The nucleic acid metabolism function is further subdivided into more specific categories, many of which relate specifically to adenosine metabolism. The role of ADORA2A in mediating the signaling effects of adenosine were mentioned previously, but there are several other genes involved in adenosine metabolism that show evidence for association. The genes FXYD2 and EPHB6 are both involved in increasing binding affinity of adenosine triphosphatase (ATPase) enzymes for ATP, thus increasing ATP metabolism, whereas ADK phosphorylates adenosine to adenosine monophosphate and ADAT1 is known to increase deamination of adenosine. Additionally, PAPSS1 is involved in the synthesis of phosphoadenosine. Other genes in the nucleic acid such as RRM2 fall in to the nucleic acid metabolism category, but are not adenosine-specific. Given the evidence to suggest the involvement of adenosine in both general sleep and in caffeine sensitivity, it is likely not a coincidence that the most significantly enriched pathway for association includes several genes involved in adenosine metabolism. Despite the lack of experiment-wise significance, variants in these genes are good candidates for association with caffeine-attributed insomnia.
DISCUSSION
We have undertaken a genome-wide association study of caffeine-related sleep disturbance. Previous analysis of the dataset used here demonstrated that this trait is heritable and is influenced by genetic factors that are independent of those influencing general insomnia.12 The advantage of the GWAS approach is that it requires no prior hypothesis and in many cases, variants in genes that were never previously thought to be associated with a trait have been discovered, elucidating biologic pathways that have an effect on the phenotype of interest. Due to the large number of tests being carried out, stringent significance levels are used to avoid false-positive associations, and as such, large sample sizes are required to detect variants with small effects on the phenotype. In this study, we have combined gene expression data from cells treated with caffeine with GWAS data in an attempt to gain more insight on caffeine metabolism in cells and differences in within-population effects of caffeine.
We have identified a number of genes that show evidence of association with caffeine-induced insomnia. The most significant association when analyzing the caffeine-related insomnia without adjusting for general insomnia was rs6575353 (P = 1.6 × 10⁻⁶) located in an intron of the PRIMA1 gene on chromosome 14. When general insomnia was included in the analysis, the most significant SNP was rs521704 (P = 1.9 × 10⁻⁶) located approximately 15 kb upstream of the GBP4 gene on chromosome 1. These associations did not reach genome-wide significance, but these SNPs can be targeted for replication in another sample.
Another potential target for replication is rs10830964, located near the MTNR1B gene, which encodes a subunit of the melatonin receptor that is expressed primarily in the retina and brain. The SNP was among the highest ranked in the analysis that excluded general insomnia (P = 5.2 × 10⁻⁶). Melatonin is a hormone produced by the pineal gland in the brain in response to light and dark signals from the retina. It is an important point of control of circadian rhythms and is at its highest concentration in the middle of the night and lowest during the day. Studies have shown that prolonged release of melatonin can help to cure insomnia in older people,38 and a drug called ramelteon, which acts as an agonist of the melatonin receptor B1, has been approved in clinical trials to treat insomnia (www.fda.gov). Many other supplements that are designed to improve sleep quality contain slow-release melatonin. Polymorphisms in or near this gene are good candidates to contribute to susceptibility to both caffeine-related and general insomnia. Common genetic variants in the MTNR1B gene have also been found to influence fasting glucose levels and type 2 diabetes in multiple populations.39,40 The SNP remained nominally significant after including the insomnia factor score as a covariate (P = 0.0003), indicating that its effect may act on caffeine-induced insomnia rather than on general insomnia.
In addition, we were able to replicate the previous findings of an association between a polymorphism in the ADORA2A gene rs5751876 and sleep disruption after caffeine consumption. Although the SNP was not typed in our sample, we were able to use information from the 1000 Genomes Project to identify proxy SNPs in complete LD with the candidate SNP. This result is notable in that is one of very few associations from the candidate gene era in behavioral genetics to replicate in the GWAS era. It also highlights the difficulty in isolating the true causal variant in genetic association studies. The association signal identified in the initial study may in fact be due to correlation with other variants (potentially variants not tested for in GWAS) in the same vicinity. But the ADORA2A gene should be targeted for future sequencing and functional studies in the context of caffeine consumption, caffeine-induced insomnia and general insomnia. These studies may help to identify the true causal variant in this region of the genome.
There are several factors that may have affected the power of our study. First, for the sleep disturbance measures, we have assigned each individual to one of two categories based on whether they had ever or never experienced sleep disturbance after drinking coffee. This was due to the very small numbers of people who always or usually experienced sleep disturbance after drinking coffee in the evening. So that the assumptions made when performing the association test are not violated, the trait was dichotomized. This leads to a loss of power as individuals who experience more severe caffeine-induced insomnia may be enriched for risk alleles relative to those who experience only minor insomnia and this variance is lost. In addition, we are relying on self-report data for all of the variables analyzed. These data may be influenced by perceptual biases. It is known that people with insomnia often underestimate how much sleep they receive. To this end, studies of sleep loss often use polysomnography or actigraphy to get an objective measure of sleep loss. These methods provide greater accuracy of measurement, but they are much more time-consuming and less conducive to the large sample sizes required for GWAS. It is worth noting, however, that the association in ADORA2A that was initially discovered in a sample that used polysomnography to assess caffeine-induced insomnia was replicated in our sample that relied on self-report data on the same phenotype, which suggests that self-report data, while imperfect, is a somewhat reliable measure of the true phenotype and may be of particular use in large-scale genetic studies.
From the gene expression analysis, more than 600 genes that showed differential expression in each of three separate cell types were identified. All experiments were performed in triplicate, providing strong statistical support for the genes identified. On the basis that much of the genetic control of gene expression is by cis-acting elements, we tested to determine whether there was an enrichment of associations in SNPs in the differentially expressed genes. There is no evidence that these genes are enriched for associations; however, we have identified several genes and SNPs therein that show strong evidence for association. These genes represent good targets for replication in another sample. In addition, several of the top genes for both phenotypes show differential expression in at least two of the cell types, and so are good candidate genes for playing a role in caffeine sensitivity.
Analysis of gene expression data can give insight into the genetic underpinnings of phenotypic variation and, in the case of caffeine, the downstream changes in expression that occur are not well understood. The data analyzed here help to elucidate some of those changes. Understanding these changes in gene expression will aid in understanding the biologic pathways underlying sleep regulation in humans, and will have implications for insomnia and how it can be treated. The gene expression results should be interpreted with caution for reasons outlined elsewhere.25 However, the results from gene expression experiments can aid in the interpretation of results from GWAS studies by providing more evidence for a role for specific genes that show evidence of association with the phenotype of interest. This is particularly useful given that in many cases, the sample sizes required to detect genome-wide significant effects are not achievable.
Pathway analysis represents another method of analyzing GWAS data and can offer insights into the genetic architecture of phenotypes. Given that most of the variants found in GWAS so far have had a small effect on the phenotype, it is likely many genes of small effect account for most of the heritability of complex traits. Many of these variants could potentially be found in the same pathway, with minor disruptions in several points in a pathway adding up to a substantial contribution to the observed variance. One of the most significantly enriched pathways in the association analysis was nucleic acid metabolism, with many of the genes specifically involved in adenosine metabolism. This is not inconsistent with the hypothesized mode of action of caffeine in the brain, and the general pathways involved in sleep.
DISCLOSURE STATEMENT
This was not an industry supported study. Dr. Madden is largely supported by NIH grants. The other authors have indicated no financial conflicts of interest.
ACKNOWLEDGMENTS
The authors thank the twins and their families for their participation. They also thank Dixie Statham, Ann Eldridge, Marlene Grace, Kerrie McAloney, Lisa Bowdler, Steven Crooks, Peter Visscher and Naomi Wray. Funding was provided by the Australian National Health and Medical Research Council (241944, 339462, 389927, 389875, 389891, 389892, 389938, 442915, 442981, 496739, 552485, 552498, 613608), the Australian Research Council (A7960034, A79906588, A79801419, DP0770096, DP0212016, DP0343921), the FP-5 GenomEUtwin Project (QLG2-CT-2002-01254), and the U.S. National Institutes of Health (NIH grants AA07535, AA10248, AA13320, AA13321, AA13326, AA14041, MH66206). E.M.B is supported by the Australian National Health and Medical Research Council grant 613608. G.W.M, D.R.N and S.E.M. are supported by the National Health and Medical Research Council (NHMRC) Fellowship Scheme. A portion of the genotyping on which this study was based (Illumina 370K scans on 4300 individuals) was carried out at the Center for Inherited Disease Research, Baltimore (CIDR), through an access award to the authors’ late colleague Dr. Richard Todd (Psychiatry, Washington University School of Medicine, St Louis). Statistical analyses were carried out on the Genetic Cluster Computer, which is financially supported by the Netherlands Scientific Organization (NWO 480-05-003).
Footnotes
A commentary on this article appears in this issue on page 899.
REFERENCES
- 1.Fredholm BB, Battig K, Holmen J, Nehlig A, Zvartau EE. Actions of caffeine in the brain with special reference to factors that contribute to its widespread use. Pharmacol Rev. 1999;51:83–133. [PubMed] [Google Scholar]
- 2.Soroko S, Chang J, Barrett-Connor E. Reasons for changing caffeinated coffee consumption: the Rancho Bernardo Study. J Am Coll Nutr. 1996;15:97–101. doi: 10.1080/07315724.1996.10718571. [DOI] [PubMed] [Google Scholar]
- 3.Penetar D, McCann U, Thorne D, et al. Caffeine reversal of sleep deprivation effects on alertness and mood. Psychopharmacology (Berl) 1993;112:359–65. doi: 10.1007/BF02244933. [DOI] [PubMed] [Google Scholar]
- 4.Retey JV, Adam M, Khatami R, et al. A genetic variation in the adenosine A2A receptor gene (ADORA2A) contributes to individual sensitivity to caffeine effects on sleep. Clin Pharmacol Ther. 2007;81:692–8. doi: 10.1038/sj.clpt.6100102. [DOI] [PubMed] [Google Scholar]
- 5.Pantelios G, Lack L, James JE. Caffeine consumption and sleep. Sleep. 1989;18:65. [Google Scholar]
- 6.Higdon JV, Frei B. Coffee and health: a review of recent human research. Crit Rev Food Sci Nutr. 2006;46:101–23. doi: 10.1080/10408390500400009. [DOI] [PubMed] [Google Scholar]
- 7.Krul C, Hageman G. Analysis of urinary caffeine metabolites to assess biotransformation enzyme activities by reversed-phase high-performance liquid chromatography. J Chromatogr B Biomed Sci Appl. 1998;709:27–34. doi: 10.1016/s0378-4347(98)00016-4. [DOI] [PubMed] [Google Scholar]
- 8.Crews HM, Olivier L, Wilson LA. Urinary biomarkers for assessing dietary exposure to caffeine. Food Addit Contam. 2001;18:1075–87. doi: 10.1080/02652030110056630. [DOI] [PubMed] [Google Scholar]
- 9.Cornelis MC, El-Sohemy A, Campos H. Genetic polymorphism of the adenosine A2A receptor is associated with habitual caffeine consumption. Am J Clin Nutr. 2007;86:240–4. doi: 10.1093/ajcn/86.1.240. [DOI] [PubMed] [Google Scholar]
- 10.Retey JV, Adam M, Honegger E, et al. A functional genetic variation of adenosine deaminase affects the duration and intensity of deep sleep in humans. Proc Natl Acad Sci U S A. 2005;102:15676–81. doi: 10.1073/pnas.0505414102. [DOI] [PMC free article] [PubMed] [Google Scholar]
- 11.Retey JV, Adam M, Gottselig JM, et al. Adenosinergic mechanisms contribute to individual differences in sleep deprivation-induced changes in neurobehavioral function and brain rhythmic activity. J Neurosci. 2006;26:10472–9. doi: 10.1523/JNEUROSCI.1538-06.2006. [DOI] [PMC free article] [PubMed] [Google Scholar]
- 12.Luciano M, Zhu G, Kirk KM, et al. “No thanks, it keeps me awake”: the genetics of coffee-attributed sleep disturbance. Sleep. 2007;30:1378–86. doi: 10.1093/sleep/30.10.1378. [DOI] [PMC free article] [PubMed] [Google Scholar]
- 13.Huang ZL, Qu WM, Eguchi N, et al. Adenosine A2A, but not A1, receptors mediate the arousal effect of caffeine. Nat Neurosci. 2005;8:858–9. doi: 10.1038/nn1491. [DOI] [PubMed] [Google Scholar]
- 14.The Wellcome Trust Case-Control Consortium. Genome-wide association study of 14,000 cases of seven common diseases and 3,000 shared controls. Nature. 2007;447:661–78. doi: 10.1038/nature05911. [DOI] [PMC free article] [PubMed] [Google Scholar]
- 15.Heath AC, Kendler KS, Eaves LJ, Martin NG. Evidence for genetic influences on sleep disturbance and sleep pattern in twins. Sleep. 1990;13:318–35. doi: 10.1093/sleep/13.4.318. [DOI] [PubMed] [Google Scholar]
- 16.Heath AC, Eaves LJ, Kirk KM, Martin NG. Effects of lifestyle, personality, symptoms of anxiety and depression, and genetic predisposition on subjective sleep disturbance and sleep pattern. Twin Res. 1998;1:176–88. doi: 10.1375/136905298320566140. [DOI] [PubMed] [Google Scholar]
- 17.Medland SE, Nyholt DR, Painter JN, et al. Common variants in the trichohyalin gene are associated with straight hair in Europeans. Am J Hum Genet. 2009;85:750–5. doi: 10.1016/j.ajhg.2009.10.009. [DOI] [PMC free article] [PubMed] [Google Scholar]
- 18.Li Y, Willer C, Sanna S, Abecasis G. Genotype imputation. Annu Rev Genomics Hum Genet. 2009;10:387–406. doi: 10.1146/annurev.genom.9.081307.164242. [DOI] [PMC free article] [PubMed] [Google Scholar]
- 19.Zeger SL, Liang KY. Longitudinal data analysis for discrete and continuous outcomes. Biometrics. 1986;42:121–30. [PubMed] [Google Scholar]
- 20.Chen WM, Manichaikul A, Rich SS. A generalized family-based association test for dichotomous traits. Am J Hum Genet. 2009;85:364–76. doi: 10.1016/j.ajhg.2009.08.003. [DOI] [PMC free article] [PubMed] [Google Scholar]
- 21.Dudbridge F, Gusnanto A. Estimation of significance thresholds for genomewide association scans. Genet Epidemiol. 2008;32:227–34. doi: 10.1002/gepi.20297. [DOI] [PMC free article] [PubMed] [Google Scholar]
- 22.Ge D, Zhang K, Need AC, et al. WGAViewer: software for genomic annotation of whole genome association studies. Genome Res. 2008;18:640–3. doi: 10.1101/gr.071571.107. [DOI] [PMC free article] [PubMed] [Google Scholar]
- 23.Purcell S, Neale B, Todd-Brown K, et al. PLINK: a tool set for whole-genome association and population-based linkage analyses. Am J Hum Genet. 2007;81:559–75. doi: 10.1086/519795. [DOI] [PMC free article] [PubMed] [Google Scholar]
- 24.Liu JZ, McRae AF, Nyholt DR, et al. A versatile gene-based test for genome-wide association studies. Am J Hum Genet. 2010;87:139–45. doi: 10.1016/j.ajhg.2010.06.009. [DOI] [PMC free article] [PubMed] [Google Scholar]
- 25.Amin N, Byrne E, Johnson J, et al. Genome-wide association analysis of coffee drinking suggests association with CYP1A1/CYP1A2 and NRCAM. Mol Psychiatry. 2011 doi: 10.1038/mp.2011.101. [DOI] [PMC free article] [PubMed] [Google Scholar]
- 26.Smyth GK. Linear models and empirical bayes methods for assessing differential expression in microarray experiments. Stat Appl Genet Mol Biol. 2004;3 doi: 10.2202/1544-6115.1027. Article3. [DOI] [PubMed] [Google Scholar]
- 27.Perrier AL, Massoulie J, Krejci E. PRiMA: the membrane anchor of acetylcholinesterase in the brain. Neuron. 2002;33:275–85. doi: 10.1016/s0896-6273(01)00584-0. [DOI] [PubMed] [Google Scholar]
- 28.Xie HQ, Choi RC, Leung KW, Chen VP, Chu GK, Tsim KW. Transcriptional regulation of proline-rich membrane anchor (PRiMA) of globular form acetylcholinesterase in neuron: an inductive effect of neuron differentiation. Brain Res. 2009;1265:13–23. doi: 10.1016/j.brainres.2009.01.065. [DOI] [PubMed] [Google Scholar]
- 29.Du Puy L, Beqqali A, Monshouwer-Kloots J, Haagsman HP, Roelen BA, Passier R. CAZIP, a novel protein expressed in the developing heart and nervous system. Dev Dyn. 2009;238:2903–11. doi: 10.1002/dvdy.22107. [DOI] [PubMed] [Google Scholar]
- 30.He Y, Hryciw DH, Carroll ML, et al. The ubiquitin-protein ligase Nedd4-2 differentially interacts with and regulates members of the Tweety family of chloride ion channels. J Biol Chem. 2008;283:24000–10. doi: 10.1074/jbc.M803361200. [DOI] [PMC free article] [PubMed] [Google Scholar]
- 31.Hallows KR, Bhalla V, Oyster NM, et al. Phosphopeptide screen uncovers novel phosphorylation sites of Nedd4-2 that potentiate its inhibition of the epithelial Na+ channel. J Biol Chem. 2010;285:21671–8. doi: 10.1074/jbc.M109.084731. [DOI] [PMC free article] [PubMed] [Google Scholar]
- 32.Luo F, Wang Y, Wang X, Sun K, Zhou X, Hui R. A functional variant of NEDD4L is associated with hypertension, antihypertensive response, and orthostatic hypotension. Hypertension. 2009;54:796–801. doi: 10.1161/HYPERTENSIONAHA.109.135103. [DOI] [PubMed] [Google Scholar]
- 33.Vestal DJ. The guanylate-binding proteins (GBPs): proinflammatory cytokine-induced members of the dynamin superfamily with unique GTPase activity. J Interferon Cytokine Res. 2005;25:435–43. doi: 10.1089/jir.2005.25.435. [DOI] [PubMed] [Google Scholar]
- 34.Kreienkamp HJ, Zitzer H, Gundelfinger ED, Richter D, Bockers TM. The calcium-independent receptor for alpha-latrotoxin from human and rodent brains interacts with members of the ProSAP/SSTRIP/Shank family of multidomain proteins. J Biol Chem. 2000;275:32387–90. doi: 10.1074/jbc.C000490200. [DOI] [PubMed] [Google Scholar]
- 35.White GR, Varley JM, Heighway J. Isolation and characterization of a human homologue of the latrophilin gene from a region of 1p31.1 implicated in breast cancer. Oncogene. 1998;17:3513–9. doi: 10.1038/sj.onc.1202487. [DOI] [PubMed] [Google Scholar]
- 36.Allgayer H. Pdcd4, a colon cancer prognostic that is regulated by a microRNA. Crit Rev Oncol Hematol. 73:185–91. doi: 10.1016/j.critrevonc.2009.09.001. [DOI] [PubMed] [Google Scholar]
- 37.Wei NA, Liu SS, Leung TH, et al. Loss of programmed cell death 4 (Pdcd4) associates with the progression of ovarian cancer. Mol Cancer. 2009;8:70. doi: 10.1186/1476-4598-8-70. [DOI] [PMC free article] [PubMed] [Google Scholar]
- 38.Wade AG, Ford I, Crawford G, et al. Efficacy of prolonged release melatonin in insomnia patients aged 55-80 years: quality of sleep and next-day alertness outcomes. Curr Med Res Opin. 2007;23:2597–605. doi: 10.1185/030079907X233098. [DOI] [PubMed] [Google Scholar]
- 39.Bouatia-Naji N, Bonnefond A, Cavalcanti-Proenca C, et al. A variant near MTNR1B is associated with increased fasting plasma glucose levels and type 2 diabetes risk. Nat Genet. 2009;41:89–94. doi: 10.1038/ng.277. [DOI] [PubMed] [Google Scholar]
- 40.Ronn T, Wen J, Yang Z, et al. A common variant in MTNR1B, encoding melatonin receptor 1B, is associated with type 2 diabetes and fasting plasma glucose in Han Chinese individuals. Diabetologia. 2009;52:830–3. doi: 10.1007/s00125-009-1297-8. [DOI] [PubMed] [Google Scholar]