

Abstract
Objective:
To determine whether unobtrusive long-term in-home assessment of walking speed and its variability can distinguish those with mild cognitive impairment (MCI) from those with intact cognition.
Methods:
Walking speed was assessed using passive infrared sensors fixed in series on the ceiling of the homes of elderly individuals participating in the Intelligent Systems for Assessing Aging Change (ISAAC) cohort study. Latent trajectory models were used to analyze weekly mean speed and walking speed variability (coefficient of variation [COV]).
Results:
ISAAC participants living alone included 54 participants with intact cognition, 31 participants with nonamnestic MCI (naMCI), and 8 participants with amnestic MCI at baseline, with a mean follow-up of 2.6 ± 1.0 years. Trajectory models identified 3 distinct trajectories (fast, moderate, and slow) of mean weekly walking speed. Participants with naMCI were more likely to be in the slow speed group than in the fast (p = 0.01) or moderate (p = 0.04) speed groups. For COV, 4 distinct trajectories were identified: group 1, the highest baseline and increasing COV followed by a sharply declining COV; groups 2 and 3, relatively stable COV; and group 4, the lowest baseline and decreasing COV. Participants with naMCI were more likely to be members of either highest or lowest baseline COV groups (groups 1 or 4), possibly representing the trajectory of walking speed variability for early- and late-stage MCI, respectively.
Conclusion:
Walking speed and its daily variability may be an early marker of the development of MCI. These and other real-time measures of function may offer novel ways of detecting transition phases leading to dementia.
It is of substantial importance to detect dementia at its earliest phases to sustain independence, to optimize treatment, to understand preclinical biology, and to ultimately develop prevention strategies. Past studies have found that slower walking speed and poorer motor function are associated with mild cognitive impairment (MCI) and are predictors of progression to frank dementia.1–4 However, it is difficult to identify changes in these functions because changes evolve slowly over time and change measures have high test-to-test variability. Further, current methods for assessing this change rely largely on sparsely spaced or annual assessments that provide too few data points to discern subtle changes. An alternative to this approach is to deploy unobtrusive passive monitoring systems in people's homes, providing continuous assessment of daily activity and behaviors of interest. This kind of pervasive computing model has been established by the Intelligent Systems for Assessing Aging Change (ISAAC) study,5,6 to identify early signs of cognitive decline. We have previously shown that in-home walking speed and its short-term variability could distinguish those with MCI from those with intact cognition cross-sectionally7 in a few volunteers. In the current study, we examined whether longitudinal trajectories of walking speed and speed variability could differentiate participants with MCI defined at baseline from those who are cognitively intact throughout their follow-up, using data collected over 3 years in the homes of 85 independently living older participants. We hypothesized that participants with MCI would experience declining walking speed as well as changes in walking speed variability.
METHODS
Participants.
Participants were recruited from the Portland, Oregon, metropolitan area through advertisement and presentations at local retirement communities as part of the ISAAC longitudinal cohort study. Details of the study protocol are published elsewhere.5,6 In brief, entry criteria for the study included 1) age 70 or older, 2) independent living in a larger than one-room apartment, 3) Mini-Mental State Examination (MMSE) score >24 and Clinical Dementia Rating scale8 score ≤0.5, and 4) average health for age: Medical illnesses that would limit physical participation (e.g., wheelchair bound) or likely lead to untimely death (e.g., certain cancers) were exclusions. Enrollment began in March 2007 and continued on a rolling basis until September 2009 with a total of 265 participants. The participants lived in a variety of settings from apartments in organized retirement communities to free-standing single-family homes. For this analysis, of 108 participants living alone (the sample recruited for walking speed analyses), we excluded 14 individuals with incident MCI detected during the follow-up and one subject missing the Tinetti balance score, leaving 93 participants.
Standard protocol approvals, registrations, and patient consents.
Protocol and consent forms were approved by the Oregon Health & Science University Institutional Review Board. All participants provided written informed consent.
Clinical assessment procedures.
Participants were clinically assessed at baseline and during annual visits in their home using a standardized battery of tests consisting of physical and neurologic examinations.5 Participants were administered the MMSE, Geriatric Depression Scale,9 Functional Activities Questionnaire (FAQ),10 and motor portion of the Unified Parkinson's Disease Rating Scale (UPDRS).11 Balance was assessed by the Tinetti Performance-Oriented Assessment of Mobility (Tinneti balance).12 There have been many different scoring systems reported for this scale.13 By convention at our center, balance is measured on a scale of 0–26 with higher scores indicating better performance. Health status was assessed by the modified Cumulative Illness Rating Scale (CIRS).14
Cognitive status.
Diagnosis of MCI was made using the Petersen criteria15 operationalized as absence of dementia, intact functional activities (being able to conduct FAQ activities without any help in all but 2 or fewer FAQ items10), normal general cognitive function (MMSE score >24), and objective impairment on one or more of 6 neuropsychological tests considered to be representative of 5 cognitive domains: 1) memory, Logical Memory Delayed Recall16; 2) executive function, Category Fluency Animals17 or Trail Making B18; 3) attention, Wechsler Adult Intelligence Scale (WAIS) Digit Symbol19; 4) language, Boston Naming Test20; and 5) visuospatial function, WAIS-Revised Block Design.21 Amnestic MCI (aMCI) was defined as impairment in the memory domain with or without impairment in other domains. Nonamnestic MCI (naMCI) was defined as impairment in one or more nonmemory domains and no memory impairment. Impairment on neuropsychological testing was defined as a score of 1.5 SD or more below the predicted mean value for subject-specific age, sex, and educational levels, based on normative values generated in the past.22
Walking speed assessment.
Continuous activity data were collected using an unobtrusive activity assessment system by installing several types of motion and contact sensors in the home of each participant. Metrics assessed by the sensors include walking speed, total daily activity, and time out of home. The assessment of walking speed and its data validation process are described in detail elsewhere.6,23 In brief, motion sensors with a restricted field of view were installed along a hallway so they would detect only when a person passed directly under them. Data from all sensors were wirelessly received by a dedicated research computer placed in the subject's home and then were time-stamped and stored in a structured query language database. All data were automatically uploaded daily to a central database in the project data center. Walking events <20 or >160 cm/second were excluded as outliers (values greater than 2 SD from the mean of all walks). Participants reported via computer when overnight visitors were present. Days with overnight guests and days when staff visited the home were excluded as a part of our quality control protocol. Weekly walking speed was calculated by taking the median of all available walking speeds each day (meters per second) and then was averaged for each week (weekly mean) (figure e-1 on the Neurology® Web site at www.neurology.org). To assess the relative magnitude of walking speed variability, we calculated the weekly coefficient of variation (COV) of walking speed by using the weekly mean and its SD during each week (i.e., COV = [SD/weekly mean] × 100, unit free). Weekly walking speed and COV were log (base e)-transformed to address the skewed distributions in the analysis.
Data analysis.
Characteristics at baseline were compared between the cognitively intact participants and participants with MCI using the Student t test or the Wilcoxon rank sum test for continuous variables and the Pearson χ2 test and Fisher exact test for categorical variables. We examined whether there are distinct trajectory patterns of walking speed and its variability over time. SAS procedure PROC TRAJ24 was used for this data discovery process. This procedure combines 2 separate statistical models and estimates their parameters simultaneously using maximum likelihood estimates. The first model builds trajectories for the different latent groups as a function of time from baseline. Quadratic or cubic function of time are included if it improves the model fitness indicated by the Bayesian information criterion (BIC). The second builds a multinomial regression model that examines the associations of covariates (here baseline characteristics of the subject) with the probability of membership in the homogeneous latent groups. Examples of the application of this method to clinical outcomes were described previously.25,26 Covariates included in the trajectory models were age at baseline, sex, years of education, cognitive status, and Tinneti balance score. Other potential confounders (UPDRS, CIRS, body mass index, FAQ, and height) were not included in the final models because there were no differences in these values between the intact and MCI groups at baseline (described later). The BIC was used to identify the optimal number of homogeneous groups. Analyses were performed using SAS 9.2 (SAS Institute, Cary, NC).
RESULTS
Among 93 participants, the distribution of cognitively intact participants and participants with aMCI and naMCI was 54, 8, and 31, respectively. Their characteristics are given in table 1. Participants with aMCI and naMCI differed in in-home walking speed during the baseline week, suggesting that trajectories in walking speed between these 2 types of MCI are potentially different. Therefore, we did not combine the 2 types of MCI in the statistical analysis, but focused on naMCI, as this latter group had sufficient sample size.
Table 1.
Participant demographics and baseline clinical characteristicsa
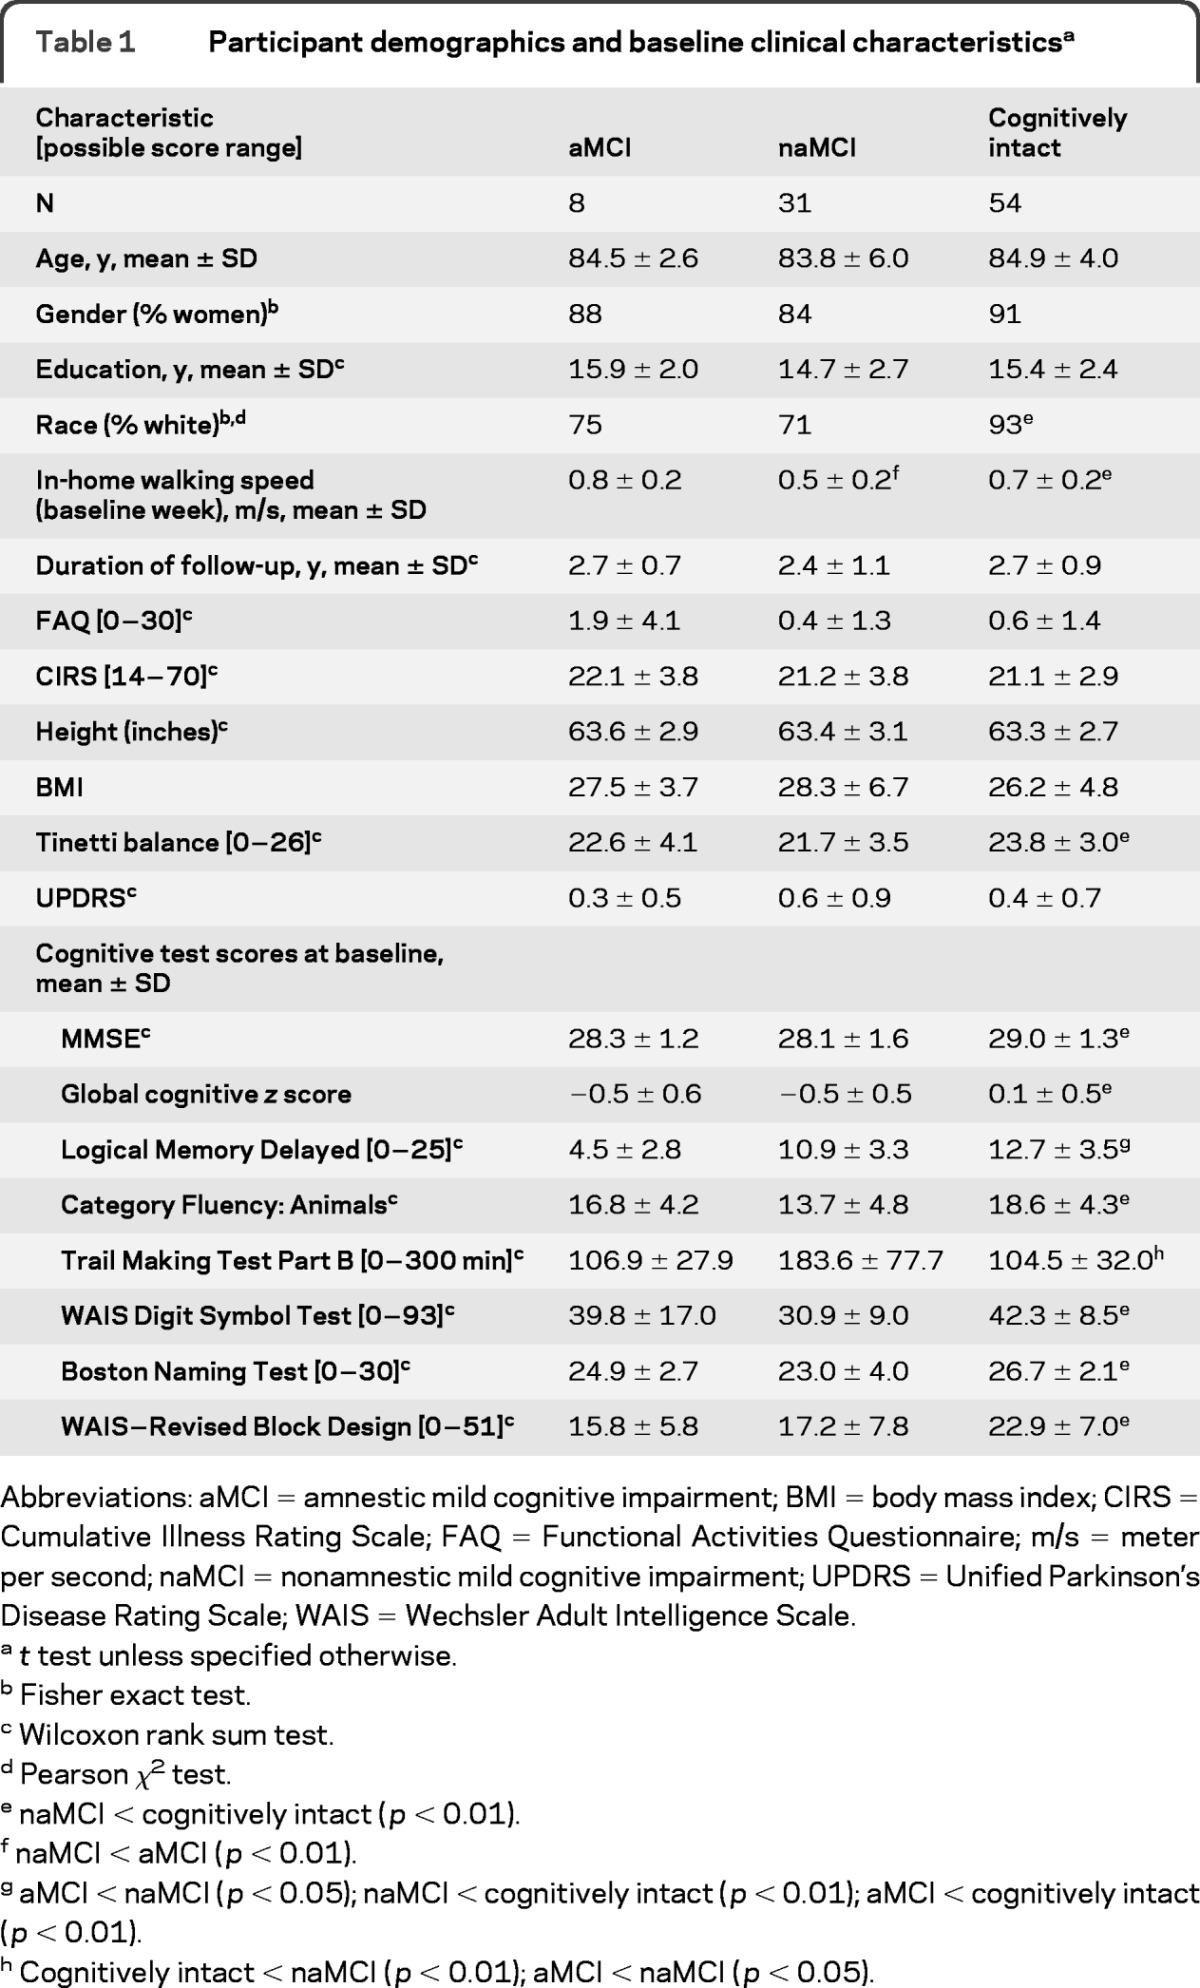
Abbreviations: aMCI = amnestic mild cognitive impairment; BMI = body mass index; CIRS = Cumulative Illness Rating Scale; FAQ = Functional Activities Questionnaire; m/s = meter per second; naMCI = nonamnestic mild cognitive impairment; UPDRS = Unified Parkinson's Disease Rating Scale; WAIS = Wechsler Adult Intelligence Scale.
t test unless specified otherwise.
Fisher exact test.
Wilcoxon rank sum test.
Pearson χ2test.
naMCI < cognitively intact (p < 0.01).
naMCI < aMCI (p < 0.01).
aMCI < naMCI (p < 0.05); naMCI < cognitively intact (p < 0.01); aMCI < cognitively intact (p < 0.01).
Cognitively intact < naMCI (p < 0.01); aMCI < naMCI (p < 0.05).
Participants with naMCI had lower (worse) Tinetti balance scores and slower mean in-home walking speeds during the baseline week compared with cognitively intact participants. As expected, all neuropsychological test scores were different between the cognitively intact participants and the participants with naMCI. CIRS, body mass index, UPDRS, FAQ scores, and height were not different between the 2 groups. By the third annual assessment, 2 participants were lost to follow-up and 4 participants were deceased (7.0%). These participants were included in the analyses using the available information until their drop out in the framework of mixed-effects latent trajectory models.
Trajectory analyses of walking speed.
Trajectory analyses identified 3 distinct groups of walking speed trajectories as the best model based on the BIC (figure 1A). The procedure calculates the probability of each participant belonging to each trajectory and identifies a participant as belonging to one trajectory based on the highest probability. Figure 1A shows the estimated trajectories, using the model-assigned group identification for each participant. Based on the shapes of walking speed trajectories, we named them fast, moderate, and slow walkers, respectively (trajectory lines from top to bottom in figure 1A). The figure shows that speed is relatively stable with a slight decline (i.e., getting slower) over time for the first 2 groups, but the slow walker group showed a steeper declining trend. Table 2 shows the association between baseline characteristics including MCI status and the 3 trajectories with the slow group as the reference, using multinomial logit models estimated jointly with the trajectory model. The table can be read as follows. For example, the odds of belonging to the fast group is reduced by approximately one-tenth (e−2.17 = 0.11) compared with the odds of belonging to the slow group if the participant has naMCI, after controlling for age, gender, education, and Tinneti balance scores (p = 0.01). In other words, the odds of belonging to the slow group is 9 times higher (1/e−2.17) if the participant has naMCI. Likewise, the odds of belonging to the slow group is approximately 5 times higher (1/e−1.69 = 5.4) compared with the odds of belonging to the moderate group if the participant has naMCI (p = 0.01). MCI status was the only significant covariate in the model. By using the model-assigned group identification for each participant based on the results in the multinomial logit model, the proportion of naMCI among the fast, moderate, and slow trajectories was found to be 16.7%, 34.6%, and 66.7%, respectively (Pearson χ2 test, p = 0.01), indicating that more than half of the slow walker trajectory was populated by participants with naMCI.
Figure 1. Trajectories of in-home walking speed and variability based on latent trajectory analyses.

(A) Trajectories of mean weekly walking speed. (B) Trajectories of coefficient of variation (COV) of weekly walking speed. CI = confidence interval.
Table 2.
Results of multinomial logit model showing the association between walking speed trajectories and baseline characteristics
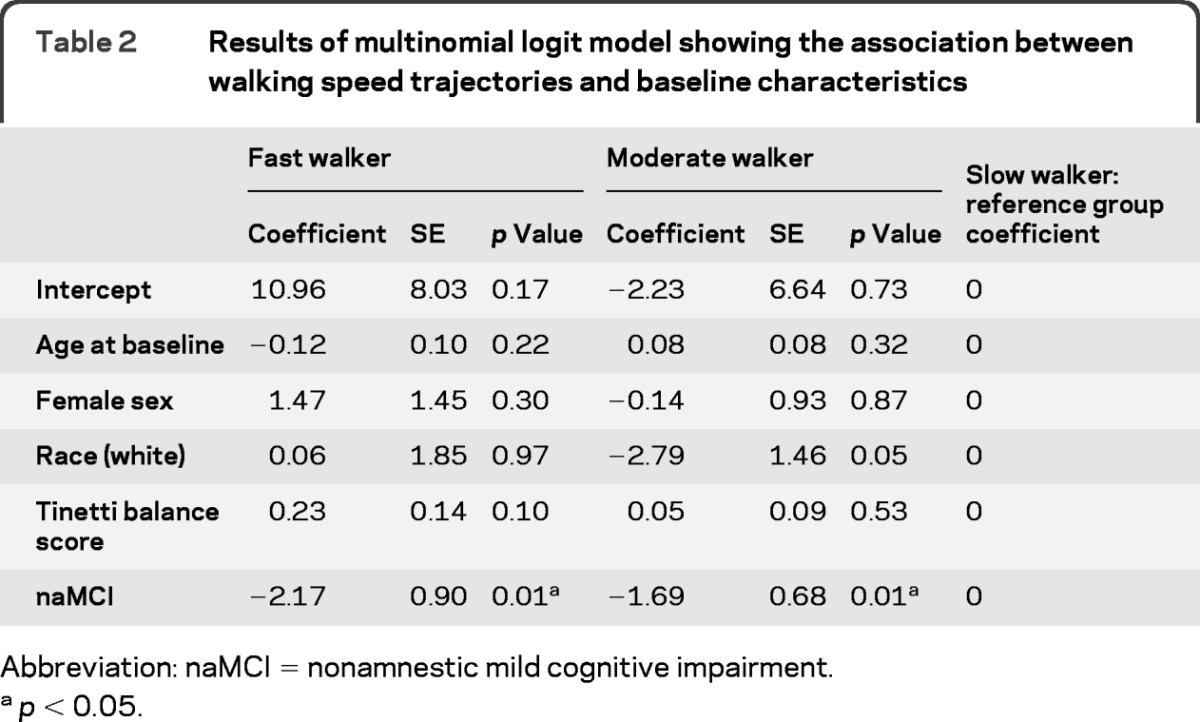
Abbreviation: naMCI = nonamnestic mild cognitive impairment.
p < 0.05.
Walking speed trajectories as depicted in figure 1A showed linear trajectories without any overlap. Therefore, as a post hoc analysis, we used mixed-effects models (random intercept) with an indicator variable of cognitive status (naMCI vs cognitively intact) and its interaction with time to estimate the average difference in the amount of decline between the 2 groups. The results are shown in table 3. Participants with naMCI showed additional decline in walking speed (m/second) by 0.0006 point (p < 0.0001) per week, meaning approximately 10% shorter m/second in 181 weeks (approximately 3.5 years) (e(−0.0006×181) = 0.90). For example, a baseline speed of 0.6 m/second means it takes 50 seconds to walk 30 m (30/0.6 = 50). Given that a cognitively intact participant would remain at this walking speed, the counterpart with MCI would take about 56 seconds to walk 30 m (30/0.54 = 55.6), i.e., requiring about 6 seconds longer to walk the same 30-m distance. Controlling for race and height did not change the result.
Table 3.
Mixed-effects models with outcome being log of mean weekly walking speed
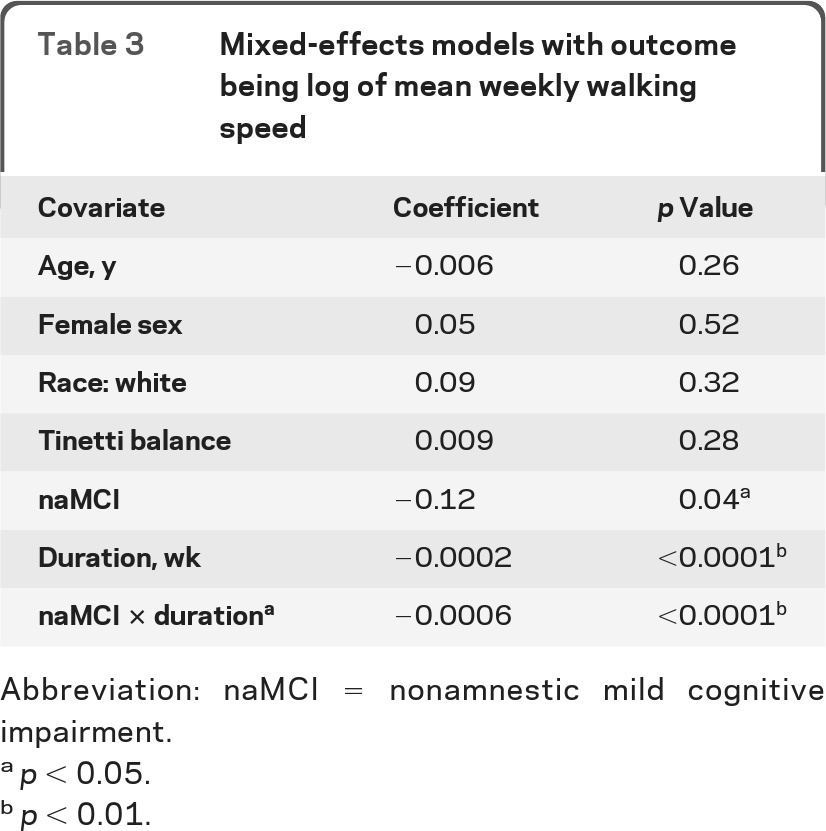
Abbreviation: naMCI = nonamnestic mild cognitive impairment.
p < 0.05.
p < 0.01.
Trajectory analysis of COV of walking speed.
The trajectory analysis identified 4 distinct trajectory groups of walking variability (COV) as the best model based on the BIC. Figure 1B shows the estimated trajectories. Group 1 can be characterized as having the highest COV at baseline followed by a further increase in COV and then sharply declining COV. Groups 2 and 3 were in the middle in COV at baseline, and their COV remained relatively stable with only a slight increase over time. Finally, group 4 started off with the lowest COV and experienced decreasing COV over time. The results of the association between baseline characteristics and the 4 trajectories based on multinomial logit models estimated jointly with the trajectory model are found in table e-1. The results showed that participants with naMCI were less likely to be in the groups with stable COV but were more likely to be in either the group with the highest (group 1) or the lowest COV at baseline (group 4). By using the predicted group assignment for each subject, the proportion of naMCI among each trajectory were found to be 53.3%, 33.3%, 16.7%, and 61.5% for groups 1, 2, 3, and 4, respectively (Pearson χ2 test, p = 0.02).
DISCUSSION
We describe for the first time trajectories of home-based daily walking speeds and their variability that are associated with naMCI over 3 years. Participants with naMCI were characterized by a slowing of walking speed. Furthermore, 2 distinct trajectories of COV (the highest and lowest variability) were found to be predominantly associated with naMCI.
Walking speed and other motor activities have previously been identified as differentiating those with MCI syndromes and cognitive decline or as predictors of progression to frank dementia.1–4 At least 1 study has suggested that gait changes predicting MCI may begin even decades before cognitive decline is clear.4 The longitudinal detection of these subtle changes that are not overtly disabling is challenging. Capturing multiple episodes of walking during the day can provide the opportunity to examine intraindividual variability in this measure, which may be sensitive to cognitive changes beyond absolute speed. Our results show that this appears to be the case.
Natural history of walking speed and its variability among participants with naMCI.
Participants with naMCI were predominantly found in 2 trajectory groups of walking speed variability: one characterized as having the highest COV at baseline followed by a further increase in COV and then sharply declining COV and another beginning with the lowest COV and experiencing decreasing COV over time. A higher proportion of participants with naMCI in the trajectory groups representing the opposite ends of the spectrum of change might suggest the general trajectories of clinical outcomes associated with various diseases. That is, biologic systems typically do not fail outfight, but initially demonstrate a period of increased variability as physiologic or functional reserve diminishes.27 Figure 2 illustrates the hypothetical model depicting this phenomenon: at the early stage of disease, subjects may begin to develop increasing variability in clinical outcomes such as day-by-day fluctuations in walking speed, balance, functional abilities, mood, or cognitive performance. This phase of increasing variability would be the result of physiologic or functional reserve trying to compensate for the dysfunction associated with the disease. However, once compensatory systems fail or pathologic burdens go beyond the level sustainable by reserve, the variability or short-term fluctuation diminishes because biologic systems lose their ability to preserve premorbid function.
Figure 2. Hypothetical trajectory of variability associated with disease progression.

Clinical markers may include walking speed, functional abilities, mood change, cognitive function, and others. The figure shows that biologic systems typically do not fail outfight but initially demonstrate a period of increased variability as physiologic or functional reserve diminishes. We hypothesize that this large fluctuation or variability typically happens during the early mild cognitive impairment (MCI) stage. Monitoring in-home activities unobtrusively and creating data with time intervals frequent enough to capture intraindividual variability such as day-by-day, week-by-week, or month-by-month fluctuations may assess this hypothesis and lead to early identification of future cognitive decline.
Given this theoretical model, group 1 depicted in figure 1B would be transiting the early disease stage (early MCI: high baseline variability with further increasing variability, followed by a decreasing variability), whereas group 4 would represent the later stage (late MCI: lowest baseline and declining variability). To shed light on this hypothesis, we examined whether the participants with naMCI in group 1 had better scores on cognitive tests (i.e., early MCI) than the participants with naMCI in group 4 (late MCI). We found that among all test scores, the participants with naMCI in group 1 scored better than those in group 4, although no scores were statistically significant, possibly due to small sample sizes (results shown in table e-2). The ability to assess the trajectory of change through the course of MCI requires longitudinal data and the ability to measure variability with sampling durations frequent enough to capture fluctuations. The home-based system we used afforded the opportunity to examine the trajectory of walking speed as well as the trajectory of its variability.
Potential mechanisms associating walking speed and cognitive function.
Past studies have suggested that walking is a complex cognitive and motor task and that loss of higher-order cognitive control of gait, posture, and balance is predictive of declines in attention, executive function,28–31 and memory performance.32 The pathologic substrate of these motor changes is unclear. Imaging studies have shown that slowing gait and parkinsonism are related to periventricular white matter changes.33,34 Increased total and periventricular white matter hyperintensity (WMH) burden and progression of periventricular WMH burden are associated with decreased gait performance over time, whereas progression of subcortical WMH volume is associated with memory decline in cognitively intact elderly individuals.35 In postmortem studies, motor dysfunction has been associated with the presence of neuronal loss36 or neurofibrillary tangles in the substantia nigra37 and amyloid plaques in the frontal lobes and basal ganglia.38,39 Therefore, it appears that deterioration in gait function probably involves more than one pathologic change.
Our study has several limitations. Because of the few participants with aMCI at baseline, we focused on naMCI in the trajectory analysis. Our study participants were not randomly selected from the community, but rather they were healthy volunteers living alone who were interested in studies that involve sensor technologies and in-home monitoring. This recruitment protocol may partially explain the low proportion of men and the few participants with aMCI compared with participants in some prevalence studies.40 Although we found a difference in decline in walking speed between naMCI and cognitively intact groups, further in-home studies will be required to translate this finding to clinically relevant ways of identifying those who may develop MCI prospectively. It would be of great interest to examine whether walking speed or its variability predicts the transition to MCI or frank dementia. We were unable to examine this issue because of the small number of participants who transitioned to MCI during follow-up. Continuous, unobtrusive home-based assessment of walking speed and its variability identified several trajectories of change in gait associated with naMCI. These and other real-time measures of function may offer novel ways of detecting transition phases leading to dementia.
Supplementary Material
GLOSSARY
- aMCI
amnestic mild cognitive impairment
- BIC
Bayesian information criteria
- CIRS
Cumulative Illness Rating Scale
- COV
coefficient of variation
- FAQ
Functional Activities Questionnaire
- ISAAC
Intelligent Systems for Assessing Aging Change
- MCI
mild cognitive impairment
- naMCI
nonamnestic mild cognitive impairment
- UPDRS
Unified Parkinson's Disease Rating Scale
- WAIS
Wechsler Adult Intelligence Scale
- WMH
white matter hyperintensity
Footnotes
Supplemental data at www.neurology.org
AUTHOR CONTRIBUTIONS
Dr. Dodge is the primary author on this manuscript. She had access to all the data, performed the statistical analysis and takes responsibility for the data and accuracy of the data analysis. She is responsible for the design and conceptualization of the study, data analysis, and interpretation of the result. Ms. Mattek contributed to the data analysis and performed the statistical analysis. She made a substantive contribution in revising the manuscript for intellectual content. Mr. Austin contributed to the data analysis and made a substantive contribution in revising the manuscript. Dr. Hayes made significant contributions in the interpretation of the results and revising the manuscript for intellectual content. Dr. Kaye assisted in the design and conceptualization of the study, data collection, and interpretation of the results. He made a substantive contribution in revising the manuscript for intellectual content.
DISCLOSURE
The authors report no disclosures relevant to the manuscript. Go to Neurology.org for full disclosures.
REFERENCES
- 1.Aggarwal NT, Wilson RS, Beck TL, Bienias JL, Bennett DA. Motor dysfunction in mild cognitive impairment and the risk of incident Alzheimer disease. Arch Neurol 2006; 63: 1763– 1769 [DOI] [PubMed] [Google Scholar]
- 2.Verghese J, Robbins M, Holtzer R, et al. Gait dysfunction in mild cognitive impairment syndromes. J Am Geriatr Soc 2008; 56: 1244– 1251 [DOI] [PMC free article] [PubMed] [Google Scholar]
- 3.Camicioli R, Howieson D, Oken B, Sexton G, Kaye J. Motor slowing precedes cognitive impairment in the oldest old. Neurology 1998; 50: 1496– 1498 [DOI] [PubMed] [Google Scholar]
- 4.Buracchio T, Dodge HH, Howieson D, Wasserman D, Kaye J. The trajectory of gait speed preceding mild cognitive impairment. Arch Neurol 2010; 67: 980– 986 [DOI] [PMC free article] [PubMed] [Google Scholar]
- 5.Kaye JA, Maxwell SA, Mattek N, et al. Intelligent systems for assessing aging changes: home-based, unobtrusive, and continuous assessment of aging. J Gerontol B Psychol Sci Soc Sci 2011; 66 (suppl 1): i180– i190 [DOI] [PMC free article] [PubMed] [Google Scholar]
- 6.Kaye J, Mattek N, Dodge H, et al. One walk a year to 1000 within a year: continuous in-home unobtrusive gait assessment of older adults. Gait Posture 2012; 35: 197– 202 [DOI] [PMC free article] [PubMed] [Google Scholar]
- 7.Hayes TL, Abendroth F, Adami A, Pavel M, Zitzelberger TA, Kaye JA. Unobtrusive assessment of activity patterns associated with mild cognitive impairment. Alzheimers Dement 2008; 4: 395– 405 [DOI] [PMC free article] [PubMed] [Google Scholar]
- 8.Morris JC. The Clinical Dementia Rating (CDR): current version and scoring rules. Neurology 1993; 43: 2412– 2414 [DOI] [PubMed] [Google Scholar]
- 9.Sheikh JI, Yesavage JA. Geriatric Depression Scale (GDS): recent evidence and development of a shorter version. In: Brink T.ed. Clinical Gerontology: A Guide to Assessment and Intervention. New York: The Haworth Press; 1986: 165− 173 [Google Scholar]
- 10.Pfeffer RI, Kurosaki TT, Harrah CH, Jr, Chance JM, Filos S. Measurement of functional activities in older adults in the community. J Gerontol 1982; 37: 323– 329 [DOI] [PubMed] [Google Scholar]
- 11.Fahn S. Unified Parkinson's Disease Rating Scale. In: Goldstein M, Calne DB.eds. Recent Developments in Parkinson's Disease, vol 2 Florham Park, NJ: Macmillan Healthcare Information; 1987: 153− 163 [Google Scholar]
- 12.Tinetti ME. Performance-oriented assessment of mobility problems in elderly patients. J Am Geriatr Soc 1986; 34: 119– 126 [DOI] [PubMed] [Google Scholar]
- 13.Kopke S, Meyer G. The Tinetti test: Babylon in geriatric assessment. Z Gerontol Geriatr 2006; 39: 288– 291 [DOI] [PubMed] [Google Scholar]
- 14.Parmelee PA, Thuras PD, Katz IR, Lawton MP. Validation of the Cumulative Illness Rating Scale in a geriatric residential population. J Am Geriatr Soc 1995; 43: 130– 137 [DOI] [PubMed] [Google Scholar]
- 15.Petersen RC, Morris JC. Mild cognitive impairment as a clinical entity and treatment target. Arch Neurol 2005; 62: 1160– 1163 [DOI] [PubMed] [Google Scholar]
- 16.Wechsler D. Wechsler Memory Scale−Revised. San Antonio, TX: The Psychological Corporation; 1987 [Google Scholar]
- 17.Lezak MD. Neuropsychological Assessment. New York: Oxford University Press; 1995 [Google Scholar]
- 18.Reitan RM, Wolfson D. The Halstead-Reitan Neuropsychological Test Battery. Tempe, AZ: Neuropsychology Press; 1985 [Google Scholar]
- 19.Wechsler D. Wechsler Memory Scale (WMS-III). San Antonio, TX: The Psychological Corporation; 1997 [Google Scholar]
- 20.Kaplan EF, Goodglass H, Weintraub S. The Boston Naming Test. Philadelphia: Lea & Febiger; 1983 [Google Scholar]
- 21.Wechsler D. Wechsler Adult Intelligence Scale−Revised Manual. New York: Psychological Corporation; 1981 [Google Scholar]
- 22.Weintraub S, Salmon D, Mercaldo N, et al. The Alzheimer's Disease Centers' Uniform Data Set (UDS): the neuropsychologic test battery. Alzheimer Dis Assoc Disord 2009; 23: 91– 101 [DOI] [PMC free article] [PubMed] [Google Scholar]
- 23.Hagler S, Austin D, Hayes TL, Kaye J, Pavel M. Unobtrusive and ubiquitous in-home monitoring: a methodology for continuous assessment of gait velocity in elders. IEEE Trans Biomed Eng 2010; 57: 813– 820 [DOI] [PMC free article] [PubMed] [Google Scholar]
- 24.Jones B, Nagin D, Roeder K. An SAS procedure based on mixture models for estimating developmental trajectories. Sociol Methods Res 2001; 29: 374– 393 [Google Scholar]
- 25.Dodge HH, Du Y, Saxton JA, Ganguli M. Cognitive domains and trajectories of functional independence in nondemented elderly persons. J Gerontol A Biol Sci Med Sci 2006; 61: 1330– 1337 [DOI] [PMC free article] [PubMed] [Google Scholar]
- 26.Dodge HH, Shen C, Ganguli M. Application of the pattern-mixture latent trajectory model in an epidemiological study with non-ignorable missingness. J Data Sci 2008; 6: 247– 259 [PMC free article] [PubMed] [Google Scholar]
- 27.MacDonald SW, Nyberg L, Backman L. Intra-individual variability in behavior: links to brain structure, neurotransmission and neuronal activity. Trends Neurosci 2006; 29: 474– 480 [DOI] [PubMed] [Google Scholar]
- 28.Camicioli R, Howieson D, Lehman S, Kaye J. Talking while walking: the effect of a dual task in aging and Alzheimer's disease. Neurology 1997; 48: 955– 958 [DOI] [PubMed] [Google Scholar]
- 29.Verghese J, Buschke H, Viola L, et al. Validity of divided attention tasks in predicting falls in older individuals: a preliminary study. J Am Geriatr Soc 2002; 50: 1572– 1576 [DOI] [PubMed] [Google Scholar]
- 30.Hausdorff JM, Doniger GM, Springer S, Yogev G, Simon ES, Giladi N. A common cognitive profile in elderly fallers and in patients with Parkinson's disease: the prominence of impaired executive function and attention. Exp Aging Res 2006; 32: 411– 429 [DOI] [PMC free article] [PubMed] [Google Scholar]
- 31.Verghese J, Lipton RB, Hall CB, Kuslansky G, Katz MJ, Buschke H. Abnormality of gait as a predictor of non-Alzheimer's dementia. N Engl J Med 2002; 347: 1761– 1768 [DOI] [PubMed] [Google Scholar]
- 32.Holtzer R, Verghese J, Xue X, Lipton RB. Cognitive processes related to gait velocity: results from the Einstein Aging Study. Neuropsychology 2006; 20: 215– 223 [DOI] [PubMed] [Google Scholar]
- 33.Benson RR, Guttmann CR, Wei X, et al. Older people with impaired mobility have specific loci of periventricular abnormality on MRI. Neurology 2002; 58: 48– 55 [DOI] [PubMed] [Google Scholar]
- 34.Onen F, Henry-Feugeas MC, Roy C, Baron G, Ravaud P. Mobility decline of unknown origin in mild cognitive impairment: an MRI-based clinical study of the pathogenesis. Brain Res 2008; 1222: 79– 86 [DOI] [PubMed] [Google Scholar]
- 35.Silbert LC, Nelson C, Howieson DB, Moore MM, Kaye JA. Impact of white matter hyperintensity volume progression on rate of cognitive and motor decline. Neurology 2008; 71: 108– 113 [DOI] [PMC free article] [PubMed] [Google Scholar]
- 36.Attems J, Quass M, Jellinger KA. Tau and α-synuclein brainstem pathology in Alzheimer disease: relation with extrapyramidal signs. Acta Neuropathol 2007; 113: 53– 62 [DOI] [PubMed] [Google Scholar]
- 37.Schneider JA, Li JL, Li Y, Wilson RS, Kordower JH, Bennett DA. Substantia nigra tangles are related to gait impairment in older persons. Ann Neurol 2006; 59: 166– 173 [DOI] [PubMed] [Google Scholar]
- 38.Gearing M, Levey AI, Mirra SS. Diffuse plaques in the striatum in Alzheimer disease (AD): relationship to the striatal mosaic and selected neuropeptide markers. J Neuropathol Exp Neurol 1997; 56: 1363– 1370 [DOI] [PubMed] [Google Scholar]
- 39.Suva D, Favre I, Kraftsik R, Esteban M, Lobrinus A, Miklossy J. Primary motor cortex involvement in Alzheimer disease. J Neuropathol Exp Neurol 1999; 58: 1125– 1134 [DOI] [PubMed] [Google Scholar]
- 40.Petersen RC, Roberts RO, Knopman DS, et al. Prevalence of mild cognitive impairment is higher in men: the Mayo Clinic Study of Aging. Neurology 2010; 75: 889– 897 [DOI] [PMC free article] [PubMed] [Google Scholar]
Associated Data
This section collects any data citations, data availability statements, or supplementary materials included in this article.