Abstract
We describe a new method for imaging leukocytes in vivo by exciting the endogenous protein fluorescence in the ultraviolet (UV) spectral region where tryptophan is the major fluorophore. Two-photon excitation near 590 nm allows noninvasive optical sectioning through the epidermal cell layers into the dermis of mouse skin, where leukocytes can be observed by video-rate microscopy to interact dynamically with the dermal vascular endothelium. Inflammation significantly enhances leukocyte rolling, adhesion, and tissue infiltration. After exiting the vasculature, leukocytes continue to move actively in tissue as observed by time-lapse microscopy, and are distinguishable from resident autofluorescent cells that are not motile. Because the new method alleviates the need to introduce exogenous labels, it is potentially applicable for tracking leukocytes and monitoring inflammatory cellular reactions in humans.
OCIS codes: (170.0170) Medical optics and biotechnology, (170.2520) Fluorescence microscopy, (180.4315) Nonlinear microscopy
1. Introduction
A unique feature of the immune system is the ability of leukocytes (white blood cells) to traffic to different tissue compartments under a broad range of physiologic and pathologic conditions [1]. Normal immune surveillance depends on the constant trafficking of leukocytes between blood and various organs in the body, whereas inflammatory conditions are characterized by heightened leukocyte rolling/adhesion to activated vascular endothelium and subsequent infiltration into tissue [2, 3]. Recent advances in intravital imaging techniques, particularly multiphoton microscopy (MPM) [4], together with advances in molecular probes and reporters for cell labeling, have made it possible to visualize these cellular processes in live animals as the immune response unfolds in real time [5, 6]. However, virtually all current fluorescence techniques to track leukocytes in vivo require cell tagging with exogenous fluorophores, and are therefore not readily translatable to studies in humans, since none of the existing fluorescent probes for labeling leukocytes are approved for human use. Reflectance confocal microscopy [7, 8], using backscattered light as contrast, does not require exogenous labeling and is able to visualize rolling and adherent leukocytes in human dermal blood vessels. However, when leukocytes migrate out of blood vessels, they are more difficult to image because many tissue components contribute to the backscattered signal leading to reduced contrast. Here we describe a method for noninvasive imaging of leukocytes in vivo using multiphoton-excited endogenous fluorescence, and demonstrate the ability to visualize leukocyte trafficking in the skin of live mice under normal and inflammatory conditions without exogenous labels.
Multiphoton microscopy with endogenous contrasts in biological tissues have primarily focused on detecting signals from the reduced nicotinamide adenine dinucleatide (NADH), its dinucleatide phosphate (NADPH), riboflavins, and pyridolamine cross-links in elastin and collagen [9]. All these fluorophores have emission in the wavelength range of 400-600 nm. Keratin also contributes to epidermal autofluorescence under one- and two-photon excitation [10]. However, detection of leukocyte endogenous signals has been conspicuously absent in all of the MPM studies of biological tissues reported to date [9, 11–14]. According to an early paper on the autofluorescence spectroscopy of ex vivo leukocyte samples under linear (one-photon) excitation conditions [15], signals from the tryptophan moieties in cellular proteins should be much stronger than signals from NAD(P)H on the per cell basis. We therefore turn to imaging tryptophan autofluorescence in this study, using femtosecond laser pulses at 590 nm (from a frequency-doubled optical parametric oscillator) for two-photon excitation of tryptophan, which has a broad linear (one-photon) absorption peak near 280 nm, and an emission spectrum centered at 350 nm. In this UV spectral region, tryptophan is the predominant fluorophore in tissue, because excitation of the other aromatic amino acid moieties (tyrosine and phenylalanine) is often quenched by fluorescence resonance energy transfer to tryptophan in the same protein [16]. Both two-photon and three-photon excitation spectra of tryptophan have been measured [17, 18]. Two- and three-photon imaging of serotonin, a neural transmitter synthesized from tryptophan, has also been reported [18, 19].
2. Materials and methods
2.1 Laser source
The schematic drawing of our two-photon microscope is shown in Fig. 1 . To generate femtosecond laser pulses at 590 nm for two-photon excitation of tryptophan, a mode-locked Ti:sapphire laser (Maitai-HP, wavelength 750 nm, 100 fs pulse width, 80 MHz repetition rate, Spectra-Physics, Santa Clara, CA) is used for pumping an optical parametric oscillator (OPAL, wavelength 1180 nm, 100 fs pulse width, Spectra-Physics, Santa Clara, CA). The output of the OPAL (350 mW at 1180 nm) is focused into a β-barium borate crystal (BBO 2 mm thick, CASIX USA, San Jose, CA) to generate 590 nm wavelength pulses with 60 mW power.
Fig. 1.
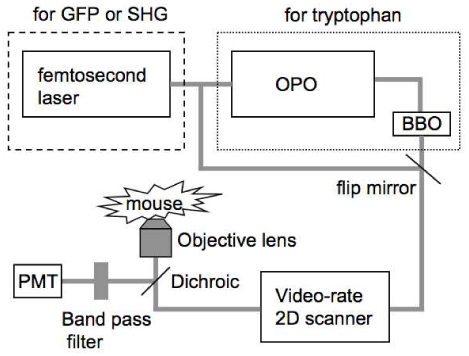
Schematic drawing of the video-rate nonlinear optical microscope
2.2 Microscope setup
The laser beam exiting the β-BBO crystal is collimated and deflected into a home-built video-rate (30 frames/second) x-y scanner (polygon, galvanometer). The beam passes through a dichroic beam splitter (FF510-Di01, Semrock, Rochester, NY) and is then focused onto the sample with a 60× , N.A.=1.2, water-immersion microscope objective lens (UPlanAPO, Olympus USA, Center Valley, PA). The laser power at the sample site is 10 mW. The fluorescence signal from the sample is epi-collected, deflected with the 510 nm long-pass dichroic mirror, transmitted through a 330-380 nm band-pass filter (FF01-357/44, Semrock, Rochester, NY). For comparison we also performed MPM imaging using NADH as the excited fluorophore. In the setup, the excitation light is provided directly by the Ti/sapphire laser (730nm) and the detection filter is a 420-480 nm bandpass filter (FF01-450/60, Semrock, Rochester, NY). The excitation power at sample is 20mW. Second harmonic generation microscopy is performed with the same setup except replacing the detection filter with a 330-380 nm band-pass filter (FF01-357/44, Semrock, Rochester, NY). We also performed MPM imaging FITC-dextran in BALB/c mice (Jackson Laboratory, Bar Harbor, ME). Again the excitation light is provided directly by the Ti/sapphire laser (970nm), while the dichroic beamsplitter is now a 665nm long pass one (FF665-Di02, Semrock, Rochester, NY) and the detection filter is a 505-555 nm bandpass filter (BP530/50, Chroma, Bellows Falls, VT). The fluorescent signal is detected by a photomultiplier tube (PMT) (R3896, Hamamatsu, Bridgewater, NJ) and the two-dimensional images in x-y plane are acquired by a frame grabber (Snapper-8/24 PCI, Active Silicon, Chelmsfor, MA) installed on a Macintosh personal computer. Each frame has 500×500 pixels. The imaging speed is 30 frames/sec and each static image is an average of 30 frames. Details of this microscope setup could be found in reference [20].
2.3 Preparation of cell samples
Erythrocytes (RBCs) and leukocytes (WBCs) were obtained from whole blood of healthy BALB/c mice. Leukocyte subpopulations (mononuclear cells and granulocytes) were isolated by Ficoll-Histopaque density gradient centrifugation. Cells were suspended in phosphate-buffered saline and imaged on glass slides.
2.4 Spectrum measurement
While measuring the two-photon excitation spectrum of tryptophan, we used cultured multiple myeloma cells (MM.1s, malignant B lymphocytes) supplied by Dr. Irene Ghobrial from Dana-Farber Cancer Institute, Harvard Medical School. The excitation power at the sample was kept at 2mW in the wavelength range of 570-600 nm and at 5mW in the wavelength range of 600-625 nm, respectively. The detection setup, e.g. PMT voltage, was unchanged. The fluorescence intensity of one single cell was quantified at 570-600 nm and 600-625 nm respectively. Each spectral region was normalized to the measurement at 600 nm in the corresponding scan. Then the two spectra were plotted together to make the full spectrum.
2.5 Animal experiments
For the animal imaging, BALB/c and C57BL/6 mice were imaged following administration of ketamine (100mg/Kg) and xylazine (15mg/Kg) anesthesia mixture. The mice were placed in a temperature controlled tube and the ear skin was flattened on a glass slide using Methocel gel 2%. Inflammation was induced by subcutaneous injection of 5µg lipopolysaccharide (LPS) locally in the BALB/c mouse ear pinna.
2.6 UV exposure
The UV-induced inflammation experiment was carried out on 8–10-week-old female C57BL/6 mice (Charles River Laboratories Inc, Wilmington, MA). UV radiation was provided by an UV-B Phototherapy Dermalight 80 device (Dr. Hoenle Medizintechnik, Germany), which contains two UV-emitting tubes (TL4W12, Philips, Einhoven, Netherlands). The irradiance was determined with a temperature- and wavelength-controlled Optronic 742 double-holographic grating spectroradiometer having a Teflon diffuser as input optics at 1 nm intervals from 250 to 400 nm. The average irradiance of the UV-B (280-320 nm) was 8.10 W/m2 and of UV-A (320-400 nm) 5.9 W/m2. Hair on the ears was shaven off 24 h before irradiation to allow UV irradiation reach of skin. Anesthetized C57BL/6 mice were exposed on one ear pinna with a single dose of UV radiation, consisting of 500 mJ/cm2 UV-B radiation and 358 mJ/cm2 UV-A radiation, corresponding 10 minutes irradiation time. The ear pinna was imaged for 3 hours afterwards. All procedures were approved by the Subcommittee on Research Animal Care of Massachusetts General Hospital (Protocol # 2006N000058 and 2009N000137).
2.7 Movie processing
Media 1 (2.1MB, MOV) and Media 2 (1.1MB, MOV) are movies recorded at video-rate (30 frames/second). Then we did moving-average (3 frames/window) to reduce the speckle noise. Media 3 (2.6MB, MOV) is a stack of 60 tryptophan fluorescence images with continuously increasing depth into mouse skin (1 µm/step). Each image is an average of 30 frames recorded at video-rate (30 frames/second). Each frame in media 4 was a static image. This static image is a 2D average projection of a stack of 20 z-dimensional images (1 µm/step). All the movie processing was done with ImageJ (http://rsbweb.nih.gov/ij/).
3. Results
3.1 In vivo mouse skin imaging
Figure 2 shows tryptophan autofluorescence images of the BALB/c mouse skin at different depths. Figure 2 (a) is taken at the surface of skin showing corneocytes and a hair shaft at the right bottom corner of the image. Figure 2 (b) is taken at a depth of 5 µm beneath the skin surface and shows the layer of flat stratum spinosum cells. The cell nuclei appear darker than the cytoplasm because the UV fluorescence signal comes primarily from the protein components of the cytoplasm [21]. Figure 2 (c) is an image taken 15 µm below the surface, near the dermal-epidermal junction, where the columnar basal cells are observed. The variation in the image brightness across the field is due to the fact that the basal layer is not flat, thus the focal plane in the darker areas is in the dermal layer. It has been reported that keratin fluoresces in the spectral range of 350 nm and above under two-photon excitation [10], therefore the UV fluorescence signal in epidermis may come from both tryptophan and keratin.
Fig. 2.
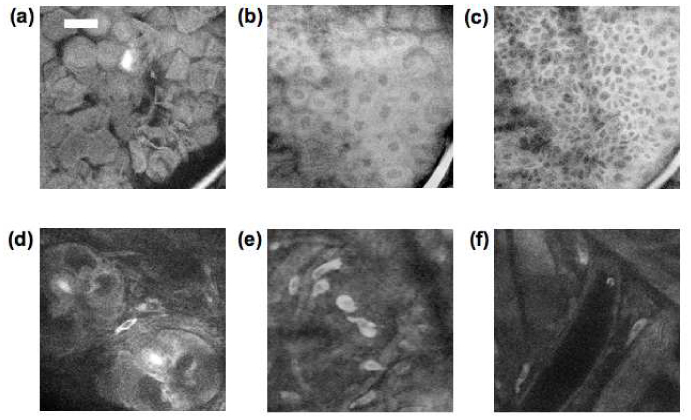
Tryptophan fluorescence images at a depth of 0, 5, 15, 30, 30, and 70 um (a-f) beneath the surface of mouse ear skin showing (a) corneocytes, (b) stratum spinosum, (c) basal cell layer, (d) hair follicles, (e) dermal cells, and (f) vascular structures. (scale bar 30 µm)
Below 30 µm deep we are imaging in the dermis. Features that are prominent in the dermis include hair follicles (round structure in Fig. 2 (d)), dermal cells (Fig. 2 (e)), and vascular structures characterized by low tryptophan signal with occasional bright cells moving inside (Fig. 2 (f)). Notably absent in these images are fibrous structures characteristic of collagen, the main protein of connective tissue that is abundant in the dermis. The amino acid content in collagen measured by the ion-exchange chromatographic method has shown no tryptophan in human bone and tendon collagen [22]. In order to further investigate if mouse skin collagen emits tryptophan fluorescence, we performed both MPM and second harmonic generation (SHG) microscopy on the same mouse skin area for comparison. Example tryptophan fluorescence and SHG images are shown in Fig. 3 (a)-(c) . The imaging plane is about 35 µm deep in the skin. The bright collagen fibers in Fig. 3 (b) correspond to the dark area in the tryptophan image as shown in Fig. 3 (a). This observation confirms that collagen in mouse skin does not contribute tryptophan fluorescence emission under two-photon excitation.
Fig. 3.
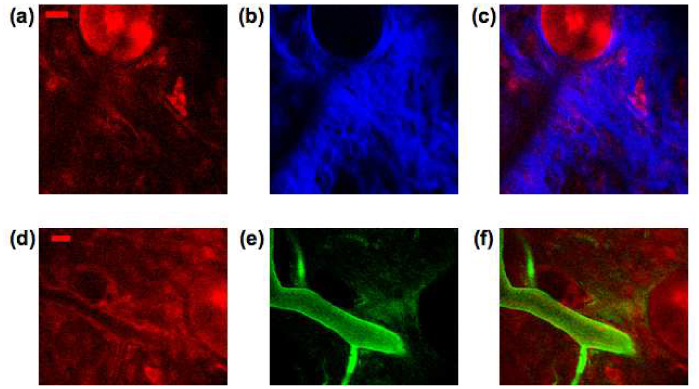
(a-c) Tryptophan fluorescence image (a), second harmonic generation image (b) and merged image (c) (red: tryptophan, blue: SHG. scale bar 20 µm). (d-f) Blood vessels at a depth of 50 µm visualized by tryptophan fluorescence image (d), FITC fluorescence image, (e), and merged image in (f) (red: tryptophan, green: FITC. scale bar 20 µm).
In order to verify that structures similar to that shown in Fig. 2 (f) are indeed blood vessels, we performed two-photon imaging of skin after intravenous injection of a vascular dye, FITC-dextran. Figure 3 (d)-(f) show identical fields taken with tryptophan autofluorescence (Fig. 3 (d)) and with FITC fluorescence (Fig. 3 (e)). Comparison of the tryptophan image (Fig. 3 (d)) with the FITC image (Fig. 3 (e)) lends support to the identification of these structures as dermal blood vessels. The vessel diameter in the FITC image appears larger than in the tryptophan image. The reason for this discrepancy is not clear and will require further investigation.
3.2 Leukocyte autofluorescence
It has been reported that leukocytes contribute to tryptophan fluorescence with one-photon excitation and the spectroscopic signal variation in different subpopulations can be distinguished [15]. Since leukocytes make up about 1% of the blood cells in the peripheral circulation, our observation of vascular structures that are low in tryptophan signal with occasional bright cells moving inside is consistent with these bright cells being leukocytes while the majority of blood cells are nonfluorescent erythrocytes (red blood cells). To verify this, we imaged a small drop of mouse blood on a glass slide. Figure 4 (a) shows both MPM (red) and confocal reflectance (green) images of mouse blood smears that were taken simultaneously. The majority of cells in the confocal image are erythrocytes and are not detected in the tryptophan channel. Tryptophan fluorescence in heme proteins is quenched by nearby heme moieties [23]. The lone bright cell in the image has a diameter of around 8 µm consistent with the size of a leukocyte. We further verified the autofluorescence of leukocytes by imaging purified granulocytes (neutrophils, eosinophils and basophils) and agranulocytes (lymphocytes and monocytes). As shown in Fig. 4 (b) and 4 (c), respectively, the polymorphonuclear structure of granulocytes and the mononuclear structure of agranulocytes are both visible in these images. Granulocyte fluorescence is uneven and this difference may be explained by the granule content variation in the different subpopulations of granulocytes [24]. We measured the two-photon excitation spectrum of tryptophan in leukocytes by scanning the wavelength from 570 nm to 625 nm (Fig. 4 (d)). This spectrum has similar features, e.g. a small peak at 580 nm and a dip around 575 nm, as the two-photon excitation spectrum of tryptophan in aqueous phosphate buffer in the same spectral range (red box in Fig. 4 (e)) [17]. Due to the limit of the wavelength range of our optical parametric oscillator, we were not able to scan the wavelength further down to the major peak of two-photon excitation spectrum of tryptophan, which is at 560 nm. For comparison we have also imaged leukocytes with MPM NADH fluorescence. Even at higher excitation power (20 mW for NADH vs. 10 mW for tryptophan, with identical detection arrangement except changing the bandpass filter) the NADH fluorescence was barely detectable. Based on published spectroscopic results, the (one-photon-excited) NADH fluorescence intensity level is almost 2 orders of magnitude lower than the tryptophan level per cell [15], which explains the difficulty to visualize leukocytes in tissue using MPM with NADH autofluorescence.
Fig. 4.
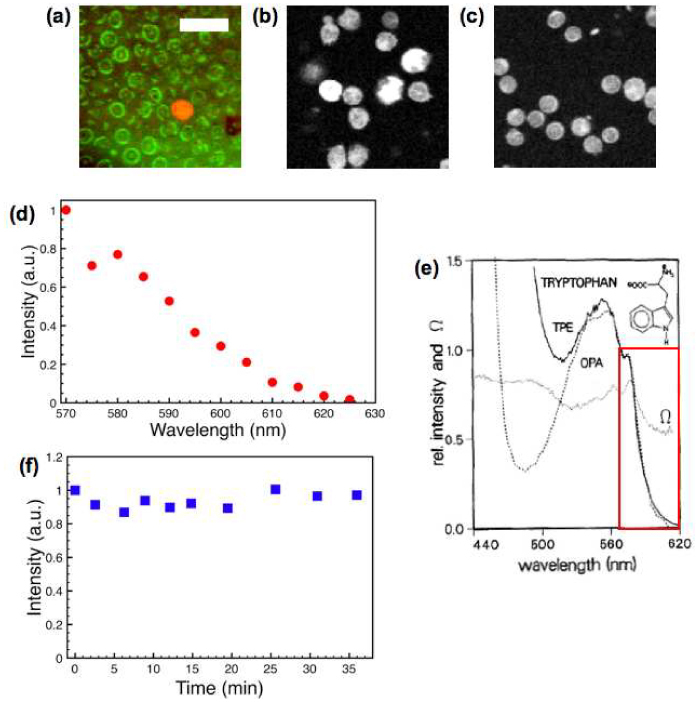
Tryptophan fluorescence images of leukocytes. (a) Confocal reflectance (green) and tryptophan fluorescence (red) images of mouse blood smear, (b) Tryptophan fluorescence image of isolated granulocytes, and (c) agranulocytes. (scale bar 20 µm). (d) Two-photon excitation spectrum of tryptophan in leukocytes. (e) Two-photon excitation spectrum of tryptophan (solid line) in phosphate buffer solution (reproduced with permission from [17]). (f) Tryptophan fluorescence intensity change of a dermal cell under continuous illumination.
In the normal skin, leukocytes constantly traffic to the skin at low levels as part of the immune surveillance mechanism. This trafficking process involves leukocyte tethering, rolling, arrest and transmigration through the endothelial walls into the tissue and is regulated by cytokines, and cell adhesion molecules (integrins and selectins) [25]. Whereas flowing leukocytes in the blood stream are moving too fast to image even with video-rate scanning, slow rolling cells can be observed interacting with the blood vessel walls ( Media 1 (2.1MB, MOV) , and Fig. 5 (a) ). In this movie, a leukocyte can be seen moving with a velocity of 20-30 µm/s. The field of view in this movie is 200 µm.
Fig. 5.
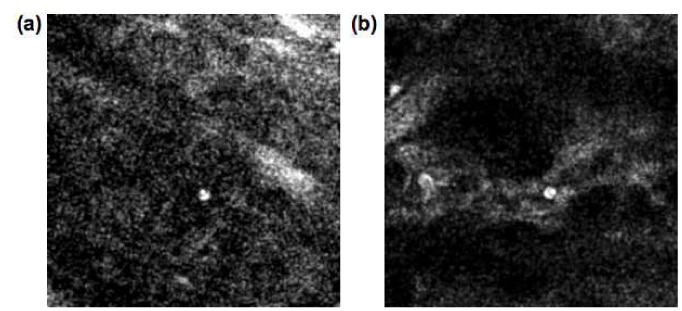
Single-frame excerpts from video recordings of leukocyte trafficking in skin vasculature. (a) Rolling leukocyte in normal BALB/c mouse skin ( Media 1 (2.1MB, MOV) ). (b) Slow rolling and arrest of leukocyte in inflamed skin ( Media 2 (1.1MB, MOV) ).
Both photobleaching and photodamage can be potential concerns for long-term cell tracking studies. We investigate the rate of photobleaching by continuous exposure of skin to the 590 nm femtosecond pulse train at 10 mW average power, our typical setting for imaging trypotophan in vivo. Figure 4 (f) shows that a dermal cell can be imaged continuously for 30 minutes with no appreciable photobleaching, consistent with the photostability of tryptophan in the protein environment (25). In addition, we did not observe enhanced leukocyte-endothelial interaction after continuous two-photon imaging, suggesting that the imaging modality by itself causes minimal damage to the skin as evidenced by the absence of inflammation (see below).
3.3 In vivo imaging of leukocyte trafficking
The trafficking of leukocytes is greatly enhanced during inflammation. Leukocyte recruitment out of blood vessels and into tissues is essential for both the development of an appropriate inflammatory response to injury or infection and the debilitating sequence of events leading to inflammatory disorders such as asthma and allergy. We first induced inflammation by subcutaneous injection of 5 µg of lipopolysaccharide (LPS) into the mouse ear pinna close to its base. LPS is a prototypical endotoxin that promotes the secretion of pro-inflammatory cytokines that help to recruit leukocytes. Figure 6 shows images taken immediately after (Fig. 6 (a)) and at 24 h post LPS injection (Fig. 6 (b)), both taken at a depth of about 50 µm below the skin surface. Whereas the first image shows no apparent change from normal skin, in the second image numerous leukocytes can be seen adhered to the vascular endothelium of the lower vein (white arrow). A real-time movie ( Media 2 (1.1MB, MOV) and Fig. 5 (b)) shows an example of very slow cell rolling (less than 10 µm/s) and arresting recorded 24-hour post LPS injection. Figure 6(c) was recorded at the same location as Fig. 6(b) with the depth about 30 µm below the skin surface. The red arrow points out infiltrated leukocytes in dermis.
Fig. 6.
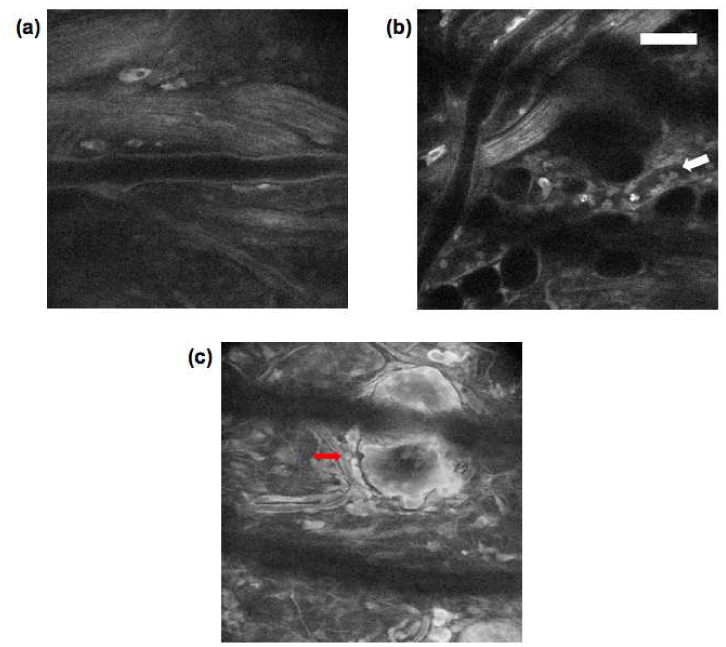
(a-c) Tryptophan fluorescence images of BALB/c mouse ear (a) 0-h, and (b & c) 24-h post LPS injection (scale bar 50 µm).
We also induced a mild degree of inflammation on C57BL/6 mice (pigmented) ear skin by exposing them to the UV radiation and imaged the mouse ear dermis every 10 minutes and continued for 2 hours after UV exposure. Figure 7 (a) , 7 (b) and 7 (c) are selected frames taken at 10, 60 and 120 minutes post UV exposure, and document the increase in the number of infiltrating leukocytes during this time period. The size of the cells (about 10 µm) and their polymorphonuclear structure indicate they are granulocytes. This finding agrees with previous histological findings that leukocyte infiltration occur within first hours after UV exposure [26]. Media 3 (2.6MB, MOV) (time span 36 minutes, Fig. 7 (d)) is a time-lapse movie of leukocytes that have infiltrated the skin that continue to exhibit active cell movement with an average in plane migration speed of a few µm/min, in the same range as the reported speed of lymphocyte movement in peripheral lymph nodes and bone marrow [6, 27]. Figure 7 (e) shows the trajectory (red line) of a leukocyte migrating interstitially.
Fig. 7.
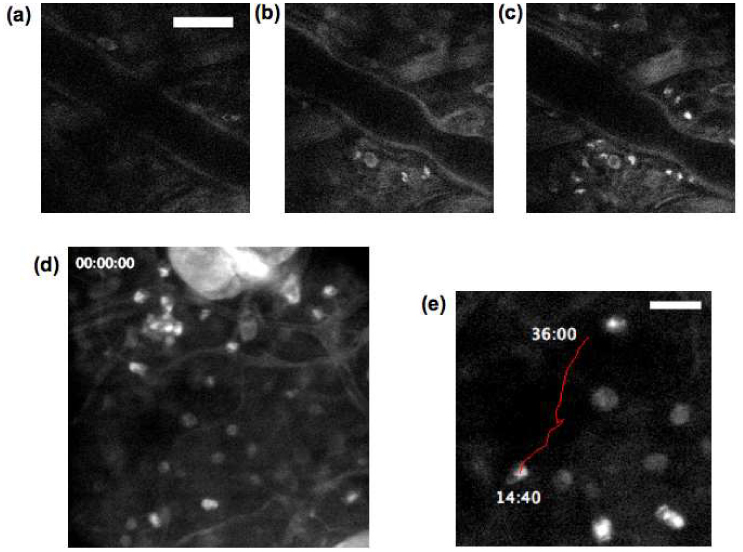
(a-c) Tryptophan fluorescence images of C57BL/6 mouse ear at (a) 10 mins, (b) 60 mins, and (c) 120 mins post UV exposure (scale bar 50 µm). (d) Single-frame excerpts from video recordings of leukocyte migration in skin tissue ( Media 3 (2.6MB, MOV) ). (e) Trajectory of the centroid of a migrating leukocyte at 80-second interval (scale bar 20 µm).
4. Discussion
In this study, we have demonstrated MPM imaging of mouse skin in vivo by exciting and detecting the endogenous cellular autofluorescence from tryptophan, which is not widely used as a fluorophore in fluorescence microscopy. Both epidermal and dermal cells are visualized by this new imaging method. Moreover, we have shown that leukocytes, critical cells of the immune system, can be imaged without having to label cells with exogenous fluorescent probes or reporters. Enhanced leukocyte trafficking to inflamed tissue can be imaged noninvasively over time, making this a potentially useful technique to track the inflammatory process longitudinally in the living host and even in humans. Intentional, prolonged exposure to 590 nm excitation pulses at the power level used here for imaging over 30 minutes did not cause appreciable photobleaching or photodamage to the skin. Tryptophan imaging can be combined with two-photon excited NADH and second harmonic microscopy to gain additional information such as cellular metabolism and interaction with the extracellular matrix elements [28].
In principle it should also be possible to excite tryptophan autofluorescence with simultaneous three-photon absorption in the laser wavelength range of 700-800 nm [18], a region that is more easily accessible with the current Ti:sapphire-based ultrashort pulse laser technology. However, we have not been able to obtain good signals with three-photon excitation in our system even with much higher available laser power. Although the 590 nm wavelength for two-photon excitation of tryptophan is difficult to generate at present requiring several frequency conversion steps, rapid advances in ultrafast laser technology (for example, nonlinear frequency generations in photonic crystal fibers [29]) can be expected to pave the way for a much simpler and more compact laser system for MPM at this wavelength. The absorption coefficient of hemoglobin drops off sharply around 590 nm (µa ~ 70 cm−1 for oxy-hemoglobin and ~140 cm−1 for deoxy-hemoglobin). Consequently it should be possible to image through dermal blood vessels up to ~100 µm in diameter. The emission of tryptophan is around 350 nm, which does not coincide with any major peaks of hemoglobin absorption (e.g. the Soret band in the range of 420-450 nm). Indeed the hemoglobin absorption coefficient at 350 nm is lower than that at 450 nm commonly used for NADH autofluorescence imaging of tissue. Currently we can observe leukocytes and dermal cells to a depth of about 70 µm beneath the mouse skin surface, but this depth may be limited by the poor beam quality coming out of the BBO crystal. This nonideal (elongated) beam will affect the point spread function at the focus, which is critical for two-photon excitation.
In traditional histopathology, disease diagnostics is made by examining static images from fixed tissue sections. Addition of dynamic information from real-time imaging may sharpen the diagnostic criteria when standard method of diagnosis is insufficient, for example in early identification of allergic and inflammatory responses, and acute graft versus host disease [30]. The latter is a potentially life-threatening condition that can develop after allogeneic bone marrow transplantation when donor leukocytes attack recipient's skin, gut, and other organs, a process that may be best discerned by monitoring leukocyte-endothelial interaction and leukocyte infiltration in the skin [8]. In addition, MPM of tryptophan may also be useful for detecting cellular changes in epithelial cancers. In vivo fluorescence spectroscopy of nonmelanoma skin cancers have shown that UV fluorescence from tryptophan is more intense in tumor than in normal tissue [31]. This can be explained by epidermal layer thickening or hyperproliferation. It has also been reported that cervical epithelial cancers cells have much higher level of tryptophan fluorescence compared with monocytes and neutrophils [15], suggesting a potential application of diagnosing epithelial cancers with MPM tryptophan fluorescence imaging. Finally, the uniform cytoplasmic signal in epithelial cells may facilitate the analysis of nuclear-to-cytoplasmic ratio, a parameter that is frequently used to characterize cancer transformation.
Acknowledgement
We thank Drs. R. Rox Anderson, Nikiforos Kollias and Paulo Bargo for insightful discussions about skin imaging. We also thank Dr. Irene Ghobrial for supplying cultured multiple myeloma cells. Our work was supported by grants from the National Institutes of Health ( CA111519-01), Johnson & Johnson Inc. (C. P. L.), Academy of Finland, and Jenny and Antti Wihuri Foundation (R. K. P.).
References and links
- 1.Germain R. N., Miller M. J., Dustin M. L., Nussenzweig M. C., “Dynamic imaging of the immune system: progress, pitfalls and promise,” Nat. Rev. Immunol. 6(7), 497–507 (2006). 10.1038/nri1884 [DOI] [PubMed] [Google Scholar]
- 2.Butcher E. C., Picker L. J., “Lymphocyte homing and homeostasis,” Science 272(5258), 60–67 (1996). 10.1126/science.272.5258.60 [DOI] [PubMed] [Google Scholar]
- 3.Luster A. D., Alon R., von Andrian U. H., “Immune cell migration in inflammation: present and future therapeutic targets,” Nat. Immunol. 6(12), 1182–1190 (2005). 10.1038/ni1275 [DOI] [PubMed] [Google Scholar]
- 4.Denk W., Strickler J. H., Webb W. W., “Two-photon laser scanning fluorescence microscopy,” Science 248(4951), 73–76 (1990). 10.1126/science.2321027 [DOI] [PubMed] [Google Scholar]
- 5.Sumen C., Mempel T. R., Mazo I. B., von Andrian U. H., “Intravital Microscopy: Visualizing Immunity in Context,” Immunity 21(3), 315–329 (2004). 10.1016/S1074-7613(04)00237-7 [DOI] [PubMed] [Google Scholar]
- 6.Cahalan M. D., Parker I., “Choreography of Cell Motility and Interaction Dynamics Imaged by Two-Photon Microscopy in Lymphoid Organs,” Annu. Rev. Immunol. 26(1), 585–626 (2008). 10.1146/annurev.immunol.24.021605.090620 [DOI] [PMC free article] [PubMed] [Google Scholar]
- 7.Rajadhyaksha M., González S., Zavislan J. M., Anderson R. R., Webb R. H., “In Vivo Confocal Scanning Laser Microscopy of Human Skin II: Advances in Instrumentation and Comparison With Histology,” J. Invest. Dermatol. 113(3), 293–303 (1999). 10.1046/j.1523-1747.1999.00690.x [DOI] [PubMed] [Google Scholar]
- 8.González S., Sackstein R., Anderson R. R., Rajadhyaksha M., “Real-Time Evidence of In Vivo Leukocyte Trafficking in Human Skin by Reflectance Confocal Microscopy,” J. Invest. Dermatol. 117(2), 384–386 (2001). 10.1046/j.0022-202x.2001.01420.x [DOI] [PubMed] [Google Scholar]
- 9.Zipfel W. R., Williams R. M., Christie R., Nikitin A. Y., Hyman B. T., Webb W. W., “Live tissue intrinsic emission microscopy using multiphoton-excited native fluorescence and second harmonic generation,” Proc. Natl. Acad. Sci. U.S.A. 100(12), 7075–7080 (2003). 10.1073/pnas.0832308100 [DOI] [PMC free article] [PubMed] [Google Scholar]
- 10.Pena A. M., Strupler M., Boulesteix T., Schanne-Klein M. C., “Spectroscopic analysis of keratin endogenous signal for skin multiphoton microscopy,” Opt. Express 13(16), 6268–6274 (2005), http://www.opticsinfobase.org/oe/abstract.cfm?uri=oe-13-16-6268 10.1364/OPEX.13.006268 [DOI] [PubMed] [Google Scholar]
- 11.Masters B., So P., “Confocal microscopy and multi-photon excitation microscopy of human skin in vivo,” Opt. Express 8(1), 2–10 (2001), http://www.opticsinfobase.org/oe/abstract.cfm?uri=oe-8-1-2 10.1364/OE.8.000002 [DOI] [PubMed] [Google Scholar]
- 12.Palero J. A., de Bruijn H. S., van der Ploeg van den Heuvel A., Sterenborg H. J. C. M., Gerritsen H. C., “Spectrally Resolved Multiphoton Imaging of In Vivo and Excised Mouse Skin Tissues,” Biophys. J. 93(3), 992–1007 (2007). 10.1529/biophysj.106.099457 [DOI] [PMC free article] [PubMed] [Google Scholar]
- 13.Skala M. C., Riching K. M., Gendron-Fitzpatrick A., Eickhoff J., Eliceiri K. W., White J. G., Ramanujam N., “In vivo multiphoton microscopy of NADH and FAD redox states, fluorescence lifetimes, and cellular morphology in precancerous epithelia,” Proc. Natl. Acad. Sci. U.S.A. 104(49), 19494–19499 (2007). 10.1073/pnas.0708425104 [DOI] [PMC free article] [PubMed] [Google Scholar]
- 14.Paoli J., Smedh M., Wennberg A.-M., Ericson M. B., “Multiphoton Laser Scanning Microscopy on Non-Melanoma Skin Cancer: Morphologic Features for Future Non-Invasive Diagnostics,” J. Invest. Dermatol. 128(5), 1248–1255 (2008). 10.1038/sj.jid.5701139 [DOI] [PubMed] [Google Scholar]
- 15.Heintzelman D. L., Lotan R., Richards-Kortum R. R., “Characterization of the Autofluorescence of Polymorphonuclear Leukocytes, Mononuclear Leukocytes and Cervical Epithelial Cancer Cells for Improved Spectroscopic Discrimination of Inflammation from Dysplasia,” Photochem. Photobiol. 71(3), 327–332 (2000). 10.1562/0031-8655(2000)0710327COTAOP2.0.CO2 [DOI] [PubMed] [Google Scholar]
- 16.J. R. Lakowicz, Principles of Fluorescence Spectroscopy 3rd ed. (Springer, New York, 2006). [Google Scholar]
- 17.Rehms A. A., Callis P. R., “Two-photon fluorescence excitation spectra of aromatic amino acids,” Chem. Phys. Lett. 208(3-4), 276–282 (1993). 10.1016/0009-2614(93)89075-S [DOI] [Google Scholar]
- 18.Maiti S., Shear J. B., Williams R. M., Zipfel W. R., Webb W. W., “Measuring Serotonin Distribution in Live Cells with Three-Photon Excitation,” Science 275(5299), 530–532 (1997). 10.1126/science.275.5299.530 [DOI] [PubMed] [Google Scholar]
- 19.Balaji J., Desai R., Maiti S., “Live cell ultraviolet microscopy: a comparison between two- and three-photon excitation,” Microsc. Res. Tech. 63(1), 67–71 (2004). 10.1002/jemt.10426 [DOI] [PubMed] [Google Scholar]
- 20.Veilleux I., Spencer J. A., Biss D. P., Côté D., Lin C. P., “In Vivo Cell Tracking With Video Rate Multimodality Laser Scanning Microscopy,” IEEE J. Sel. Top. Quantum Electron. 14, 10–18 (2008). 10.1109/JSTQE.2007.912751 [DOI] [Google Scholar]
- 21.Zeskind B. J., Jordan C. D., Timp W., Trapani L., Waller G., Horodincu V., Ehrlich D. J., Matsudaira P., “Nucleic acid and protein mass mapping by live-cell deep-ultraviolet microscopy,” Nat. Methods 4(7), 567–569 (2007). 10.1038/nmeth1053 [DOI] [PubMed] [Google Scholar]
- 22.Eastoe J. E., “The amino acid composition of mammalian collagen and gelatin,” Biochem. J. 61(4), 589–600 (1955). [DOI] [PMC free article] [PubMed] [Google Scholar]
- 23.Weber G., Teale F. J. W., “Electronic energy transfer in haem proteins,” Discuss. Faraday Soc. 27, 134–141 (1959). 10.1039/df9592700134 [DOI] [Google Scholar]
- 24.Abu-Ghazaleh R. I., Dunnette S. L., Loegering D. A., Checkel J. L., Kita H., Thomas L. L., Gleich G. J., “Eosinophil granule proteins in peripheral blood granulocytes,” J. Leukoc. Biol. 52(6), 611–618 (1992). [DOI] [PubMed] [Google Scholar]
- 25.Ley K., Laudanna C., Cybulsky M. I., Nourshargh S., “Getting to the site of inflammation: the leukocyte adhesion cascade updated,” Nat. Rev. Immunol. 7(9), 678–689 (2007). 10.1038/nri2156 [DOI] [PubMed] [Google Scholar]
- 26.Clydesdale G. J., Dandie G. W., Muller H. K., “Ultraviolet light induced injury: Immunological and inflammatory effects,” Immunol. Cell Biol. 79(6), 547–568 (2001). 10.1046/j.1440-1711.2001.01047.x [DOI] [PubMed] [Google Scholar]
- 27.Junt T., Schulze H., Chen Z., Massberg S., Goerge T., Krueger A., Wagner D. D., Graf T., Italiano J. E., Jr, Shivdasani R. A., von Andrian U. H., “Dynamic Visualization of Thrombopoiesis Within Bone Marrow,” Science 317(5845), 1767–1770 (2007). 10.1126/science.1146304 [DOI] [PubMed] [Google Scholar]
- 28.Friedl P., Weigelin B., “Interstitial leukocyte migration and immune function,” Nat. Immunol. 9(9), 960–969 (2008). 10.1038/ni.f.212 [DOI] [PubMed] [Google Scholar]
- 29.Palero J., Boer V., Vijverberg J., Gerritsen H., Sterenborg H. J. C. M., “Short-wavelength two-photon excitation fluorescence microscopy of tryptophan with a photonic crystal fiber based light source,” Opt. Express 13(14), 5363–5368 (2005), http://www.opticsinfobase.org/oe/abstract.cfm?uri=oe-13-14-5363 10.1364/OPEX.13.005363 [DOI] [PubMed] [Google Scholar]
- 30.Sackstein R., “Lymphocyte Migration Following Bone Marrow Transplantation,” Ann. N. Y. Acad. Sci. 770(1 Bone Marrow T), 177–188 (1995). 10.1111/j.1749-6632.1995.tb31054.x [DOI] [PubMed] [Google Scholar]
- 31.Brancaleon L., Durkin A. J., Tu J. H., Menaker G., Fallon J. D., Kollias N., “In vivo Fluorescence Spectroscopy of Nonmelanoma Skin Cancer,” Photochem. Photobiol. 73(2), 178–183 (2001). [DOI] [PubMed] [Google Scholar]


