Abstract
Major advances in high-throughput, high-resolution, 3D microscopy techniques have enabled the acquisition of large volumes of neuroanatomical data at submicrometer resolution. One of the first such instruments producing whole-brain-scale data is the Knife-Edge Scanning Microscope (KESM)7, 5, 9, developed and hosted in the authors' lab. KESM has been used to section and image whole mouse brains at submicrometer resolution, revealing the intricate details of the neuronal networks (Golgi)1, 4, 8, vascular networks (India ink)1, 4, and cell body distribution (Nissl)3. The use of KESM is not restricted to the mouse nor the brain. We have successfully imaged the octopus brain6, mouse lung, and rat brain. We are currently working on whole zebra fish embryos. Data like these can greatly contribute to connectomics research10; to microcirculation and hemodynamic research; and to stereology research by providing an exact ground-truth.
In this article, we will describe the pipeline, including specimen preparation (fixing, staining, and embedding), KESM configuration and setup, sectioning and imaging with the KESM, image processing, data preparation, and data visualization and analysis. The emphasis will be on specimen preparation and visualization/analysis of obtained KESM data. We expect the detailed protocol presented in this article to help broaden the access to KESM and increase its utilization.
Keywords: Bioengineering, Issue 58, Physical sectioning, serial sectioning, light microscopy, brain imaging, microtome
Protocol
1. Specimen preparation: Golgi-Cox
This protocol closely follows the protocol of Mayerich et al.7.
The C57BL/6J mouse is deeply anesthetized using isoflurane inhalant anesthesia and then decapitated.
The brain is removed and placed into a Golgi-Cox fixation solution (1% potassium chromate, 1% potassium dichromate, and 1% mercuric chloride in deionized water).
The brain is left in the Golgi-Cox solution in the dark, at room temperature, for 10 to 16 weeks.
The brains are rinsed in deionized water overnight in the dark.
The rinsed brain is immersed in 5% ammonium hydroxide solution in deionized water for 7 to 10 days in the dark at room temperature. This lengthy preparation time was to ensure infiltration of the entire brain, so that the black precipitate had a chance to completely form in the tissue.
The brain is rinsed again in deionized water at room temperature for 4 hours and then dehydrated through a graded series of ethyl alcohols: 50% and 70% in the refrigerator (4 °C), and 85%, 95% (3 changes), and 100% (4 to 5 changes) in room temperature. The brain is left in each solution for 24 hours.
The dehydrated brain is then put in acetone (3 to 4 changes, each for one day), followed by an araldite-acetone mixture with araldite-to-acetone ratio of 1:2, 1:1, 2:1, and finally in 100% araldite (3 changes, each time overnight), in the refrigerator (4 °C).
Finally, the treated brain is embedded in 100% araldite and heated to 60 °C for 3 days (cf. embedding protocol in Abbott and Sotelo2). If specimens are embedded in LR White then the specimens are transferred from the last 100% ethanol solution through three changes of LR White solution that are each kept in the refrigerator overnight, which is a standard procedure prior to polymerization. Three changes are done to ensure full infiltration. The specimen is then transferred to fresh LR White that is polymerized in a closed container at 60 °C for 24 hours, which is the required amount of time and temperature for proper polymerization.
Fig. 1 shows a Golgi-Cox stained brain embedded in Araldite.
The cured specimen block is then mounted on the metal specimen ring using epoxy, and the sides of the block trimmed as necessary (see Fig. 2).
2. Specimen preparation: Nissl
This protocol closely follows the protocol of Mayerich et al.7
The mouse is deeply anaesthetized using ketamine and xylazine injected intraperitoneally and then perfused transcardially using 50 mL of room temperature phosphate-buffered saline (pH 7.4), followed by 250 mL of cold 4% phosphate-buffered paraformaldehyde (pH 7.4).
The mouse is then perfused with 100 mL of a solution of 0.1% thionin dye in deionized water, and the body placed in the refrigerator (4 °C) for 24 hours.
After 24 hours, the brain is removed from the calvaria and placed in a fresh solution of 0.1% thionin and left at 4 °C for 7 days. The lengthy duration of this procedure was to ensure full infiltration of thionin into the en bloc preparation.
The brain is then destained and dehydrated through a graded series of ethanols starting with 50% ethanol and water and increasing to 100% ethanol over a time period of 6 weeks. The ethanol changes from 50% to 70% are stored in the refrigerator (4 °C) and all changes of ethanol above 70% are stored at room temperature.
After three changes of acetone (2-4 days in each solution at room temperature), the brain is then embedded in araldite plastic following the protocol in 1.8-1.9 above. If LR white is the embedding medium then the protocol in 1.10 above is followed.
3. Specimen preparation: India ink
The mouse is deeply anaesthetized using ketamine and xylazine (1.7 mg ketamine / 0.26 mg xylazine per 20 grams body weight) injected intraperitoneally and then perfused transcardially using 50 mL of room temperature phosphate-buffered saline (pH 7.4), followed by 250 mL of room temperature 10% neutral buffered formalin (pH 7.4). and finally with 3.0 cc of undiluted India ink.
Whole body perfusion with saline and fixative is necessary to clear the blood from the cardiovascular system and to fix the tissues. Perfusion with India ink is necessary to completely fill the vasculature of the cardiovascular system.
The resulting brain is then dehydrated through a series of graded ethyl alcohols (25%-100%) and then embedded in araldite plastic following the protocol in 1.8-1.9 above. If LR white is the embedding medium then the protocol in 1.10 above is followed.
4. Specimen preparation: Generic species, generic organs
For the generic case, fixation can be done with either 10% neutral buffered formalin or 4% paraformaldehyde.
For small tissue volumes, diffusion instead of perfusion is recommended for fixation and staining. In the case of small organisms or organs, staining also can be done during the dehydration process.
The embedding protocol is the same as above, although the times for solution infiltration can be reduced for organs or organisms that are much smaller than whole mouse brain.
5. KESM setup and imaging
Turn off pump, turn on stage, turn on camera, turn on illuminator.
Raise knife and objective.
Install specimen ring.
Measure specimen dimension and create a configuration file for the KESM Stage Controller2 application.
Start KESM Stage Controller2 and initialize stage.
Lower knife/objective, turn on pump.
Focus objective and camera, by turning the focusing knob on the optical train and adjusting the camera's field of view relative to the knife edge.
Press on [Go] to initiate imaging.
See Figs. 3-8. See 9, 7 for technical details.
6. Image processing and data preparation
Copy the KESM Stack Processor executable into the data folder under the configuration file folder (00000, 00001, etc.).
Run the KESM Stack Processor to remove lighting artifact and normalize the background intensity in all images. Repeat for all data subfolders.
Prepare multiscale tiles from the data set and upload and set up the files in the KESM Brain Atlas web server.
See Fig. 9.
7. Data visualization and analysis
- Visualization using the KESM Brain Atlas. Go to http://kesm.cs.tamu.edu and select the appropriate atlas.
- Navigate as in Google maps.
- Zoom in and out as in Google maps.
- To go to a different depth, select how deep to go at each step from the pull-down menu, and then click on either [+] or [-] to increase or decrease z depth.
- Adjust the overlay number by using the pull-down menu.
- Adjust the overlay interval by using the pull-down menu.
- See Fig. 11.
- Visualization using MeVisLab.
- Launch MeVisLab.
- Create a new project.
- In the following, new modules can be creating by typing in the module name in the command box.
- Create module [Compose3Dfrom2DFiles], and go to the desired folder. Enter file string and click in [GetFileList]. Make sure the selected images can fit in memory. Click [Create3D] to create volume.
- Create module [SetWorldMatrix], and set the "Scale" under "Elementary Transforms" x, y, z to the appropriate voxel size (0.6, 0.7, 1.0 for a 10X 0.45NA objective). Link [Compose3Dfrom2DFiles] to [SetWorldMatrix].
- Set Matrix and Transforms under "Matrix Composition" to "Ignore", "Ignore", "Forward".
- Create module [Arithmetic1] and set the "Function" to "Invert(Max-Img)". Link [SetWorldMatrix] to [Arithmetic1].
- Create module [View3D] and connect [Arithmetic1].
- In View3D, while right mouse button is pressed, move the mouse around to adjust the threshold. You can crop regions, change orientation (move mouse while left mouse button is pressed), change illumination (volume rendering or MIP), turn on/off background, etc.
- See Fig. 10.
8. Representative Results:
Here, we present whole-brain data and details. Figs. 12-15 show whole-brain India Ink, Golgi, and Nissl data sets 1, 4, 3.
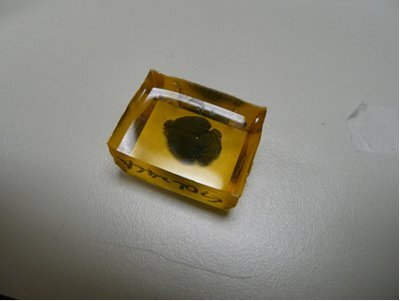 Figure 1. Fixed, stained, and embedded mouse brain
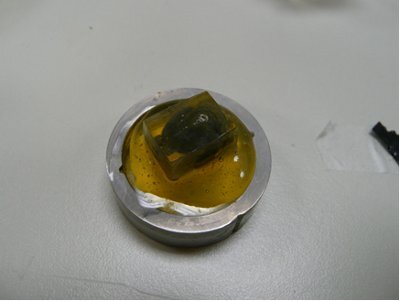 Figure 2. Embedded mouse brain specimen mounted on the specimen ring.
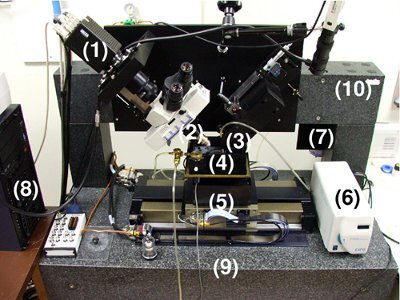 Figure 3. The Knife Edge Scanning Microscope (KESM). A photo of the KESM is shown with its major components marked: (1) high-speed line-scan camera, (2) microscope objective, (3) diamond knife assembly and light collimator, (4) specimen tank (for water immersion imaging), (5) three-axis precision air-bearing stage, (6) white-light microscope illuminator, (7) water pump (in the back) for the removal of sectioned tissue, (8) PC server for stage control and image acquisition, (9) granite base, and (10) granite bridge.
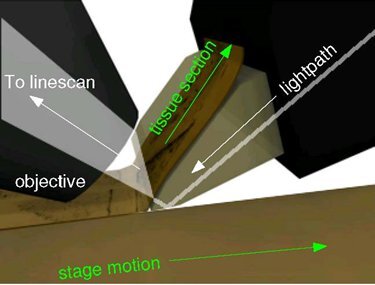 Figure 4. Imaging principles of the KESM. The principal of operation of KESM is illustrated. The objective and the knife is held in place, while the specimen affixed on the positioning stage moves (arrow with solid line) at the resolution of 20 nm and travel speed of 1-5, and gets scraped against the diamond knife (5 mm wide for 10X objective), generating a thin section flowing over the knife (arrow with solid line). Line-scan imaging is done near the very tip of the knife.
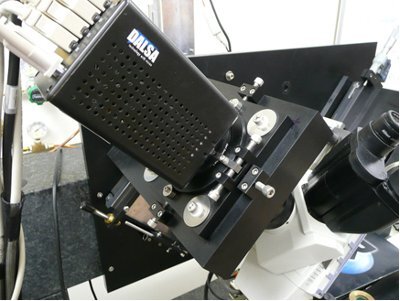 Figure 5. KESM camera and objective focusing controls.
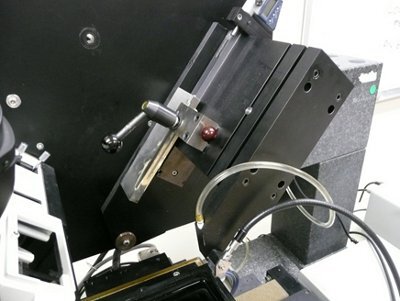 Figure 6. KESM knife assembly and controls.
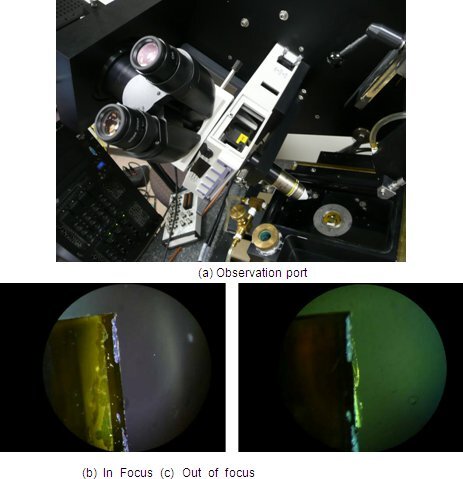 Figure 7. Initial focusing through the observation port.
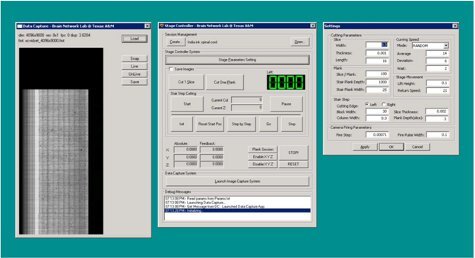 Figure 8. KESM Stage Controller 2 application (screenshot).
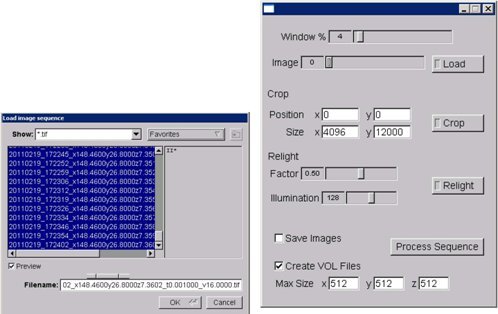 Figure 9. KESM stack processor application (screenshot).
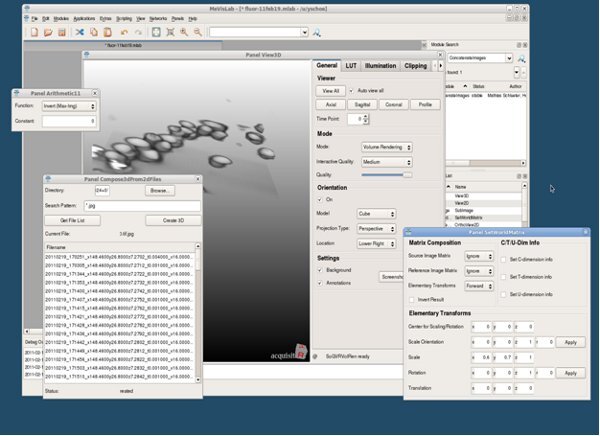 Figure 10. MeVisLab application (screenshot).
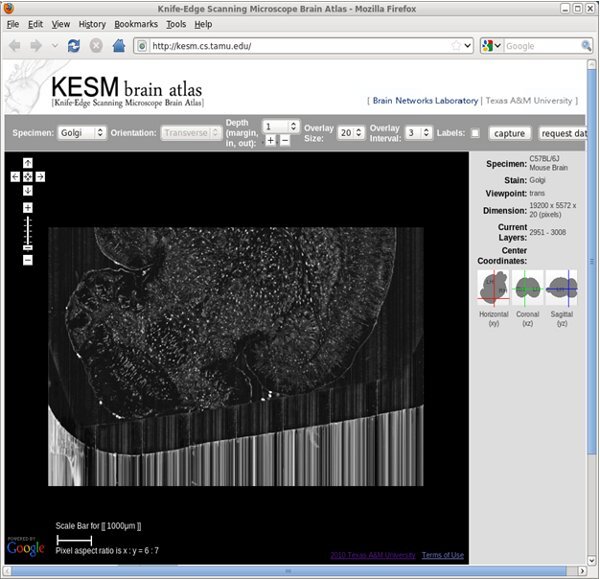 Figure 11. KESM Brain Atlas: Web-interface (screenshot).
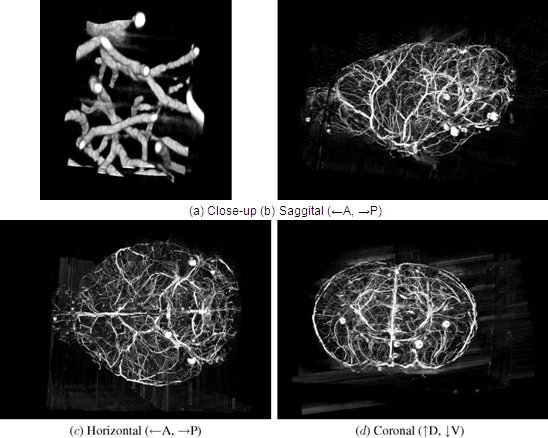 Figure 12. KESM whole-brain India ink data. Volume visualizations of KESM data stacks are shown for the vascular data set. (a) Close-up of the vascular data. Width ~100 um. (b-d) Three standard views of the whole mouse brain vasculature (subsampled from high-resolution data). Width ~10mm.
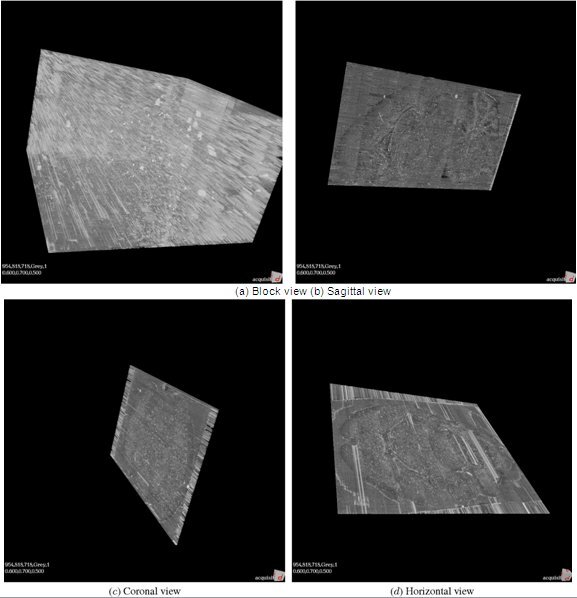 Figure 13. KESM whole-brain mouse Golgi data.
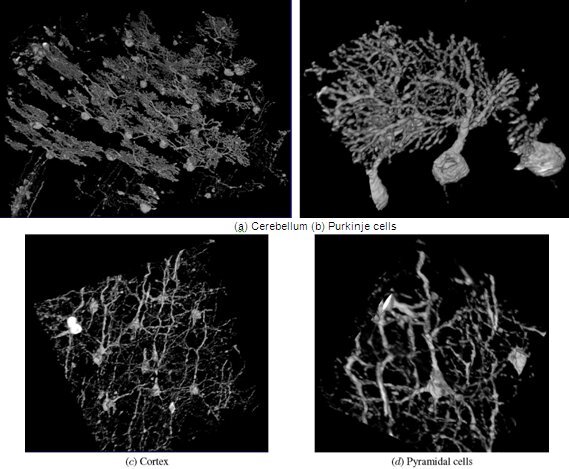 Figure 14. KESM Golgi data details.
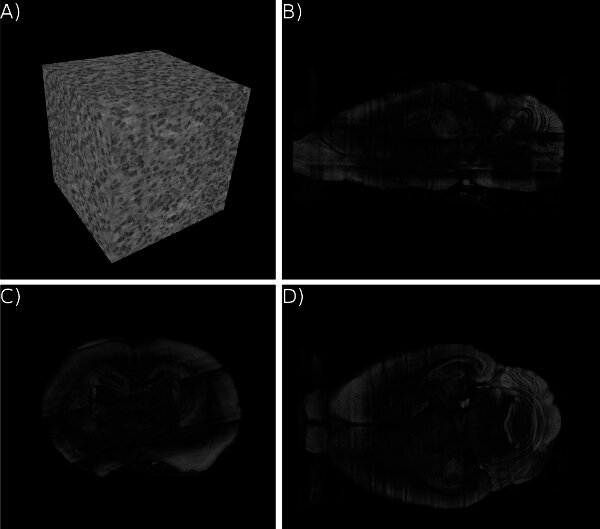 Figure 15. KESM whole-brain Nissl data. (a) Close-up of the Nissl data. ~300 um3. (b-d) Three standard views of the whole mouse brain Nissl data (subsampled from high-resolution data). Cross section shown for a clear view of the internal structures.
Discussion
The KESM allows for a submicrometer-level survey of large volumes of biological specimen (~1 cm3). This kind of volume is enough to hold whole small animal organs, such as brains, lungs, hearts, kidneys, etc. Scanned images from such organs can provide unprecedented quantitative information about the structural organization of these organs, and enable computational modeling of various functional aspects of these organs, including circuit and network dynamics, electrical properties, fluid and air flow dynamics, and muscular dynamics.
The specimen preparation protocol and post-analysis protocol detailed in this article are expected to help outside research groups to have easier access to the KESM and the resulting data. The KESM operation protocol will help these external researchers to appreciate the benefits and limitations of this unique imaging modality.
Disclosures
Todd Huffman is with 3Scan, a commercial company that manufactures and markets the KESM Technology (US patent #6,744,572).
Acknowledgments
This project was funded by NIH/NINDS (#1R01-NS54252), NSF (#0905041,#0079874), the Texas Advanced Technology Program (#ATP-000512-0146-2001, #ATP-000512-0261-2001), Texas A&M Research Foundation, Department of Computer Science and Engineering at Texas A&M University, and 3Scan. We would like to thank Bernard Mesa (Micro Star Technologies) for technical consultation and support for KESM instrumentation. Major parts of the design and implementation of the KESM was done by Bruce H. McCormick, who died in 2007.
References
- Abbott LC. Neuroscience Meeting Planner. Program No. 504.2. Washington, DC: Society for Neuroscience; 2008. High-throughput imaging of whole small animal brains with the knife-edge scanning microscope. [Google Scholar]
- Abbott LC, Sotelo C. Ultrastructural analysis of catecholaminergic innervation in weaver and normal mouse cerebellar cortices. Journal of Comparative Neurology. 2000;426:316–329. [PubMed] [Google Scholar]
- Choe Y, Abbott LC, Miller DE, Han D, Yang H-F, Chung JR, Sung C, Mayerich D, Kwon J, Micheva K, Smith SJ. Neuroscience Meeting Planner. Program No. 516.3. San Diego, CA: Society for Neuroscience; 2010. Multiscale imaging, analysis, and integration of mouse brain networks. [Google Scholar]
- Choe Y, Han D, Huang P-S, Keyser J, Kwon J, Mayerich D, Abbott LC. Neuroscience Meeting Planner. Program No. 389.10. Chicago, IL: Society for Neuroscience Program; 2009. Complete submicrometer scans of mouse brain microstructure: Neurons and vasculatures. [Google Scholar]
- Choe Y, Abbott LC, Han D, Huang PS, Keyser J, Kwon J, Mayerich D, Melek Z, McCormick BH. Knife-edge scanning microscopy: High-throughput imaging and analysis of massive volumes of biological microstructures. In: Ravi Rao A, Cecchi G, editors. High-Throughput Image Reconstruction and Analysis: Intelligent Microscopy Applications. Boston, MA: Artech House; 2008. pp. 11–37. [Google Scholar]
- Choe Y, Abbott LC, Ponte G, Keyser J, Kwon J, Mayerich D, Miller D, Han D, Grimaldi AM, Fiorito F, Edelman DB, McKinstry JL. Charting out the octopus connectome at submicron resolution using the knife-edge scanning microscope. BMC Neuroscience. 2010;11(Suppl 1):136–136. [Google Scholar]
- Mayerich D, Abbott LC, McCormick BH. Knife-edge scanning microscopy for imaging and reconstruction of three-dimensional anatomical structures of the mouse brain. Journal of Microscopy. 2008;231:134–143. doi: 10.1111/j.1365-2818.2008.02024.x. [DOI] [PubMed] [Google Scholar]
- Mayerich D, Kwon J, Sung C, Abbott LC, Keyser J, Choe Y. Fast macro-scale Transmission Imaging of Microvascular Networks Using KESM. Biomedical Optics Express. 2008;2:2888–2896. doi: 10.1364/BOE.2.002888. [DOI] [PMC free article] [PubMed] [Google Scholar]
- McCormick BH. (Department of Computer Science, Texas A & M University, College Station, TX). Technical Report. College Station, TX: Department of Computer Science, Texas A & M University; 2002. Mar, Development of the Brain Tissue Scanner. [Google Scholar]
- Sporns O, Tononi G, Kötter R. The human connectome: A structural description of the human brain. PLoS Computational Biology. 2005;1:42–42. doi: 10.1371/journal.pcbi.0010042. [DOI] [PMC free article] [PubMed] [Google Scholar]


