Abstract
Oxidative stress has been implicated in a number of pathologic conditions including ischemia/reperfusion damage and sepsis. The concept of oxidative stress refers to the aberrant formation of ROS (reactive oxygen species), which include O2•-, H2O2, and hydroxyl radicals. Reactive oxygen species influences a multitude of cellular processes including signal transduction, cell proliferation and cell death1-6. ROS have the potential to damage vascular and organ cells directly, and can initiate secondary chemical reactions and genetic alterations that ultimately result in an amplification of the initial ROS-mediated tissue damage. A key component of the amplification cascade that exacerbates irreversible tissue damage is the recruitment and activation of circulating inflammatory cells. During inflammation, inflammatory cells produce cytokines such as tumor necrosis factor-α (TNFα) and IL-1 that activate endothelial cells (EC) and epithelial cells and further augment the inflammatory response7. Vascular endothelial dysfunction is an established feature of acute inflammation. Macrophages contribute to endothelial dysfunction during inflammation by mechanisms that remain unclear. Activation of macrophages results in the extracellular release of O2•- and various pro-inflammatory cytokines, which triggers pathologic signaling in adjacent cells8. NADPH oxidases are the major and primary source of ROS in most of the cell types. Recently, it is shown by us and others9,10 that ROS produced by NADPH oxidases induce the mitochondrial ROS production during many pathophysiological conditions. Hence measuring the mitochondrial ROS production is equally important in addition to measuring cytosolic ROS. Macrophages produce ROS by the flavoprotein enzyme NADPH oxidase which plays a primary role in inflammation. Once activated, phagocytic NADPH oxidase produces copious amounts of O2•- that are important in the host defense mechanism11,12. Although paracrine-derived O2•- plays an important role in the pathogenesis of vascular diseases, visualization of paracrine ROS-induced intracellular signaling including Ca2+ mobilization is still hypothesis. We have developed a model in which activated macrophages are used as a source of O2•- to transduce a signal to adjacent endothelial cells. Using this model we demonstrate that macrophage-derived O2•- lead to calcium signaling in adjacent endothelial cells.
Keywords: Molecular Biology, Issue 58, Reactive oxygen species, Calcium, paracrine superoxide, endothelial cells, confocal microscopy
Protocol
Reactive oxygen species can be measured in live cells using oxidation sensitive dyes (1 & 2) or using plasmid sensors (3 & 4) by confocal microscopy.
1. Visualization of cytosolic ROS in J774 cells
Grow J774.1 mouse monocyte-derived macrophages (106 cells/ml) on glass bottom 35-mm dishes (Harvard Apparatus) for 48 h.
Challenge cells with TLR agonists (2 μg/ml, Lipo-teichoic acid-TLR2 agonist; 10μg/ml, Poly (I:C)-TLR3 agonist; 1 μg/ml LPS-TLR4 agonist) for 6 h at 37°C. Note: Macrophages treated under similar conditions were used for co-culture model Ca2+ mobilization.
Add the oxidation-sensitive dye H2DCF-DA (Invitrogen) to give a final concentration of 10 μM in ECM (Extracellular medium: 121 mM NaCl, 5 mM NaHCO3, 10 mM Na-HEPES, 4.7 mM KCl, 1.2 mM KH2PO4, 1.2 mM MgSO4, 2 mM CaCl2, 10 mM glucose and 2.0% dextran, pH 7.4; all obtained from Sigma) containing 2%BSA to dishes and incubate cells for 20 min before visualization under confocal microscopy.
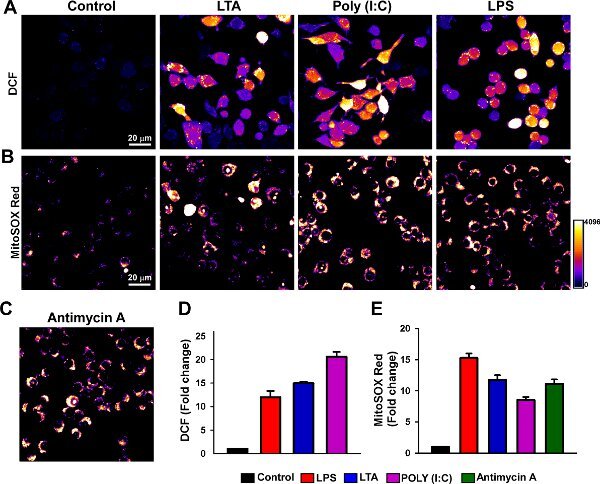
After dye loading, visualize cells placed on a temperature controlled stage of an appropriate imaging system. We use Carl Zeiss LSM 510 Meta confocal imaging system coupled with Argon ion laser source at an excitation of 488 nm for DCF fluorescence using 40x oil objective13 (Fig. 1A and D).
Analyze images using ImageJ software (1.44), freely available software from the National Institutes of Health (Rasband, W.S., ImageJ, U. S. National Institutes of Health, Bethesda, Maryland, USA, http://rsb.info.nih.gov/ij/, 1997-2009).
2. Visualization of mROS in J774 cells
Grow J774.1 mouse monocyte-derived macrophages (106 cells/ml) on glass bottom 35-mm dishes (Harvard Apparatus) for 48 h.
Challenge the cells with TLR ligands to induce mROS production (2 μg/ml, Lipo-teichoic acid-TLR2; 10μg/ml, Poly (I:C)-TLR3; 1 μg/ml LPS-TLR4) for 6 h at 37°C.
Add mitochondrial superoxide indicator MitoSOX Red (Invitrogen) to give a final concentration of 5 μM in ECM containing 2%BSA to dishes and incubate cells for 30 min at 37°C to allow loading of MitoSOX Red.
After dye loading, visualize cells on a temperature controlled stage of a Carl Zeiss LSM 510 Meta confocal imaging system couple with Argon ion laser source at an excitation of 561 nm for MitoSOX Red fluorescence using 40x oil objective (Fig 1B and E).
For control experiments, after dye loading add PBS or DMSO (negative control) or 2μM Antimycin A (as mitochondrial superoxide generator-positive control) to cells prior to image the sample as described in 2.4 (Fig 1C).
Analyze the images using ImageJ software (1.44).
3. Visualization of cytosolic ROS in stable HyPer-cyto MPMVECs
We use pHyPer-cyto (Evrogen) a mammalian expression vector encoding a fluorescent sensor HyPer that localizes in the cytoplasm and specifically senses submicromolar concentration of H2O214.
Transfect Murine Pulmonary Microvascular Endothelial cells (MPMVECs) with pHyPer-cyto vector using either electroporation or transfection reagents. We use 10 x 106 cells and transfect with 10μg of pHyPer-cyto via electroporation using BioRad Gene pulser electroporator system (250V; 500 μF). Culture MPMVECs in DMEM medium supplemented with 10% FBS, nonessential amino acids, endothelial growth supplement and antibiotics. Note: Following transfection, plate cells at low density to facilitate colony growth.
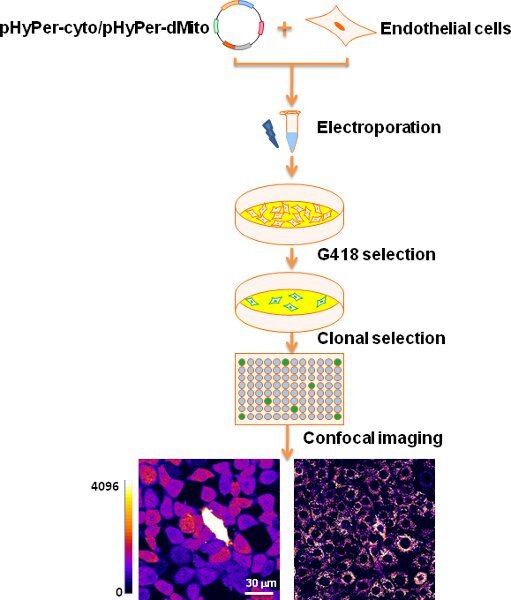
Replace medium with complete culture medium supplemented with 500 μg/ml G418, 48 hours after transfection. Screen for clones that have highest percentage of HyPer positive cells and passage HyPer positive clones to increase the number of HyPer positive cells (Fig. 2). Note: We use serial dilution of cells for clonal selection of single cells and screen for stable cells highly expressing HyPer.
Grow stable HyPer-cyto MPMVECs on 0.2% gelatin coated coverslips (80% confluence). Next day challenge cells with TLR ligands (2 μg/ml, Lipoteichoic acid-TLR2; 10μg/ml, Poly (I:C)-TLR3; 1 μg/ml LPS-TLR4) for 6 h at 37°C. Untreated cells serve as control.
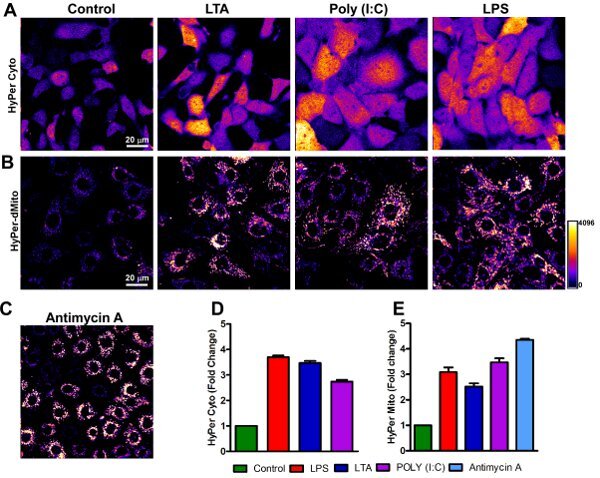
After treatment, mount the coverslips onto Attofluor cell chamber (Invitrogen). Add 1ml of pre warmed Hanks balanced salt solution (HBSS) to the chamber and place the chamber on a temperature controlled stage of Carl Zeiss LSM 510 Meta confocal imaging system. Visualize and image fluorescence change at an excitation of 488 nm using 40x oil objective (Fig. 3A and D).
Analyze images using ImageJ software (1.44) (see section 6).
4. Visualization of mitochondrial ROS in stable HyPer-dMito MPMVECs
We use pHyPer-dMito (Evrogen) a mammalian expression vector encoding mitochondria-targeted HyPer that localizes in the mitochondria and specifically senses submicromolar concentration of H2O2.
Transfect MPMVECs with pHyPer-dMito and generate stable HyPer-dMito MPMVECs following steps described in section 3.2-3.3.
Grow stable HyPer-dMito MPMVECs on 0.2% gelatin coated coverslips (80% confluence).
Next day challenge cells with TLR ligands (2 μg/ml, Lipoteichoic acid-TLR2; 10μg/ml, Poly (I:C)-TLR3; 1 μg/ml LPS-TLR4) for 6 h at 37°C. Untreated cells serve as negative control. Add 2μM Antimycin A (mitochondrial superoxide inducer-positive control) prior to visualizing sample.
After treatment, mount the coverslips onto Attofluor cell chamber (Invitrogen). Add 1ml of pre-warmed Hanks balanced salt solution (HBSS) to the chamber and place the chamber on a temperature controlled stage of Carl Zeiss LSM 510 Meta confocal imaging system. Visualize and image fluorescence change at an excitation of 488 nm using 40x oil objective (Fig. 3B, C and E).
Analyze images using ImageJ software (1.44) (see section 6).
5. Co-culture model for visualization of paracrine-derived ROS triggered Ca2+ signaling in endothelial cells
For the visualization and measurement of [Ca2+]i changes we use a Ca2+ sensitive fluorescent dye fluo-4 AM (Invitrogen).
Grow MPMVECs on 0.2% gelatin coated 25mm glass coverslips (80% confluence).
Incubate the cells grown on coverslips at room temperature for 30 min in ECM containing 2%BSA and 0.003% pluronic acid with 5 μM fluo-4 AM (Invitrogen) final concentration to allow loading of fluo-4 AM. After loading, wash cells with experimental imaging solution (ECM containing 0.25% BSA) containing sulfinpyrazone to minimize dye loss.
After loading fluo-4, mount coverslips onto Attofluor cell chamber (Invitrogen). Add 800μl of pre warmed experimental imaging solution to the chamber and place it on a temperature controlled stage of Carl Zeiss LSM 510 Meta confocal imaging system.
In a separate tube label the nonactivated or activated macrophages isolated from either wild-type or gp91phox-/- mice (treated with LPS for 6 hr) with cell tracker red CMTPX (500ng/ml) (Invitrogen) in ECM containing 2%BSA and 0.003% pluronic acid. Wash and resuspend cells with 200μl of experimental imaging solution.
Add labeled macrophages on to fluo-4 AM loaded MPMVECs in the chamber assembly.
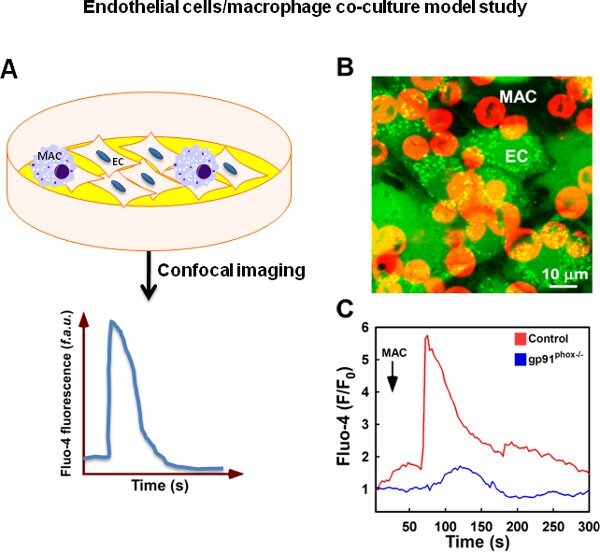
Record the green and red fluorescence every 3s for 10-20 min using Carl Zeiss LSM510 Meta confocal imaging system with a Argon ion laser source with excitation at 488 and 561 nm for fluo-4 AM and cell tracker red fluorescence respectively ( Fig.4 A-C). Note: Alternatively, J774.1 cell line could be used to elicit MPMVECs Ca2+ mobilization.
Analyze fluo-4 fluorescence intensity changes using ImageJ software (1.44) (see section 6).
6. Data analysis using ImageJ software
Transfer the images obtained from the confocal system as a .lsm format file for data analysis. ZEN 2009 and ZEN 2010 software provided with LSM 510 Meta confocal microscope or LSM 710 multiphoton confocal microscope respectively saves files in .lsm format. We recommend using this native .lsm files for image analysis as original quality is retained. This file format can be directly opened in image analysis program Image J. The following steps provide an example quantitative analysis of single image. No additional plugins are required for this data analysis.
Open .lsm or .TIFF file in Image J program using FILE>OPEN
Click the tab IMAGE>COLOR>SPLIT CHANNELS and split the green and DIC channels. Use the image from the green channel for subsequent analysis.
Double click and select the 'Elliptical brush selection" tab and set the pixel value to 20.
For Hyper-cyto images, click on a single cell to define the circular area of measurement. Then press "M" key to measure the intensity of the selected area. The values are retained in a new results window.
Next by holding "Shift" key click on a different cell to select another area, followed by pressing "M" key. The intensity is recorded in the result window. Repeat the steps 4-5 on 50 different cells.
For Hyper d-mito images, set the pixel value to 10 in the Elliptical brush selection. Region of interest (ROI) has to be manually traced including the mitochondria of particular cells.
Using freehand, trace the region of around the mitochondria and then press "M". Repeat the steps 6-7 on 50 different cells.
Copy the mean values from the results window and paste in a Excel sheet or any software to plot the results. We use either SigmaPlot or Graphpad PRISM to plot the data as graph.
7. Representative Results
Figure 1 shows cytosolic and mitochondrial ROS production upon challenge with TLR ligands. Representative confocal images show increase of DCF (cytosolic) and MitoSOX Red (mitochondria) fluorescence after 6 hr of stimulation. Fluorescence changes were normalized and expressed as fold change.
Figure 2 shows the generation of stable HyPer-cyto and HyPer-dMito endothelial cells. Mouse endothelial cells were transfected with pHyPer-cyto or pHyPer-dMito plasmid constructs via electroporation. Cells stably expressing plasmids were selected with G418 for two weeks. After selection, diluted cells were seeded in 96 well plates. Individual colonies were isolated and imaged for homogeneous expression.
Figure 3 shows the measurement of endothelial cytosolic and mitochondrial H2O2 levels. Representative confocal images show increase of HyPer-cyto (cytosolic) and HyPer-dMito (mitochondria) fluorescence after 6 hr of stimulation. Fluorescence intensity changes were normalized and expressed as fold change.
Figure 4 shows the assessment of macrophage-derived ROS induced endothelial cytosolic Ca2+ mobilization. LPS-stimulated macrophages were added onto pulmonary microvascular endothelial cells (PMVEC) that had been previously loaded with the intracellular Ca2+ ([Ca2+]i) indicator dye Fluo-4. Application of wild type LPS-activated macrophages evoked an [Ca2+]i rise in PMVECs that was attenuated by knockout of functional NADPH oxidase (gp91phox-/-).
 Figure 1. Visualization of macrophage generated cellular ROS and mitochondrial superoxide. J774.1 cells were challenged with TLR2, 3 and 4 ligands. (2 μg/ml, Lipoteichoic acid-TLR2; 10μg/ml, Poly (I:C)-TLR3; 1 μg/ml LPS-TLR4) for 6 h at 37°C. After treatment cells were loaded with (A) cellular ROS indicator (H2DCF-DA; green fluorescence) or (B) mitochondrial superoxide indicator (MitoSOX Red; red fluorescence). (C) Antimycin A was used as a positive control for mitochondrial ROS production. Fluorescence intensity changes were assessed using confocal microscopy. (D) and (E) Quantitation of mean fluorescence change.
 Figure 2. Schematic representation of generating stable expression of endothelial cell cytosolic and mitochondrial ROS indicators.
 Figure 3. Visualization of endothelial cytosolic and mitochondrial H2O2 levels. MPMVECs stably expressing (A) HyPer-cyto or (B) HyPer-dMito were challenged with TLR2, 3 and 4 ligands (2 μg/ml, Lipoteichoic acid-TLR2; 10μg/ml, Poly (I:C)-TLR3; 1 μg/ml LPS-TLR4) for 6 h at 37°C. (C) Antimycin A was used as a positive control for mitochondrial ROS production. After treatment, fluorescence intensity changes were assessed using confocal microscopy. (D) and (E) Quantitation of mean fluorescence change.
 Figure 4. Macrophage-derived ROS elicit impaired endothelial cell Ca2+ mobilization. (A) Schematic representation of endothelial cells/macrophage co-culture model study. (B) Freshly isolated murine macrophages from both WT and gp91phox null mice (The Jackson Laboratory) were activated by 1 μg/ml LPS for 6 h. Macrophages were labeled with cell-tracker Red (red) and added onto Fluo-4 loaded PMVECs (green) to assess paracrine O2•- signaling. (C) LPS-activated macrophages isolated from WT mice triggered large and rapid Ca2+ mobilization in PMVECs compared to macrophages from gp91phox null mice. Validation of macrophage activation has been demonstrated previously.
Discussion
The method described here allows rapid and quantitative measurement of reactive oxygen species in living cells either using oxidation sensitive dyes or plasmid sensors. Agonists of TLRs (Toll-like receptors) are compounds that stimulate the cells through the TLRs present on the cell surface and trigger the downstream signaling pathways15. In our protocol, we used three different TLR agonists viz., Lipo-teichoic acid-TLR2 agonist; Poly (I:C)-TLR3 agonist; LPS-TLR4 agonist which are reported to induce ROS as a model system to demonstrate the ROS measurement. Measurement of ROS using oxidants sensitive dye is rapid and can be used to measure variety of ROS species. The use of plasmid based sensor HyPer selectively detects H2O2 levels. H2O2 is more stable oxidant and also the use of HyPer cyto and HyPer-dMito in a stable cell setting adds the advantage over photo-autooxidation of ROS sensitive fluorescent dyes. HyPer does not cause artifactual ROS generation and can be used for detection of fast changes of H2O2 concentration in different cell compartments under various physiological and pathological conditions. Cells stably expressing the HyPer sensors are used for clonal selection of population that offers more reliable and accurate measurements of H2O2 levels. Importantly, this method also describes the detection and quantitative measurement of Ca2+ mobilization in live cells triggered by paracrine derived ROS from the neighboring cells such as innate immune cells. This experimental procedure combined with confocal microscopy may be very useful to reveal important spatio-temporal changes in cell signal transduction events especially in instances where two different cell types are involved. Though, the representative experiments detailed in this paper are just one example of the type of interaction studied, this technique can be easily adapted to study cellular interactions between multiple live cell types.
Disclosures
No conflicts of interest declared.
Acknowledgments
This work was supported by the National Institutes of Health grant (R01 HL086699, HL086699-01A2S1, 1S10RR027327-01) to MM. Our article is partly supported by Carl Zeiss Microimaging LLC.
References
- Madesh M. Selective role for superoxide in InsP3 receptor-mediated mitochondrial dysfunction and endothelial apoptosis. J. Cell. Biol. 2005;170:1079–1090. doi: 10.1083/jcb.200505022. [DOI] [PMC free article] [PubMed] [Google Scholar]
- Droge W. Free radicals in the physiological control of cell function. Physiol. Rev. 2002;82:47–95. doi: 10.1152/physrev.00018.2001. [DOI] [PubMed] [Google Scholar]
- Hamanaka RB, Chandel NS. Mitochondrial reactive oxygen species regulate cellular signaling and dictate biological outcomes. Trends Biochem. Sci. 35:505–513. doi: 10.1016/j.tibs.2010.04.002. [DOI] [PMC free article] [PubMed] [Google Scholar]
- Hawkins BJ. S-glutathionylation activates STIM1 and alters mitochondrial homeostasis. J. Cell. Biol. 2010;190:391–405. doi: 10.1083/jcb.201004152. [DOI] [PMC free article] [PubMed] [Google Scholar]
- Madesh M, Hajnoczky G. VDAC-dependent permeabilization of the outer mitochondrial membrane by superoxide induces rapid and massive cytochrome c release. J. Cell Biol. 2001;155:1003–1015. doi: 10.1083/jcb.200105057. [DOI] [PMC free article] [PubMed] [Google Scholar]
- Finkel T, Holbrook NJ. Oxidants oxidative stress and the biology of ageing. Nature. 2000;408:239–247. doi: 10.1038/35041687. [DOI] [PubMed] [Google Scholar]
- Rittirsch D, Flierl MA, Ward PA. Harmful molecular mechanisms in sepsis. Nat. Rev. Immunol. 2008;8:776–787. doi: 10.1038/nri2402. [DOI] [PMC free article] [PubMed] [Google Scholar]
- Sanlioglu S. Lipopolysaccharide induces Rac1-dependent reactive oxygen species formation and coordinates tumor necrosis factor-alpha secretion through IKK regulation of NF-kappa. 2001;276:30188–30198. doi: 10.1074/jbc.M102061200. [DOI] [PubMed] [Google Scholar]
- Hawkins BJ, Madesh M, Kirkpatrick CJ, Fisher AB. Superoxide flux in endothelial cells via the chloride channel-3 mediates intracellular signaling. Mol. Biol. Cell. 2007;18:2002–2012. doi: 10.1091/mbc.E06-09-0830. [DOI] [PMC free article] [PubMed] [Google Scholar]
- Vliet Avander. NADPH oxidases in lung biology and pathology: host defense enzymes and more. Free Radic. Biol. Med. 2008;44:938–955. doi: 10.1016/j.freeradbiomed.2007.11.016. [DOI] [PMC free article] [PubMed] [Google Scholar]
- Babior BM, Kipnes RS, Curnutte JT. Biological defense mechanisms. The production by leukocytes of superoxide, a potential bactericidal agent. J. Clin. Invest. 1973;52:741–744. doi: 10.1172/JCI107236. [DOI] [PMC free article] [PubMed] [Google Scholar]
- Lambeth JD. NOX enzymes and the biology of reactive oxygen. Nat. Rev. Immunol. 2004;4:181–189. doi: 10.1038/nri1312. [DOI] [PubMed] [Google Scholar]
- Mukhopadhyay P. Simultaneous detection of apoptosis and mitochondrial superoxide production in live cells by flow cytometry and confocal microscopy. Nat. Protoc. 2007;2:2295–2301. doi: 10.1038/nprot.2007.327. [DOI] [PMC free article] [PubMed] [Google Scholar]
- Niethammer P, Grabher C, Look AT, Mitchison TJ. A tissue-scale gradient of hydrogen peroxide mediates rapid wound detection in zebrafish. Nature. 2009;459:996–999. doi: 10.1038/nature08119. [DOI] [PMC free article] [PubMed] [Google Scholar]
- Medzhitov R. Toll-like receptors and innate immunity. Nat. Rev. Immunol. 2001;1:135–145. doi: 10.1038/35100529. [DOI] [PubMed] [Google Scholar]


