Abstract
Optical coherence microscopy (OCM) is a promising technology for high-resolution cellular-level imaging in human tissues. Line-scanning OCM is a new form of OCM that utilizes line-field illumination for parallel detection. In this study, we demonstrate improved detection sensitivity by using an achromatic design for line-field generation. This system operates at 830-nm wavelength with 82-nm bandwidth. The measured axial resolution is 3.9 μm in air (corresponding to ~2.9 μm in tissue), and the transverse resolutions are 2.1 μm along the line-field illumination direction and 1.7 μm perpendicular to line illumination direction. The measured sensitivity is 98 dB with 25 line averages, resulting in an imaging speed of ~2 frames/s (516 lines/s). Real-time, cellular-level imaging of scattering tissues is demonstrated using human-colon specimens.
Keywords: Confocal microscopy, medical and biological imaging, optical coherence microscopy (OCM), optical coherence tomography (OCT)
I. Introduction
Optical coherence tomography (OCT) is an emerging medical imaging technology that enables imaging of tissue microstructure with resolution approaching that of histopathology but without the need to excise and process specimens [1], [2]. Optical coherence microscopy (OCM) improves the transverse resolution of OCT by using a high-numerical aperture (NA) objective to generate en face images with cellular-level resolution [3], [4]. Real-time, high-resolution OCM imaging of scattering tissues has been previously performed by raster scanning a tightly focused beam [5]–[7] [see Fig. 1(a)]. However, it is challenging to develop a robust two-axis miniaturized optical scanner for endoscopic cellular-resolution OCM applications [8]. Alternately, OCM and OCT can be implemented using full-field (FF) illumination and detection so that no scanning component is required [9]–[13] [see Fig. 1(c)]. FF-OCT and OCM are based on the Linnik interference microscope where two identical objectives are placed in both the sample and reference arms [9]. FF-OCT/OCM has the advantage of using incandescent light sources rather than lasers, reduced speckle, and low-cost. Previous studies have demonstrated excellent image quality with cellular level resolutions in a range of tissues [9]–[13]. Furthermore, FF-OCT/OCM is amenable to endoscopic applications delivered through imaging fiber bundles [14]. However, FF techniques have increased incoherent scattered light and pixel crosstalk, which results in lower sensitivity when compared with point-scanning OCM. FF detection also lengthens the pixel dwell time, and thus increases the susceptibility to phase/fringe averaging effects from tissue motion.
Fig. 1.
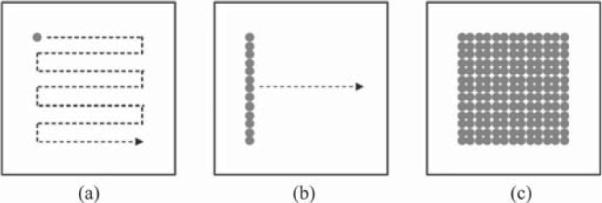
Three image acquisition formats for OCM: (a) point scanning; (b) line scanning, and (c) full-field. The shaded dots show the illumination patterns and the dashed arrows show the scanning patterns.
Line-field illumination and detection [see Fig. 1(b)] offers a potential solution to overcome those limitations. Line-scanning OCM (LS-OCM) has several advantages over FF-OCM. First, line-field illumination reduces pixel crosstalk because a line, rather than the full imaging field is illuminated. Second, the confocal gate helps to reject out-of-focus incoherent scattered light. Since incident light levels are typically limited by detector saturation from scattered light, this limits detection sensitivity. Depending on the tissue scattering, line scanning enables the sensitivity to be increased by more than an order of magnitude. Finally, line detection is less sensitive to sample motion compared with FF detection because phase-sensitive information is acquired more rapidly, before significant phase averaging effects occur. This is important for future in vivo imaging applications where sample motion can cause fringe averaging effects that reduce sensitivity.
We have previously developed an LS-OCM system with 93-dB detection sensitivity [15]. Table I summarizes several representative OCM systems previously published in literature and their reported sensitivities. For better comparison, the sensitivity is also normalized to the same image speed (frame rate) of 1 Hz. From Table I, point-scanning OCM system has the highest sensitivity, followed by LS-OCM, and then FF-OCM.
TABLE I.
Performance of Representative OCM Systems
| Authors | Scanning | Image Pixels | Sensitivity | Normalizeda |
|---|---|---|---|---|
| Izatt et al., Ref. [4] | point | 100 × 100 | 103.5 dB with 100 s per image | N/Ab |
| Aguirre et al., Ref. [5] | point | 250 × 1375 | > 93 dB with 0.25 s per image | > 99 dB |
| Aguirre et al., Ref. [7] | point | 500 × 750 | 98 dB with 0.5 s per image | 103 dB |
| Chen et al., Ref. [15] | line | 256 × 256 | 93 dB with 0.6 s per image | 95 dB |
| Dubois et al., Ref. [10] | full-field | 256 × 256 | 90 dB with 4 s per image | 84 dB |
| Oh et al., Ref. [13] | full-field | 320 × 256 | 86 dB with 2 s per image | 83 dB |
Normalized to 1-Hz imaging speed. For point and line scanning OCM, slow axis also normalized to 250 pixels.
Image is acquired by X–Y Iranslational stage therefore speed might not be scalable.
In our previously reported LS-OCM system, a femtosecond Ti:Sapphire laser was used as the light source and the line illumination was performed by the combination of a spherical focusing lens and a plano-concave cylindrical lens. This design has the advantage that it does not require focusing with a cylindrical singlet lens and hence the aberration is less severe. Nevertheless, the aberration is severe enough to increase the focused line width on the sample (~5 μm) by about a factor of 3 from the theoretical value, which is calculated to be 1.5 μm using the Fraunhofer diffraction theory. This not only reduces the system sensitivity by increasing the incoherent light, but also lowers the light collection efficiency. Design of diffraction limited cylindrical lenses can help improve the system performance.
In this study, we improve the LS-OCM performance by using an achromatic cylindrical lens for line-field generation. The feasibility of imaging highly scattering biological tissues is demonstrated on human colon specimens ex vivo.
II. Methods
A. LS-OCM Imaging System
Fig. 2(a) shows the diagram of the LS-OCM system. The system was based on a Linnik-type interference microscope [15] with two identical objectives (Zeiss, 10×, 0.3 NA, water immersion, working distance 3.1 mm, infinity corrected) placed in the sample and reference arms, respectively. A compact broadband Ti:Sappire laser (Femtolaser Produktions GmbH) was used to generate a spectral bandwidth of 82 nm at a center wavelength of 820 nm. The output light was coupled by a single-mode fiber and collimator (L1) into the interferometer. Bulk glass (SF57, 5 cm) was used to stretch the pulse to a few picoseconds so that spectral modulation due to nonlinear effects in the fiber can be minimized. Line-field illumination was achieved by using an achromatic cylindrical lens (see Section II-B), and then imaged onto the sample with a lens (L2) and microscope objective (MO). The line-field illumination power on the sample was 15 mW. The reference arm power was controlled by a neutral density (ND) filter and a glass plate was used in the sample arm to balance the dispersion introduced by the ND filter. Light from the sample and reference arms was recombined by the beam splitter and imaged onto a high-speed, 1024-pixel line-scan charged-coupled device (CCD) camera with 12-bit A/D range (Atmel AViiVA M2 CL).
Fig. 2.
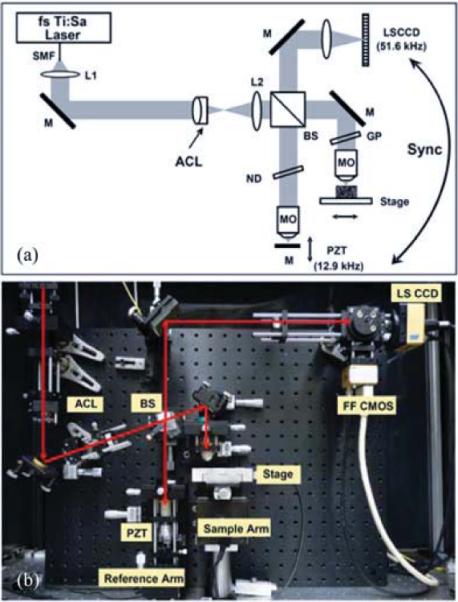
(a) Schematic and (b) photo of the LS-OCM system. SMF: single-mode fiber; ACL: achromatic cylindrical lens; BS: beam splitter; MO: microscope objectives; M: mirror; ND: neutral density filter; GP: glass plate for dispersion compensation; PZT: piezoelectric transducer; LSCCD: line-scan CCD camera.
The interferometer was constructed using a broadband cube beam splitter which balanced the dispersion in the sample and reference paths. The beamsplitter cube was rotated slightly off axis in order to avoid parasitic reflections from the surfaces from saturating the camera. The images from the sample and reference arm objectives were focused onto the camera using a 75-mm achromatic lens, creating a 25× magnification. The line illumination field of view was 500 μm and was limited by the Gaussian beam shape of the illuminating beam along the direction of the line. Fig. 2(b) shows a photo of the system. The light path is indicated by the red lines. The incident beam was tilted at an angle to minimize the light reflection from the surfaces of the beam splitter. In addition, an area-scan CMOS camera was used to facilitate the beam alignment.
The interference signal was modulated by actuating the reference mirror with a piezoelectric transducer (PZT, PZ-14, Burleigh), using four integrating-bucket technique [16] with sinusoidally phase modulation to extract the interference (ac) component. The interference signal was integrated successively over the four quarters of the modulation period. Four interferograms were then obtained for each pixel of the image, and the reflectivity of the pixel can be reconstructed by algebraic operations of the four interferograms [16]. En face images were generated by transversely scanning the sample, orthogonal to the illumination line with a precision translation stage. A series of en face images at different imaging depths were acquired by translating the sample in the axial direction. The line-scan camera was read at ~52 Mpixel/s, corresponding to a line acquisition rate f = 51.6 kHz. The PZT was actuated at f/4 = 12.9 kHz and synchronized to the camera frame grabber. Typically, 25 line scans from each of the four-quadrant integrating-buckets (100 line scans in total) were averaged to increase the signal-to-noise ratio, resulting in an image acquisition speed of 516 lines/s. Imaging was performed by translating the sample using stepping motor stage with a step size of 0.1 μm at a rate of 0.4 mm/s. Each en face image consisted of 300 lines and was acquired in 0.58 s.
In OCM, it is important to coordinate the confocal gate with the coherent gate to achieve the optimal optical sectioning. In this study, gate coordination is performed by first setting both the reference and sample mirrors to the focal point of the objectives using the area-scan CMOS camera. Then, while the sample arm is fixed, the delay between sample and reference arms is adjusted by moving the reference arm objective and mirror in tandem to reach maximum interference signal.
B. Design of Achromatic Cylindrical Lens
Line-field illumination was achieved previously [15] by a cylindrical singlet lens and the chromatic aberration was severe enough to increase the focused line width on the sample (×5 μm) by a factor of ~3 from the theoretical value, which is calculated to be 1.5 μm using the Fraunhofer diffraction theory. This not only reduces the system sensitivity by increasing the incoherent light, but also lowers the light collection efficiency. Design of diffraction limited cylindrical lenses can significantly improve the system performance. Fig. 3 shows the design (a) and the calculated performance of the focusing cylindrical lens (b). Over the full spectral bandwidth of the laser (750–900 nm), the chromatic focal shift of the achromatic design cylindrical lens is less than half of the Rayleigh range of the focused spot, with a more than fivefold improvement compared to a cylindrical singlet lens used in the previous experiment. The diffraction-limited focusing of <2 μm was verified by relay imaging the focused line onto the area-scan CMOS camera. The improved focusing leads to a reduced illumination power on the sample as well as an improved sensitivity.
Fig. 3.
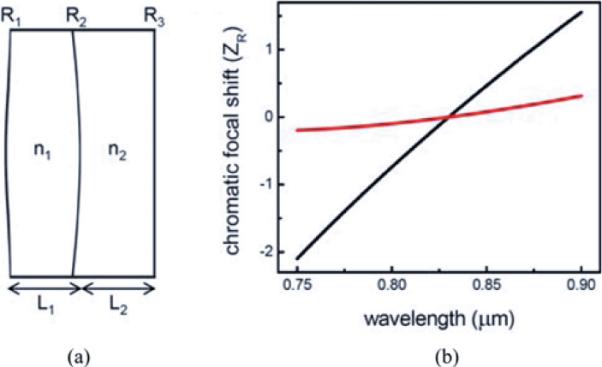
(a) Parameters of the designed focusing achromatic cylindrical lens. The compound lens consists of an LAKN22 lens (n1) and an SF10 lens (n2). The LAKN22 lens has a center thickness of 4 mm and two surface curvatures of 121 mm (R1) and −99.7 mm (R2). The SF10 lens has a center thickness of 4 mm and two surface curvatures of −99.7 mm (R2) and −1600 mm (R3). (b) Chromatic focal shift in units of Rayleigh range (307 mm). Black curve is the performance of a single-element cylindrical lens (Thorlabs LJ1653L1), which has a similar focal length as the designed lens. Red curve is the performance of the designed achromatic cylindrical lens.
III. Results
A. Characterization of the LS-OCM System
Fig. 4(a) shows the spectrum from the Ti:Sapphire laser after fiber coupling and Fig. 4(b) shows the axial point spread function measured by translating a mirror in the sample arm. The measured axial resolution (full-width at half-maximum of the point spread function) was 3.9 μm in air (corresponding to ~2.9 μm in tissue assuming an index of refraction of 1.33).
Fig. 4.
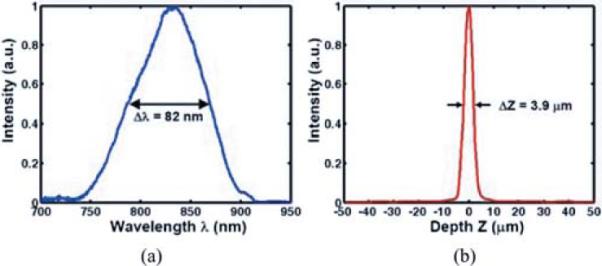
(a) Spectrum of the light source (modelocked femtosecond Ti:Sapphire Laser). (b) Measured axial point spread function.
Fig. 5(a) shows an en face OCM image of a USAF test target. The smallest group 7, element 6 bars were resolved, indicating the transverse resolution is less than 2.2 μm. By plotting the intensity profiles along both vertical (Y) (line illumination direction) and horizontal (X) dimensions and measure the 20–80% transition across a sharp edge [17], the respective transverse resolutions along the line illumination and perpendicular to the illumination are 2.1 and 1.7 μm, respectively [see Fig. 5(b) and (c)]. The sensitivity was quantified by placing a mirror in the sample arm with a calibrated attenuator. By summation of the signal-to-noise ratio (in decibels) of the attenuated mirror image with twice the calibrated attenuation (accounting for the double-pass of the light), 98-dB detection sensitivity was measured with an imaging speed of 1.7 frames/s (with 25 line averages). Each image frame contained 300 × 500 pixels.
Fig. 5.
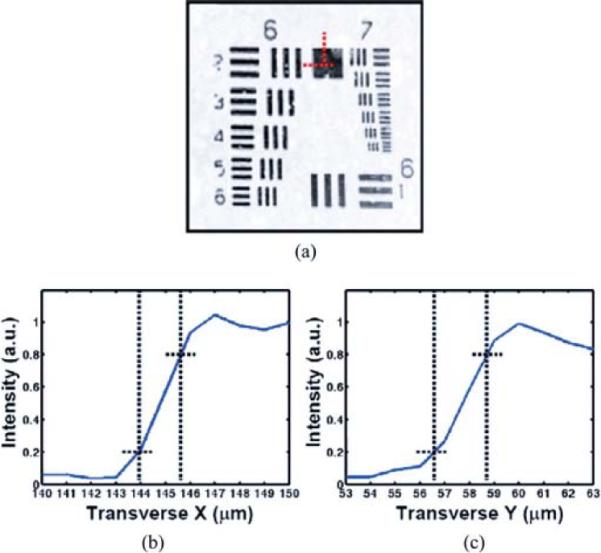
(a) LS-OCM image of air force resolution target. The smallest elements (Group 7, Element 6) can be clearly visualized, indicating the transverse resolution is <2.2 μm. (b) Plot of intensity across the horizontal red dotted line in (a), the estimated transverse resolution in X direction (scanning) using 20–80% edge is 1.7 μm. (c) Plot of intensity across the vertical red dotted line in (a), the estimated transverse resolution in Y direction (line illumination) using 20–80% edge is 2.1 μm.
B. Imaging Human Tissues
The feasibility of imaging high-scattering biological tissues was demonstrated on human colon specimens ex vivo. The specimens were preserved in Formalin and imaged within a few hours after excision. During imaging, phosphate-buffered saline was used to immerse the microscope objective and maintain tissue hydration. En face images at 40, 100, and 150 μm depths are shown in Fig. 6. Detailed structures such as the crypt lu-mens, the epithelium, and lamina propria are clearly visualized. Translucent mucin-containing goblet cells are abundant within the epithelium. Deeper images of crypt lumen show narrower size than those at shallower depth. Representative histology images at the corresponding depth are also presented, which show good correlation with LS-OCM images. These results demonstrate the high-resolution, cellular-level imaging capability of the LS-OCM system.
Fig. 6.
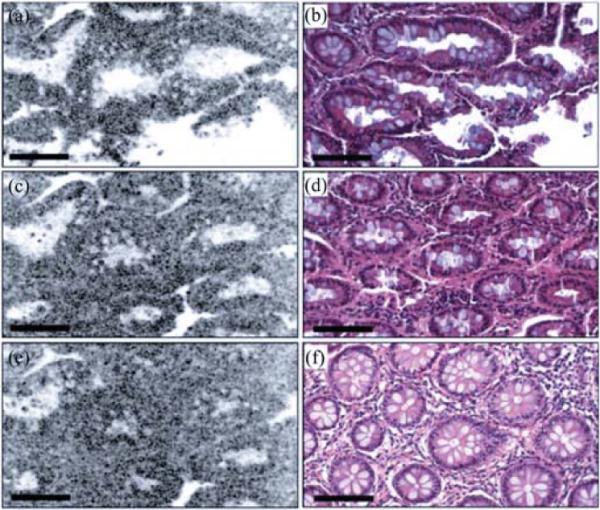
LS-OCM images (a, c, and e) and corresponding histology (b, d, and f) at different depths: 40 μm (a and b); 100 μm (c and d); 150 μm (e and f). Bar: 100 μm.
Three-dimensional imaging was also performed by acquiring a stack of en face images while translating the sample in depth. A total of 100 en face images from 30 to 175 μm were acquired in 50 s with a frame rate of 1.7 Hz. Supplemental Movie 1 shows the movie of en face LS-OCM images as the imaging plane is stepped into the tissue. The lumen diameter decreases as the imaging plane is moved deeper into the mucosa. The continuous changing of goblet cell distribution can be visualized as the imaging plane is moved deeper into the lumen. Fig. 7 shows the 3-D isosurface view of two central colonic crypt lumens and the adjacent goblet cells. Supplemental Movie 2 further reveals the 3-D morphology of these two crypts and their adjacent goblet cells from different perspectives. The characteristic cylindrical shape of goblet cells can be visualized clearly. Those cells contain a narrow base and expanded apical portion that sometimes extends into the crypt lumen. The main function of goblet cells is to secrete mucus, which serves many functions including protection against shear stress and chemical damage [18]. The ability of LS-OCM to visualize the crypt morphology and goblet cells in 3-D could potentially be utilized in revealing certain pathologies of the colon.
Fig. 7.
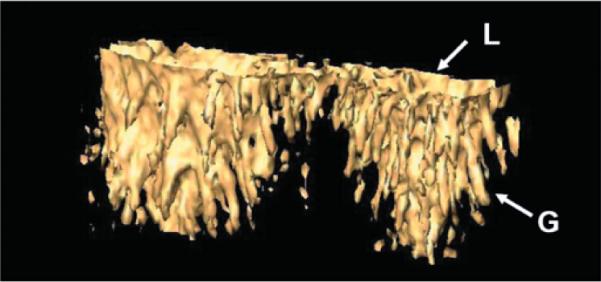
Three-dimensional isosurface view of two central crypts, including their lumens (L) and the adjacent goblet cells (G). 3-D object size is 360 μm × 170 μm × 145 μm (depth).
IV. DISCUSSION
For FF-OCM and LS-OCM, the system sensitivity is determined by the minimal detectable reflectivity Rmin = 4Rinc/Nζ, where Rinc is the proportion of the incoherent light backscattered by the sample but located outside the coherence volume, N is the number of images averaged, and ζ is the full-well capacity (FWC) of the CCD pixels [10]. Therefore, the sensitivity of the system is inversely proportional to incoherent scattered light level. Incoherent scattered light limits the maximum usable power before the CCD camera saturates and, hence, limits the detection sensitivity. In general, FF techniques have higher incoherent scattered light and pixel crosstalk which results in lower sensitivity when compared with point-scanning OCM (see Table I). Line-field illumination reduces incoherent scattered light and pixel crosstalk compared to FF illumination.
To quantitatively compare the incoherent scattered light between point-scanning, line-scanning, and FF-OCM systems, we performed Monte Carlo simulation to estimate the diffuse reflectance from the scattering media. Monte Carlo simulation was performed using Monte Carlo modeling of light transport in multilayered scattering media (MCML) [19] with a point pencil beam, and the result was convolved with line or area illumination patterns. Fig. 8(a)–(c) shows the en face surface diffuse reflectance pattern for point, line, and area illumination, respectively. From Fig. 8(d), it is clear that area illumination has the highest diffuse reflectance on the center, and point illumination has the lowest diffuse reflectance. Furthermore, we plot the diffuse reflectance for scattering coefficients from 10 to 100 cm−1 (relevant to most biological tissues), and this trend is maintained across the entire range of scattering media. Fig. 8(d) indicates the diffuse reflectance for line-field illumination is ~6.8 dB higher than point illumination, while FF illumination has ~17.9 dB higher diffuse scattering than point illumination, and ~11.1 dB higher than line-field illumination. This result agrees with the observed sensitivity trend outlined in Table I.
Fig. 8.
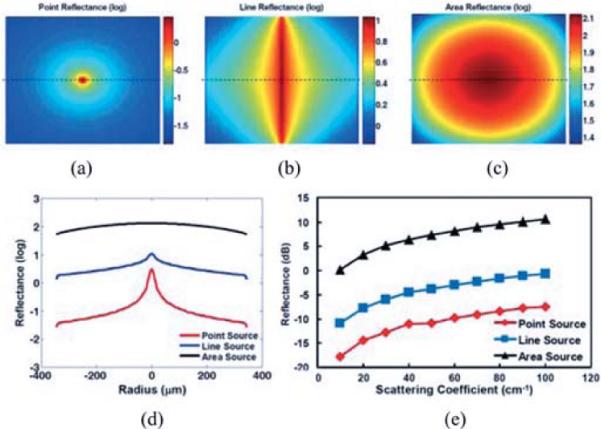
Diffuse reflectance (in log scale) of (a) point source illumination, (b) line-field illumination, and (c) FF illumination. (d) Reflectance (log scale) across the horizontal dotted line. (e) Reflectance for different tissue scattering coefficients from 10 to 100 cm−1.
In this study, we improved LS-OCM using an achromatic design for line-field generation. A sensitivity of 98 dB was achieved at the imaging speed of 516 lines/s. Normalized to the same image speed as shown in Table I (250 lines/s), it is equivalent to 101 dB, or 6 dB higher than our previously reported LS-OCM system. In addition, the illumination power on the sample is reduced from 25 to 15 mW. The improved sensitivity and the reduced illumination power are due to the narrower line focusing of achromatic lens (hence the improved power density per pixel) and the reduced incoherent scattered photons. Higher sensitivity is important because this enables a corresponding increase in imaging speeds.
Another factor determining the sensitivity is the camera's FWC. The camera we used for this study has only 180 ke FWC, typical of a silicon CCD camera, and averaging of 25 frames is necessary to achieve 98-dB sensitivity with imaging speed of 1.7 frames/s. Imaging speeds can be increased up to ~7 frames/s by using two integrating-bucket demodulation [20] and higher speed, 512 pixel CCD cameras. InGasAs cameras, in general, have an FWC an order of magnitude higher than silicon CCD cameras and previous studies have shown that FF-OCM using InGaAs cameras has superior performance [13]. Use of InGaAs cameras also enables operation at longer wavelengths to reduce scattering and achieve deeper imaging depth. Line-scan InGaAs cameras have the advantage that there are significantly lower cost than area InGaAs cameras.
V. Conclusion
This paper demonstrates LS-OCM using achromatic cylindrical lens to improve the line-field generation and detection sensitivity. A sensitivity of 98 dB was achieved at an imaging speed of 1.7 frames/s. Real-time cellular-resolution OCM imaging of scattering tissues was demonstrated using human colon specimens ex vivo. LS-OCM promises to enable in vivo imaging by reducing sensitivity to sample motion when compared with FF camera detection because phase-sensitive information is acquired rapidly before phase averaging effects occur. With future technology development, LS-OCM has the potential to be miniaturized for endomicroscopy imaging because only 1-D scanning is required. Compared with FF-OCM, LS-OCM has the advantage that line-field illumination reduces saturation effects from incoherent scattered light in biological tissues, enabling higher sensitivity and faster imaging speeds.
Acknowledgment
The authors would like to thank Dr. J. Connolly, M.D., Beth, Israel Deaconess Medical Center, Harvard Medical School, for providing specimens for this study, and Dr. A. Aguirre from MIT for helpful discussions.
The work of Y. Chen was supported by the Nano-Biotechnology Award of State of Maryland, the Prevent Cancer Foundation, the UMB-UMCP Seed Grant Program, the A. Ward Ford Memorial Institute Fund, and the National Institutes of Health R21-AR059325-01 and R21-EB012215-01A1. The work of J. G. Fujimoto was supported by the National Institutes of Health R01-CA75289-14, R01-EY11289-25, R01-HL095717-01, and R01-NS057476-02; the Air Force Office of Scientific Research FA9550-10-1-0551 and FA9550-10-1-0063. The work of C. Zhou was supported by the National Institutes of Health K99-EB010071-01A1.
Biographies

Yu Chen (M'07) received the B.S. degree in physics from Peking University, Beijing, China, in 1997, and the Ph.D. degree in bioengineering from the University of Pennsylvania, Philadelphia, in 2003.
He was a Postdoctoral Research Associate and Research Scientist at the Research Laboratory of Electronics, Massachusetts Institute of Technology, Cambridge. In 2007, he joined the Fischell Department of Bioengineering, University of Maryland, College Park, as an Assistant Professor. His current research interests include biophotonics imaging technologies (including optical coherence tomography, fluorescence molecular imaging and tomography, diffuse optical tomography, endomicroscopy, etc.) and their applications in biomedicine.
Dr. Chen is a member of the Optical Society of America, the International Society for Optical Engineering and a Fellow of the American Society for Laser Medicine and Surgery.

Shu-Wei Huang (S'10) received the B.S. degree from National Taiwan University, Taipei, Taiwan, in 2005, and the M.S. degree from the Massachusetts Institute of Technology, Cambridge, in 2008, both in electrical engineering, where he is currently working toward the Ph.D. degree.
His current research interests include coherent optical imaging technologies (including optical coherence microscopy, stimulated Raman scattering microscopy, etc.), ultrafast optical amplifiers (including chirped pulse amplifier, regenerative amplifier, optical parametric chirped pulse amplifier, etc.), and light-matter interactions (including high harmonic generation, direct electron acceleration, etc.).
Mr. Huang is a Student Member of the Optical Society of America.

Chao Zhou received the B.S. degree in physics from Peking University, Beijing, China, in 2001, and the Ph.D. degree in physics from the University of Pennsylvania, Philadelphia, in 2007.
Since August 2007, Dr. Zhou has been a Postdoctoral Associate at the Research Laboratory of Electronics, Massachusetts Institute of Technology, Cambridge. He has extensive experience in the field of biomedical optical imaging and has contributed to the development and validation of novel modalities for the imaging of humans and animals with various applications ranging from measuring the brain function to monitoring cancer treatments.
Dr. Zhou is a member of the Optical Society of America, the International Society for Optical Engineering, the Organization for Human Brain Mapping, and the International Society for Cerebral Blood Flow and Metabolism.
Benjamin Potsaid received the B.S., M.S., and Ph.D. degrees in mechanical engineering from Rensselaer Polytechnic Institute, Troy, NY, in 1999, 2002, and 2005, respectively.
He is currently a Research Scientist in the Advanced Imaging Group at Thorlabs, Inc., Newton, NJ. He also holds an appointment as a Research Scientist at the Research Laboratory of Electronics, Massachusetts Institute of Technology, Cambridge. His research interests include optomechatronic technologies with a focus on optical coherence tomography, microscopy, motion control, and adaptive optics.
Dr. Potsaid is a member of the International Society for Optical Engineering and Association for Research in Vision and Ophthalmology.

James G. Fujimoto (M'86–SM'91–F'96) was born in Chicago, IL, in 1957. He received the B.S., M.S., and Ph.D. degrees from the Massachusetts Institute of Technology (MIT), Cambridge, in 1979, 1981, and 1984, respectively.
Since 1985, he has been a Professor in the Department of Electrical Engineering and Computer Science, MIT. His research interests include femtosecond laser technology and biomedical optical imaging, including the development of optical coherence tomography.
Dr. Fujimoto is a Fellow of the Optical Society of America and the American Physical Society. He is also with the National Academy of Engineering, the National Academy of Sciences, and the American Academy of Arts and Sciences. He received the Discover Magazine Award for Technological Innovation in medical diagnostics in 1999, the Rank Prize in Optoelectronics in 2002, and the IEEE Streifer Award in 2002. He also received the Carl Zeiss Research Award in 2011. He was also the co-founder of Advanced Ophthalmic Devices and LightLab Imaging.
Footnotes
This paper has supplementary downloadable material available at http://ieeexplore.ieee.org, provided by the authors. Movie 1 shows the movie of en face LS-OCM images as the imaging plane is stepped into the tissue. Movie 2 further reveals the 3-D morphology of these two crypts and their adjacent goblet cells from different perspectives. These movies are in AVI format and are 1.72 and 1.78 MB in size.
REFERENCES
- [1].Huang D, Swanson EA, Lin CP, Schuman JS, Stinson WG, Chang W, Hee MR, Flotte T, Gregory K, Puliafito CA, Fujimoto JG. Optical coherence tomography. Science. 1991;254:1178–1181. doi: 10.1126/science.1957169. [DOI] [PMC free article] [PubMed] [Google Scholar]
- [2].Schmitt JM. Optical coherence tomography (OCT): A review. IEEE J. Sel. Topics Quantum Electron. 1999 Jul-Aug;5(4):1205–1215. doi: 10.1109/2944.796347. [DOI] [PMC free article] [PubMed] [Google Scholar]
- [3].Izatt JA, Hee MR, Owen GM, Swanson EA, Fujimoto JG. Optical coherence microscopy in scattering media. Opt. Lett. 1994;19:590–592. doi: 10.1364/ol.19.000590. [DOI] [PubMed] [Google Scholar]
- [4].Izatt JA, Kulkarni MD, Wang H-W, Kobayashi K, Sivak MV., Jr. Optical coherence tomography and microscopy in gastrointestinal tissues. IEEE J. Sel. Topics Quantum Electron. 1996 Dec.2(4):1017–1028. [Google Scholar]
- [5].Aguirre AD, Hsiung P, Ko TH, Hartl I, Fujimoto JG. High-resolution optical coherence microscopy for high-speed, in vivo cellular imaging. Opt. Lett. 2003;28:2064–2066. doi: 10.1364/ol.28.002064. [DOI] [PubMed] [Google Scholar]
- [6].Huang SW, Aguirre AD, Huber RA, Adler DC, Fujimoto JG. Swept source optical coherence microscopy using a Fourier domain mode-locked laser. Opt. Exp. 2007;15:6210–6217. doi: 10.1364/oe.15.006210. [DOI] [PubMed] [Google Scholar]
- [7].Aguirre AD, Chen Y, Bryan B, Mashimo H, Huang Q, Connolly JL, Fujimoto JG. Cellular resolution ex vivo imaging of gastrointestinal tissues with optical coherence microscopy. J. Biomed. Opt. 2010;15:016025-1–016025-9. doi: 10.1117/1.3322704. [DOI] [PMC free article] [PubMed] [Google Scholar]
- [8].Aguirre AD, Sawinski J, Huang SW, Zhou C, Denk W, Fujimoto JG. High speed optical coherence microscopy with autofocus adjustment and a miniaturized endoscopic imaging probe. Opt. Exp. 2010;18:4222–4239. doi: 10.1364/OE.18.004222. [DOI] [PMC free article] [PubMed] [Google Scholar]
- [9].Dubois A, Vabre L, Boccara A-C, Beaurepaire E. High-resolution full-field optical coherence tomography with a Linnik microscope. Appl. Opt. 2002;41:805–812. doi: 10.1364/ao.41.000805. [DOI] [PubMed] [Google Scholar]
- [10].Dubois A, Grieve K, Moneron G, Lecaque R, Vabre L, Boccara C. Ultrahigh-resolution full-field optical coherence tomography. Appl. Opt. 2004;43:2874–2883. doi: 10.1364/ao.43.002874. [DOI] [PubMed] [Google Scholar]
- [11].Dubois A, Moneron G, Grieve K, Boccara AC. Three-dimensional cellular-level imaging using full-field optical coherence tomography. Phys. Med. Biol. 2004;49:1227–1234. doi: 10.1088/0031-9155/49/7/010. [DOI] [PubMed] [Google Scholar]
- [12].Grieve K, Moneron G, Dubois A, Le Gargasson J-F, Boccara C. Ultrahigh resolution ex vivo ocular imaging using ultrashort acquisition time en face optical coherence tomography. J. Opt. A: Pure Appl. Opt. 2005;7:368–373. [Google Scholar]
- [13].Oh WY, Bouma BE, Iftimia N, Yun SH, Yelin R, Tearney GJ. Ultrahigh-resolution full-field optical coherence microscopy using InGaAs camera. Opt. Exp. 2006;14:726–735. doi: 10.1364/opex.14.000726. [DOI] [PubMed] [Google Scholar]
- [14].Oh WY, Bouma BE, Iftimia N, Yelin R, Tearney GJ. Spectrally-modulated full-field optical coherence microscopy for ultrahigh-resolution endoscopic imaging. Opt. Exp. 2006;14:8675–8684. doi: 10.1364/oe.14.008675. [DOI] [PMC free article] [PubMed] [Google Scholar]
- [15].Chen Y, Huang SW, Aguirre AD, Fujimoto JG. High-resolution line-scanning optical coherence microscopy. Opt. Lett. 2007;32:1971–1973. doi: 10.1364/ol.32.001971. [DOI] [PubMed] [Google Scholar]
- [16].Dubois A. Phase-map measurements by interferometry with sinusoidal phase modulation and four integrating buckets. J. Opt. Soc. Am. A-Opt. Image Sci. Vis. 2001;18:1972–1979. doi: 10.1364/josaa.18.001972. [DOI] [PubMed] [Google Scholar]
- [17].Wang TD, Mandella MJ, Contag CH, Kino GS. Dual-axis confocal microscope for high-resolution in vivo imaging. Opt. Lett. 2003;28:414–416. doi: 10.1364/ol.28.000414. [DOI] [PMC free article] [PubMed] [Google Scholar]
- [18].Specian RD, Oliver MG. Functional biology of intestinal goblet cells. Am. J. Physiol. 1991;260:C183–C193. doi: 10.1152/ajpcell.1991.260.2.C183. [DOI] [PubMed] [Google Scholar]
- [19].Wang LH, Jacques SL, Zheng LQ. MCML—Monte-Carlo modeling of light transport in multilayered tissues. Comput. Methods Programs Biomed. 1995;47:131–146. doi: 10.1016/0169-2607(95)01640-f. [DOI] [PubMed] [Google Scholar]
- [20].Grieve K, Dubois A, Simonutti M, Paques M, Sahel J, Le Gargasson JF, Boccara C. In vivo anterior segment imaging in the rat eye with high speed white light full-field optical coherence tomography. Opt. Exp. 2005;13:6286–6295. doi: 10.1364/opex.13.006286. [DOI] [PubMed] [Google Scholar]


