

Abstract

A cross-reactive array of polycyclic aromatic hydrocarbons and single wall carbon nanotube bilayers was designed for the detection of volatile organic compounds (tentatively, hexanal and 5-methyl-undecane) that identify the presence of disease in the exhaled breath of patients with multiple sclerosis. The sensors showed excellent discrimination between hexanal, 5-methyl-undecane, and other confounding volatile organic compounds. Results obtained from a clinical study consisting of 51 volunteers showed that the sensors could discriminate between multiple sclerosis and healthy states from exhaled breath samples with 85.3% sensitivity, 70.6% specificity, and 80.4% accuracy. These results open new frontiers in the development of a fast, noninvasive, and inexpensive medical diagnostic tool for the detection and identification of multiple sclerosis. The results could serve also as a launching pad for the discrimination between different subphases or stages of multiple sclerosis as well as for the identification of multiple sclerosis patients who would respond well to immunotherapy.
Keywords: Multiple sclerosis, diagnosis, breath, biomarker, polycyclic aromatic hydrocarbon, carbon nanotube
Multiple sclerosis (MS) is the most common chronic neurological disease affecting young adults, with onset usually between 20–40 years old, and is more frequent in women (3–4 times more than in men).1 The diagnosis of MS is based on clinical characteristics. The most commonly employed tool for confirmation of MS diagnosis is magnetic resonance imaging (MRI) of the brain and/or spinal cord.2 However, since MRI is an expensive procedure, diagnostic techniques based on biomarkers correlated with the disease state and activity are needed to support MS diagnosis and to assist in an informed decision for optimal treatment. In this regard, electrophoresis has been commonly used to test the cerebrospinal fluid (CSF) extracted by a lumbar puncture for detecting oligoclonal bands of immunoglobulin-G, which represent a biomarker present eventually (though not at early stages) in 75–85% of people with MS, and can provide evidence of inflammation of the central nervous system.2 Nonetheless, since this is an invasive procedure which produces discomfort to the patient and can cause a severe headache postpuncture,3 it is no longer among the first-line recommended procedures as part of confirmation of diagnosis in patients with clinical presentation suggestive of MS. Moreover, because it is invasive, this procedure is not an option for repeated sampling as part of routine follow-up.
A novel approach that overcomes many constraints of the conventional diagnostic techniques relies on the detection in exhaled breath samples of volatile organic compounds (VOCs) that are linked with a disease condition.4−16 In certain instances, breath analysis offers several potential advantages: (a) breath samples are noninvasive and easy to obtain; (b) breath contains less complicated mixtures than either serum or urine; and (c) breath testing has the potential for direct and real-time monitoring. This method has been explored in different fields of medicine such as respiratory medicine, uremia, and oncology (see refs (4, 5, and 10−13) and references therein). Some of the VOCs or their metabolic products are transmitted to the alveolar exhaled breath through exchange via the lung, even at the very onset of the disease.
Rapid progress has been made in recent years in the field of nanotechnology toward the standardization of breath sampling.10 This could lead to the development of efficient and cost-effective methods for diagnostic breath testing that could eventually be introduced into standard medical practice, together with diagnostic imaging tests and conventional biomarker monitoring in blood and cerebrospinal fluid. Thus, noninvasive detection of MS could be improved even in nonspecialist settings.
In this study, we report on a simple, portable sensing technology to detect MS and to differentiate between VOCs found in the breath of patients with MS relative to healthy controls. Our study was conducted in four phases and included 51 volunteers. Samples were collected from 37 MS patients and 18 healthy controls after conventional clinical diagnosis (see Methods). The clinical characteristics of the volunteers are listed in Supporting Information Table 1S.
In the first phase, we collected exhaled alveolar breath of MS patients and healthy subjects using an “offline” method.6−8,10 This method was designed to avoid potential errors arising from not being able to distinguish endogenous compounds from exogenous ones in the breath and to exclude nasal entrainment of the gas (see Methods).10
In the second phase, we identified the VOCs that can serve as biomarkers for MS in the breath samples and determined their relative composition, using gas chromatography linked with mass spectrometry (GC-MS) in conjugation with solid phase microextraction (SPME). GC-MS is the usual way of analyzing breath samples for compound identification, which is based on spectrum and retention times.17−19 Anyway, in spite of the recent advances in GC-MS analysis, it is most certain that these data do not account for all the VOCs present in the exhaled breath samples, because the preconcentration technique (e.g., SPME) can be thought as a solid phase that extracts only part of the VOCs present in the examined phase and, afterward, reveals only part of the extracted analytes.
GC-MS analysis identified over 600 different VOCs per breath sample. Two common VOCs, which appeared in statistically distinctive compositions in the two tested groups, were identified. These compounds are hexanal (p-value = 0.0362) and 5-methyl-undecane (p-value = 0.0353); see Table 1. The elevated concentrations of these two compounds in the breath of MS patients can be understood in terms of lipid peroxidation. Free radical-induced lipid peroxidation might play a role in the neurodegeneration that occurs in MS patients, and peroxidation leads to the formation of hexanal from omega-6 fatty acids.20 Methylated alkanes such as 5-methyl-undecane are also products of lipid peroxidation.21
Table 1. VOCs from Exhaled Breath That Showed a Significant Difference between Healthy and MS Subjects.
| tentative VOC name | m/z | retention time (s) | p-value |
|---|---|---|---|
| hexanal | 44 | 14.657 | 0.0362 |
| 5-methyl-undecane | 43 | 30.171 | 0.0353 |
In the third phase of this study, we designed bilayers composed of an underlying (semi)conductive random network of intersecting single-wall carbon nanotubes (SWCNTs) and an organic cap layer.22−25 The use of SWCNT random networks possesses several advantages: it eliminates conductivity variations due to the nanotubes’ chirality and geometry and is tolerant to individual SWCNT channel failure, because the device characteristics are averaged over a large number of nanotubes. The SWCNT layer was coated with a continuous cap layer (1–2 μm thickness) of one of the four polycyclic aromatic hydrocarbon (PAH) derivatives that were used in this study (see Figure 1).26−28 The PAH derivatives contain hydrophobic mesogens that are terminated with different alkyl chains and functional substituents, such as ether (PAH-1), ester (PAH-2), alcohol (PAH-3), or hydrophobic carbon chains (PAH-4). PAH-1, PAH-2, and PAH-3 have a PAH aromatic core with a carbon number of 42, while PAH-4 possesses a triangle-shaped core with a carbon number of 50. These PAH molecules are able to self-assemble into long molecular stacks with a large core and can easily form 3D, micrometer-sized, spongelike structures with a high surface-to-volume ratio (see Figure 2).26,29−32 Another important attribute is the ability of the PAH derivatives to detect VOCs in high humidity atmospheres,28 which represent the main component in the exhaled breath (∼80%).
Figure 1.

Discotic PAH derivatives employed in the study.
Figure 2.

Field emission scanning electron microscopy (FE-SEM) images of the sensing films made of PAH derivatives on top of random networks of SWCNTs: (a) PAH-1/SWCNT; (b) PAH-2/SWCNT; (c) PAH-3/SWCNT; and (d) PAH-4/SWCNT. As seen in the figure, the PAH derivatives were assembled in different nano- or microstructures, such as nanoropes (PAH-1), microflowers (PAH-2), nanocables with a winding pattern orientation (PAH-3), or nanocables with quasi-uniform orientation (PAH-4).
Exposing the PAH/SWCNT sensors to the two tentative VOCs found from the GS-MS study (i.e., hexanal and 5-methyl-undecane) and to other nine potentially interfering VOCs (see Methods) showed distinct patterns (see Figure 3). These differences can be attributed to the varying structures of the PAH assemblies that form the contact surface of the sensing material that are responsible for VOCs detection. The main observations emerging from sensing responses follow:
Figure 3.

Normalized change of sensor resistance at the middle of the exposure (S1) calculated from sensor responses to the 10 VOCs and water molecules analyzed at pa/po = 0.5 (see Methods section).
-
(i)
The PAH-1/SWCNT, PAH-2/SWCNT, and PAH-4/SWCNT sensors exhibited similar responses to hexanal and hexanol. In contrast, PAH-3/SWCNT sensors exhibited higher responses to hexanol than hexanal.
-
(ii)
All sensors showed pronounced responses to decane, octane, and hexane, but less to 5-methyl-undecane. The latter is possibly due to a lesser absorption of branched, longer chain alkanes into the PAH caplayers.
-
(iii)
All PAH/SWCNT sensors exhibited especially high responses upon exposure to ethyl benzene. For example, the responses of the PAH-1/SWCNT, PAH-2/SWCNT, and PAH-3/SWCNT sensors to ethyl benzene were more than twice as high as their response to the other VOCs studied. This can be understood in terms of a preferred absorption of ethyl benzene molecules due to the van der Waals interactions between their benzene rings and the fused benzene rings of the PAH corona.29−32
-
(iv)
The responses of PAH-1/SWCNT, PAH-2/SWCNT, and PAH-3/SWCNT sensors were relatively low (below 1.6%) upon exposure to water, compared to the other tested VOCs. This might be attributed to the hydrophobic nature of the mesogens. In the case of the PAH-4/SWCNT sensor, the hydrophobic effect of the PAH derivative was counteracted by the substantial distance between the nanocable-like PAH assemblies as well as their quasi-uniform orientation (see Figure 2).
-
(v)
The detection of the OH-terminated (polar) VOCs was promoted by the presence of oxygen atoms in the substituent functionality (i.e., PAH-1, PAH-2, and PAH-3); the longer the OH-terminated VOC, the lower the sensing signal. In light of this correlation, it is likely that the longer the OH-terminated VOC, the lower the adsorption in the PAH layer, most probably due to an increased steric effect. The response to octanol was very low (below 2.2% for all sensors), while almost no response to decanol was found.
The discrimination between the different VOCs was attempted employing a nine-class discriminant factor analysis (DFA), in which three measurements per VOC were used for calibration and one for testing (see Methods). Figure 4 shows the DFA plot obtained with the calibration measurements (represented by the symbols indicated in figure’s legend), while the test points (represented by star symbols in Figure 4) were blindly projected on the DFA model, without previous knowledge regarding their class. The samples with the concentration level pa/po = 0.09 were projected at the approximate DFA plot’s origin. Gradual movement from the plot’s center to the “periphery” indicates a gradual increase of the pa/po value. In this way, the closest points to the graph boundaries stand for the concentration level pa/po = 1. Importantly, the two VOC characteristics for MS patients (i.e., hexanal, pink circles; 5-methyl-benzene, magenta squares) showed very distinct patterns following singular west and southwest directions, respectively, which suggests that the PAH/SWCNT nanosensor system is specifically sensitive to those biomarkers in exhaled breath related to MS. Moreover, the other classes of VOCs tended also to group together, which further strengthens the classification potential of the sensor system that we have developed.
Figure 4.
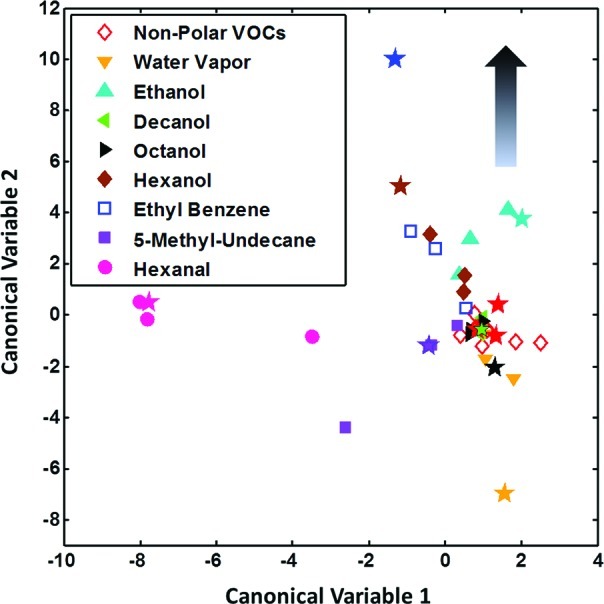
Nine-class DFA analysis performed with the features extracted from three PAH/SWCNT sensors (PAH-1/SWCNT, PAH-3/SWCNT, and PAH-4/SWCNT). A unique class was considered for the nonpolar VOCs because of the similar responses shown by the sensors to them (see Figure 3). For each analyte, three measurements were used for calibration (plotted using the symbols from figure’s legend) and one for testing (plotted using star symbols).
In the fourth phase of the study, the suitability of the PAH/SWCNT sensors for real-world applications was assessed by testing their ability to detect multiple sclerosis upon exposure to exhaled breath samples of patients with MS (see Methods). DFA models were built for MS classification, and the prediction of clinically suggestive MS diagnosis was estimated through leave-one-out cross-validation for real breath samples collected from 17 healthy volunteers and 34 MS volunteers (see Methods section). Table 2 summarizes the classification accuracy of the MS patients, obtained with the features extracted from the responses of two PAH/SWCNT sensors (i.e., PAH-1/SWCNT and PAH-3/SWCNT). The sensitivity, specificity, and accuracy of MS identification were found to be 85.3%, 70.6%, and 80.4%, respectively. The values obtained fulfill the criteria for a good diagnostic method, indicating that breath analysis using the PAH/SWCNT sensors could represent a powerful tool that can be applied for assessing MS. The accuracy of our system in assessing MS lies within the accuracy interval of the current method, based on biomarker detection related to this disease (75–85% obtained employing electrophoresis3), in addition to being an easy, noninvasive analysis method.
Table 2. Statistical Results for the Classification of MS and Possible Confounding Factors.
| MS vs healthy | smokers vs nonsmokers | male vs female | |
|---|---|---|---|
| TP | 29 | 6 | 9 |
| TN | 12 | 16 | 20 |
| FP | 5 | 15 | 12 |
| FN | 5 | 13 | 10 |
| sensitivity | 85.3% | 31.6% | 47.4% |
| specificity | 70.6% | 51.6% | 62.5% |
| accuracy | 80.4% | 44.0% | 56.9% |
To verify that the result obtained is not a consequence of casualty, classification of samples based on different possible confounding factors (such as smoking habits and gender) was also attempted. The accuracy of classifying smokers achieved 44%, while the accuracy of classifying the male volunteers achieved 56.9%. The results of these classifications are no more than normal probabilistic values, which clearly show that the PAH/SWCNT sensor system is sensitive only to those biomarkers in exhaled breath related to MS.
The discrimination between different phases (i.e., relapse-relapsing MS and progressive MS) or stages (i.e., relapse and remission) of the disease, as well as the identification of the MS patients who respond well to immunotherapy, will be attempted in future studies. A comparison with other autoimmune diseases (such as diabetes) and other brain diseases (such as Parkinson’s) will be made in the context of a fuller study.
In summary, we have developed a cross-reactive array based on bilayers of single-wall carbon nanotubes and synthetically designed polycyclic aromatic hydrocarbon derivatives having various aromatic coronae and side groups. We have demonstrated the potential of the sensor array to discriminate between VOCs that are associated with multiple sclerosis (tentatively, hexanal and 5-methyl-undecane). Additionally, we have shown that multiple sclerosis can be identified by analyzing breath samples, by selecting the most suitable polycyclic aromatic hydrocarbons derivatives for this application. Classification success (85.3% sensitivity, 70.6% specificity, and 80.4% accuracy) achieved was similar to the currently available invasive and/or expensive techniques. The results presented here open new frontiers in the development of fast, noninvasive, and inexpensive medical diagnosis tools for detection of chronic neurological diseases.
Methods
Synthesis of PAH Derivatives
The synthesis of PAH-1,31 PAH-2,32 and PAH-429 was described in previous reports. The synthesis of PAH-3 will be reported elsewhere.
Materials Characterization
Field emission scanning electron microscopy studies were performed using a Carl Zeiss Ultra Plus FE-SEM instrument. The magnification during this study was set to values varying between 10 000 and 100 000. An accelerating voltage of 1 kV was employed.
Test Samples
Volatile Organic Compounds
Ten VOCs (containing ∼5% relative humidity (RH)) and water vapor, in different concentrations (pa/po = 0.09; 0.2; 0.5; and 1, where pa stands for the partial pressure of the VOC and po for the saturated vapor pressure at 21 °C), have been analyzed. Water is a polar compound (dipole moment: 1.85 D) that usually screens the VOC signals in mixtures of VOCs and water.33 For the current study, DI water (18.2 MΩ·cm) was supplied via a commercial water purification system (Easy Pure II). Hexanal and 5-methyl-undecane were used because they were found from GC-MS studies to be characteristic of the breath samples of MS patients. Hexane, octane, and decane (all obtained from Sigma Aldrich Ltd.) were used as representative examples for nonpolar alkane hydrocarbons (dipole moment: 0 D). Ethyl benzene (Sigma Aldrich Ltd.) was used as a representative example for aromatic VOCs (dipole moment: 0.4 D). Hexanol (dipole moment: 1.42 D), octanol (dipole moment: 2D), decanol (dipole moment: 1.68 D), and ethanol (dipole moment: 1.684 D), all received from Sigma Aldrich Ltd., were used as representative cases for polar VOCs.
Breath Samples
A total of 34 MS patients with confirmed clinical diagnosis according to the diagnostic criteria of McDonald and Poser with follow-up at the MS Center, Carmel Medical Center (Haifa, Israel) and 17 healthy control subjects were recruited for this study. Alveolar breath of the 51 volunteers (see Supporting Information Table1S) was collected using an “offline” method that effectively separates the endogenous from the exogenous breath volatile biomarkers and excludes the nasal entrainment.10 Two bags of 750 mL of breath samples per volunteer were collected in inert Mylar bags (Eco Medics, Duerten, Switzerland). Vapor sampling was performed by extended breath sampling into the collection apparatus for 15–20 min, with several stops during this process. The first 3 min of breath sampling were discarded due to the possible contamination of the upper respiratory air. The subsequent deep air was retained for testing purposes. The samples were collected with a tube that was introduced in the volunteer’s mouth and connected to the collection bag. All participants provided signed informed consent to this study, which was performed following the approval and according to the guidelines of the Helsinki Committee of Carmel Medical Center and Technion’s committee for supervision of experiments in humans. The clinical trial was registered at ClinicalTrials.gov (registration no.: NCT01206023).
Chemical Analysis of the Breath Samples
Gas-chromatography/mass-spectrometry (GCMS-QP2010; Shimadzu Corporation, Japan), combined with a thermal desorption system (TD20; Shimadzu Corporation, Japan), was used for the chemical analysis of the breath samples. A Tenax TA adsorbent tube (Sigma Aldrich Ltd.) was employed for preconcentrating the VOCs in the breath samples. Using a custom-made pump system, the breath samples from the Mylar bags were sucked up through the TA tube at 100 mL/min flow rate, being then transferred to a thermal desorption (TD) tube (Sigma Aldrich Ltd.) before being analyzed by GC-MS. The following oven temperature profile was set: (a) 10 min at 35 °C; (b) 4 °C/min ramp until 150 °C; (c) 10 °C/min ramp until 300 °C; and (d) 15 min at 300 °C. An SLB-5 ms capillary column (Sigma Aldrich Ltd.) with 5% phenyl methyl siloxane (30 m length, 0.25 mm internal diameter, and 0.5 μm thickness) was employed. The splitless injection mode was used for 2 min, at 30 cm/s constant linear speed and 0.70 mL/min column flow. The molecular structures of the VOCs were determined via the standard modular set, using 10 ppm isobutylene (Calgaz, Cambridge, MD) as standard calibration gas during each run. GC-MS chromatogram analysis was realized using the GCMS solutions version 2.53SU1 postrun analysis program (Shimadzu Corporation), employing the National Institute of Standards and Technology (NIST) compounds library (Gaithersburg, MD).
Sensing Measurements
An automated system controlled by a custom LabView (National Instruments) program was used to perform the sensing measurements. The sensors were tested simultaneously, in the same exposure chamber, using an Agilent 34980A multifunction switch. A Stanford Research System SR830 DSP lock-in amplifier controlled by an IEEE 488 bus was used to supply the AC voltage signal (0.2 V at 1 kHz) and to measure the corresponding current (<10 μA in the studied devices). This setup allows for measuring normalized changes in conductance as small as 0.01%. Sensors resistance was continuously acquired during the experiments. Sensing experiments were continuously performed using subsequent exposure cycles (see Supporting Information section 2).
Data Analysis
Features Extraction
For VOC analysis, three parameters were extracted: (i) the normalized change of sensor resistance at the middle of the exposure (S1); (ii) the normalized change of sensor resistance at the end of the exposure (S2); and (iii) the area under the response curve (S3). S1 and S2 were calculated with regard to the value of sensor resistance prior to the exposure. A linearization process was applied before feature extraction, in order to counteract sensor drift (see Supporting Information section 2.1). For breath analysis, two parameters were extracted (either to the control VOC or to each release of breath sample): (i) the normalized change of sensors resistance soon after the exposure (S4) and (ii) the normalized change of sensors resistance at the middle of the exposure (S5). S4 and S5 were calculated with regard to the value of sensor resistance prior to the exposure. A compensation and calibration process was posteriorly applied to these parameters to retain from sensor responses only that information related to their response to the VOCs from the breath samples (see Supporting Information section 2.2). The mean values of the parameters obtained over the successive exposures to the same sample were then calculated.
Pattern Recognition
Data classification was attempted by employing the discriminant factor analysis (DFA) algorithm.34,35 DFA is a supervised linear method that is supplied with the classification information regarding every measurement in the training set. DFA finds new orthogonal axes (canonical variables) as a linear combination of the input variables, computing these factors to minimize the variance within each class and maximize the variance between classes. The prediction accuracy was calculated employing the leave-one-out cross-validation method. Given n measurements, the pattern recognition model was computed n times using n – 1 training vectors. The vector left out during the training phase (i.e., validation vector, which is unseen by the algorithm during the training phase, so completely new for the model built) was then projected onto the model built, producing a classification result. All possibilities of leave-one-sample-out were considered, and the classification accuracy was estimated as the averaged performance over the n tests. Identification sensitivity and specificity were also calculated through the leave-one-out cross-validation, based on the number of true positive (TP), true negative (TN), false positive (FP), and false negative (FN) estimations (eq 1).
 |
1 |
Pattern recognition was conducted under the MATLAB (MathWorks) environment.
Statistical Test
The statistical test for determining the VOCs that show significant difference between healthy and sick subjects was based on the p-value calculated using a parametric test assuming normal distribution of the data (Student's t test). The lower the p-value, the more significant the difference between the two groups. A cut-off p-value of 0.05 shows a significant difference between the groups. The statistical test was performed using JMP, version 9.0.0 (SAS Institute Inc., Cary, NC).
Acknowledgments
The authors thank Ms. Meital Segev (Technion) for technical assistance with the FE-SEM measurements, Rotem Ronen and Sara Dishon for assisting the patients and providing support at the clinic, and Dr. Ulrike (Mirjam) Tisch (Technion) for constructive comments on the paper.
Glossary
Abbreviations
- PAH
polycyclic aromatic hydrocarbons
- MS
multiple sclerosis
- MRI
magnetic resonance imaging
- SWCNTs
single-wall carbon nanotubes
- VOC
volatile organic compound
- FE-SEM
field emission surface electron microscopy
- DFA
discriminant factor analysis
- TP
true positive
- TN
true negative
- FP
false positive
- FN
false negative
Author Contributions
R.I. conceived and performed the data analysis, built the classification models, did the FE-SEM analysis, presented the results, and drafted the manuscript. Y.B. performed the GC-MS analysis and together with H.B. and D.S. performed the breath sample tests and extracted the features from the sensor responses to the breath samples. Y.Z. fabricated the sensors and realized the VOCs measurements. X.F. and K.M. fabricated the PAH derivatives. A.M. participated in conceiving the study concept and together with L.G.-M. participated in the design, carry-out, and analysis of the clinical aspects of the study. H.H. conceived and coordinated the project.
Supporting Information Available
(1) Fabrication of sensors; (2) sensing responses and features extraction; (3) clinical data of volunteers. This material is available free of charge via the Internet at http://pubs.acs.org.
Author Contributions
⊥ Authors have equal contribution to the manuscript.
Supplementary Material
References
- Compston A.; Coles A. (2008) Multiple Sclerosis. Lancet 372, 1502–1517. [DOI] [PubMed] [Google Scholar]
- Link H.; Huang Y. M. (2006) Oligoclonal bands in Multiple Sclerosis cerebrospinal fluid: an update on methodology and clinical usefulness. J. Neuroimmunol. 180, 17–28. [DOI] [PubMed] [Google Scholar]
- Seehusen D. A.; Reeves M. M.; Fomin D. A. (2003) CSF analysis. Am. Fam. Physician 68, 1103–1108. [PubMed] [Google Scholar]
- Tisch U.; Haick H. (2011) Arrays of chemisensitive monolayer-capped metallic nanoparticles for diagnostic breath testing. Rev. Chem. Eng. 26, 171–179. [Google Scholar]
- Tisch U.; Haick H. (2010) Nanomaterials for cross-reactive sensor arrays. MRS Bull. 35, 797–803. [Google Scholar]
- Hakim M.; Billan S.; Tisch U.; Peng G.; Dvrokind I.; Abdah-Bortnyak R.; Kuten A.; Haick H. (2011) Diagnosis of head-and-neck-cancer from exhaled breath. Br. J. Cancer 104, 1649–1655. [DOI] [PMC free article] [PubMed] [Google Scholar]
- Peng G.; Hakim M.; Broza Y. Y.; Billan S.; Abdah-Bortnyak R.; Kuten A.; Tisch U.; Haick H. (2010) Detection of lung, breast, colorectal, and prostate cancers from exhaled breath using a single array of nanosensors. Br. J. Cancer 103, 542–551. [DOI] [PMC free article] [PubMed] [Google Scholar]
- Peng G.; Tisch U.; Adams O.; Hakim M.; Shehada N.; Broza Y. Y.; Billan S.; Abdah-Bortnyak R.; Kuten A.; Haick H. (2009) Diagnosing lung cancer in exhaled breath using gold nanoparticles. Nat. Nanotechnol. 4, 669–673. [DOI] [PubMed] [Google Scholar]
- Shuster G.; Gallimidi Z.; Heyman-Reiss A.; Dovgolevsky E.; Billan S.; Abdah-Bortnyak R.; Kuten A.; Engel A.; Shiban A.; Tisch U.; Haick H. (2010) Classification of breast cancer precursors through exhaled breath. Breast Cancer Res. Treat. 126, 791–796. [DOI] [PubMed] [Google Scholar]
- Amann A.; Miekisch W.; Pleil J.; Risby T.; Schubert J. (2010) Chapter 7: Methodological issues of sample collection and analysis of exhaled breath. Europ. Respir. Soc. Monogr. 49, 96–114. [Google Scholar]
- Martin A. N.; Farquar G. R.; Jones A. D.; Frank M. (2010) Human breath analysis: methods for sample collection and reduction of localized background effects. Anal. Bioanal. Chem. 396, 739–750. [DOI] [PubMed] [Google Scholar]
- Buszewski B.; Kesy M.; Ligor T.; Amann A. (2007) Human exhaled air analytics: biomarkers of diseases. Biomed. Chromatogr. 21, 553–566. [DOI] [PubMed] [Google Scholar]
- Amann A.; Poupart G.; Telser S.; Ledochowski M.; Schmid A.; Mechtcheriakov S. (2004) Applications of breath gas analysis in medicine. Int. J. Mass Spectrom. 239, 227–233. [Google Scholar]
- King J.; Koc H.; Unterkofler K.; Mochalski P.; Kupferthaler A.; Teschl G.; Teschl S.; Hinterhuber H.; Amann A. (2010) Physiological modeling of isoprene dynamics in exhaled breath. J. Theor. Biol. 267, 626–637. [DOI] [PubMed] [Google Scholar]
- King J.; Kupferthaler A.; Unterkofler K.; Koc H.; Teschl S.; Teschl G.; Miekisch W.; Schubert J.; Hinterhuber H.; Amann A. (2009) Isoprene and acetone concentration profiles during exercise on an ergometer. J. Breath Res. 3, 027006. [DOI] [PubMed] [Google Scholar]
- King J.; Mochalski P.; Kupferthaler A.; Unterkofler K.; Koc H.; Filipiak W.; Teschl S.; Hinterhuber H.; Amann A. (2010) Dynamic profiles of volatile organic compounds in exhaled breath as determined by a coupled PTR-MS/GC-MS study. Physiol. Meas. 31, 1169–1184. [DOI] [PubMed] [Google Scholar]
- Bajtarevic A.; Ager C.; Pienz M.; Klieber M.; Schwarz K.; Ligor M.; Ligor T.; Filipiak W.; Denz H.; Fiegl M.; Hilbe W.; Weiss W.; Lukas P.; Jamnig H.; Hackl M.; Haidenberger A.; Buszewski B.; Miekisch W.; Schubert J.; Amann A. (2009) Noninvasive detection of lung cancer by analysis of exhaled breath. BMC Cancer 9, 348. [DOI] [PMC free article] [PubMed] [Google Scholar]
- Filipiak W.; Sponring A.; Filipiak A.; Ager C.; Schubert J.; Miekisch W.; Amann A.; Troppmair J. (2010) TD-GC-MS Analysis of Volatile Metabolites of Human Lung Cancer and Normal Cells In vitro. Cancer Epidemiol., Biomarkers Prev. 19, 182–195. [DOI] [PubMed] [Google Scholar]
- Ligor M.; Ligor T.; Bajtarevic A.; Ager C.; Pienz M.; Klieber M.; Denz H.; Fiegl M.; Hilbe W.; Weiss W.; Lukas P.; Jamnig H.; Hackl M.; Buszewski B.; Miekisch W.; Schubert J.; Amann A. (2009) Determination of volatile organic compounds in exhaled breath of patients with lung cancer using solid phase microextraction and gas chromatography mass spectrometry. Clin. Chem. Lab. Med. 47, 550–560. [DOI] [PubMed] [Google Scholar]
- Jaar V.; Ste-Marie L.; Montgomery J. A. (1999) Striatal metabolism of hexanal, a lipid peroxidation product, in the rat. Metab. Brain Dis. 14, 71–82. [DOI] [PubMed] [Google Scholar]
- Phillips M.; Cataneo R. N.; Greenberg J.; Grodman R.; Gunawardena R.; A. N. (2003) Effect of oxygen on breath markers of oxidative stress. Eur. Respir. J. 21, 48–51. [DOI] [PubMed] [Google Scholar]
- Snow E. S.; Perkins F. K.; Houser E. J.; Badescu S. C.; Reinecke T. L. (2005) Chemical detection with a single-walled carbon nanotube capacitor. Science 307, 1942–1945. [DOI] [PubMed] [Google Scholar]
- Peng G.; Tisch U.; Haick H. (2009) Detection of nonpolar molecules by means of carrier scattering in random networks of carbon nanotubes: toward diagnosis of diseases via breath samples. Nano Lett. 9, 1362–1368. [DOI] [PubMed] [Google Scholar]
- Peng G.; Trock E.; Haick H. (2008) Detecting simulated patterns of lung cancer biomarkers by random network of single-walled carbon nanotubes coated with nonpolymeric organic materials. Nano Lett. 8, 3631–3635. [DOI] [PubMed] [Google Scholar]
- Haick H.; Hakim M.; Patrascu M.; Levenberg C.; Shehada N.; Nakhoul F.; Abassi Z. (2009) Sniffing chronic renal failure in rat model by an array of random networks of single-walled carbon nanotubes. ACS Nano 3, 1258–1266. [DOI] [PubMed] [Google Scholar]
- Zilberman Y.; Tisch U.; Pisula W.; Feng X.; Mullen K.; Haick H. (2009) Spongelike structures of hexa-peri-hexabenzocoronene derivatives enhance the sensitivity of chemiresistive carbon nanotubes to nonpolar volatile organic compounds of cancer. Langmuir 25, 5411–5416. [DOI] [PubMed] [Google Scholar]
- Zilberman Y.; Tisch U.; Shuster G.; Pisula W.; Feng X.; Müllen K.; Haick H. (2010) Carbon nanotube/hexa-peri-hexabenzocoronene bilayers for discrimination between nonpolar volatile organic compounds of cancer and humid atmospheres. Adv. Mater. 22, 4317–4320. [DOI] [PubMed] [Google Scholar]
- Zilberman Y.; Ionescu R.; Feng X.; Müllen K.; Haick H. (2011) A nano array of polycyclic aromatic hydrocarbons and carbon nanotubes for accurate and predictive detection in real-world environmental humidity. ACS Nano 5, 6743–6753. [DOI] [PubMed] [Google Scholar]
- Feng X. L.; Liu M. Y.; Pisula W.; Takase M.; Li J. L.; Müllen K. (2008) Supramolecular organization and photovoltaics for triangle-shaped discotics with swallow-tails. Adv. Mater. 14, 2684–2689. [DOI] [PubMed] [Google Scholar]
- Feng X. L.; Marcon V.; Pisula W.; Hansen M. R.; Kirkpatrick J.; Andrienko D.; Kremer K.; Müllen K. (2009) Towards high charge-carrier mobilities by rational design of the shape and periphery of discotics. Nat. Mater. 8, 421–426. [DOI] [PubMed] [Google Scholar]
- Feng X. L.; Pisula W.; Kudernac T.; Wu D. Q.; Zhi L. J.; De Feyter S.; Müllen K. (2009) Controlled self-assembly of C3-symmetric hexa-peri-hexabenzocoronenes with alternating hydrophilic and hydrophobic substituents in solution, in the bulk, and on a surface. J. Am. Chem. Soc. 131, 4439–4448. [DOI] [PubMed] [Google Scholar]
- Feng X. L.; Pisula W.; Zhi L. J.; Takase M.; Müllen K. (2008) Controlling the columnar orientation of C3-symmetric “superbenzenes” through alternating polar/apolar substitutents. Angew. Chem., Int. Ed. 47, 1703–1706. [DOI] [PubMed] [Google Scholar]
- Roeck F.; Barsan N.; Weimar U. (2008) Electronic nose: Current status and future trends. Chem. Rev. 108, 705–725. [DOI] [PubMed] [Google Scholar]
- Brereton R. G. (1990) Chemometrics, application of mathematics and statistics to laboratory systems, Ellis Horwood, Chichester, UK. [Google Scholar]
- Ionescu R.; Llobet E.; Vilanova X.; Brezmes J.; Suerias J. E.; Calderer J.; Correig X. (2002) Quantitative analysis of NO2 in the presence of CO using a single tungsten oxide semiconductor sensor and dynamic signal processing. Analyst 127, 1237–1246. [DOI] [PubMed] [Google Scholar]
Associated Data
This section collects any data citations, data availability statements, or supplementary materials included in this article.