

Abstract
A novel series of rhodanin (RH) and thiohydantoin (TH) derivatives were designed and synthesized for detecting tau pathology in the brains of patients with Alzheimer’s disease (AD). In experiments in vitro using tau and β-amyloid (Aβ) aggregates, the TH derivative, TH2, showed high specific binding to tau aggregates. In hippocampal sections obtained from AD patients, TH2 intensely stained neurofibrillary tangles. In experiments using normal mice, [125I]TH2 showed good uptake (1.54%ID/g, 2 min postinjection) into and a rapid washout (0.25%ID/g, 60 min postinjection) from the brain. [123I]TH2 should be further investigated as a potential imaging agent for detecting tau pathology.
Keywords: Alzheimer’s disease, tau, imaging, rhodanine, thiohydantoin
Alzheimer’s disease (AD) is a progressive neurodegenerative disorder characterized by abundant senile plaques (SPs) composed of β-amyloid (Aβ) peptides and numerous neurofibrillary tangles (NFTs) formed by filaments of highly phosphorylated tau proteins in the brain.1 Currently, only the definitive confirmation of AD is dependent on a post-mortem histopathological examination of SPs and NFTs in the brain. Therefore, in vivo imaging of SPs and/or NFTs in the living brain with noninvasive techniques such as positron emission tomography (PET) and single photon emission computed tomography (SPECT) could lead to the presymptomatic detection of AD and new antiamyloid therapies.2−4
Extensive research has been undertaken to develop radiolabeled Aβ imaging agents for targeting SPs. Clinical trials with [18F]FDDNP,5,6 [11C]6-OH-BTA-1,7,8 [11C]SB-13,9,10 [18F]BAY94−9172,11,12 [11C]BF227,13 [123I]IMPY,14−17 [18F]AV-45,18−20 [11C]AZD2184,21 and [18F]AZD469422 indicate the imaging of Aβ plaques in living brain tissue to be useful for the diagnosis of AD.
While many PET/SPECT probes for SPs or Aβ plaques have been developed, few compounds for targeting NFTs have been reported. Previous neuropathological research suggests that the deposition of NFTs occurs before the manifestation of clinical symptoms in AD. These reports suggest that even in the very early stages of AD, patients display considerable numbers of NFTs in the entorhinal cortex and hippocampus, sufficient for a neuropathological diagnosis. Furthermore, NFT deposition in the entorhinal cortex is closely related with neuronal loss in very early AD patients.23−26 Thus, in vivo imaging of NFTs in conjunction with the imaging of Aβ plaques is thought to be useful for the early and accurate diagnosis of AD. A quantitative evaluation of tau pathology could also be helpful for tracking the severity of dementia, because the pathology correlates well with the clinical severity of dementia.
Some papers have reported that FDDNP,27 FSB,28 and curcumin (29) can bind to not only NFTs but also Aβ plaques in the brain. Quinoline and benzimidazole derivatives are also reported as candidate probes for in vivo imaging of tau pathology in AD.30 However, these compounds are not completely specific to tau, because they also bind to Aβ plaques. Currently, no PET/SPECT imaging agents targeting NFTs exist that allow an evaluation of tau pathology in AD brains.
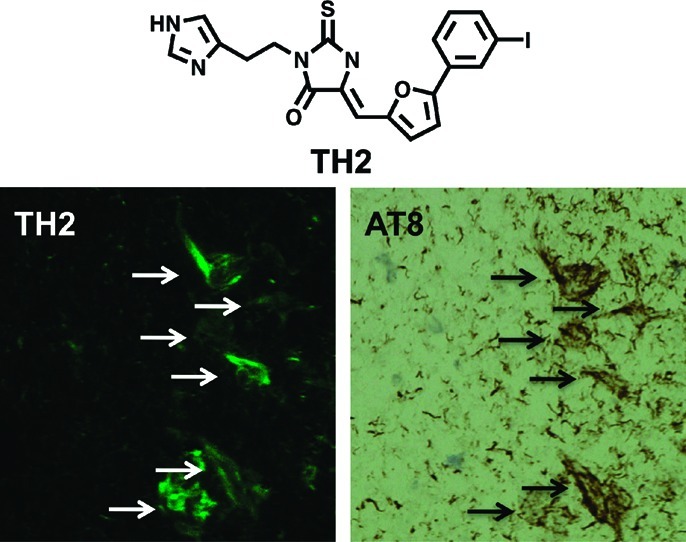
Recently, the effects of rhodanine and thiohydantoin derivatives on the formation, extension, and destabilization of tau aggregates were studied in vitro.31 These derivatives dose-dependently inhibited the formation of tau aggregates as well as destabilized preformed tau aggregates, indicating that they could directly bind or interact with the aggregates. In the present study, we designed and synthesized three novel radioiodinated rhodanine and thiohydantoin derivatives (Figure 1) and evaluated their biological activities as in vivo NFT imaging agents. To our knowledge, this is the first time the use of rhodanine and thiohydantoin derivatives in vivo as probes to detect tau pathology in the AD brain has been proposed.
Figure 1.

Chemical structure of rhodanine and thiohydantoin derivatives reported in this study.
Results and Discussion
Chemistry
The synthesis of the rhodanine and thiohydantoin derivatives was outlined in Scheme 1. The key step in the formation of the rhodanine and thiohydantoin backbone was achieved by a Knoevenagel condensation reaction between aromatic aldehydes and the rhodanine or thiohydantoin core. The aromatic aldehydes (1 and 8) necessary for the Knoevenagel condensation reaction were obtained by Suzuki coupling between haloaromatics and functionalized boronic acid. The rhodanin and thiohydantoin cores (2, 3, and 6) were produced by the reaction of glycine ethyl ester or histamine with bis(carboxymethyl)trithiocarbonate or ethyl isothiocyanotoacetate in the presence of Et3N. The target compounds (4 (rhodanin 1 (RH1)), 5 (thiohydantoin 1 (TH1)) and 7 (TH2)) were obtained by the Knoevenagel condensation reaction of the aromatic aldehyde (1) with the rhodanin and thiohydantoin cores (2, 3, and 6) in yields of 76, 44, and 51%, respectively. The tributyltin derivative (9) was prepared from the corresponding bromo compound (8) using a bromo to tributyltin exchange reaction catalyzed by Pd(0) in a yield of 40%. The tributyltin derivatives (10, 11, and 12) were obtained by the Knoevenagel condensation reaction and used as precursors for radioiodination in the preparation of [125I]RH1, [125I]TH1, and [125I]TH2. Novel radioiodinated rhodanine and thiohydantoin derivatives were obtained with an iododestannylation reaction using hydrogen peroxide as the oxidant, which produced the desired radioiodinated ligands. It was anticipated that the no-carrier-added preparation would result in a final product bearing a theoretical specific activity similar to that of 125I (81.4 TBq/mmol). The radiochemical identities of the radioiodinated ligands were verified by coinjection with nonradioactive compounds from their HPLC profiles. The final radioiodinated compounds [125I]RH1, [125I]TH1, and [125I]TH2 showed a single peak of radioactivity at the retention times of 9.4 min (CH3CN/H2O = 4:1), 15.7 min (CH3CN/H2O = 3:2), and 10.5 min (CH3CN/H2O = 3:1), respectively. The three products were obtained in 8−22% radiochemical yields with a radiochemical purity of >95% after purification by HPLC.
Scheme 1.

To quantify the affinity of the rhodanine and thiohydantoin derivatives for tau aggregates, we carried out assays with thioflavin S as a competing ligand. These derivatives displaced thioflavin S in a dose-dependent manner, indicating that they have affinity for tau aggregates. In addition, this result suggests that these derivatives may occupy a binding site on tau aggregates similar to that of thioflavin S. The Ki values for RH1, TH1, and TH2 were 489, 155, and 64 nM, respectively (Table 1). Discrimination between tau and Aβ aggregates in the brain is required for the development of NFT-specific agents. To compare the affinity between tau and Aβ aggregates, we also carried out assays with thioflavin S as a competing ligand. RH1, TH1, and TH2 showed Ki values of 752, 864, and 469 nM, respectively, for Aβ aggregates. The ratio of Ki values for tau and Aβ aggregates was 1.54, 5.57, and 7.33 for RH1, TH1, and TH2, respectively, indicating that these derivatives displayed higher binding to tau aggregates than Aβ aggregates. The result also suggests the thiohydantoin derivatives to be more NFT-selective than the rhodanine derivatives.
Table 1. Inhibition of Thioflavin S Binding to Tau Aggregates or Aβ42 Aggregates.
|
Ki (nM)a |
||
|---|---|---|
| compounds | tau | Aβ42 |
| RH1 | 489 ± 62 | 752 ± 128 |
| TH1 | 155 ± 14 | 864 ± 147 |
| TH2 | 64 ± 7 | 469 ± 60 |
Values are the mean ± standard error of the mean for three independent experiments.
Further investigation of the binding to tau aggregates was performed by size exclusion chromatography. A high level of radioactivity was eluted in the fraction corresponding to the tau aggregates after the incubation with [125I]RH1, [125I]TH1, and [125I]TH2 (Figure 2). Conversely, little radioactivity was observed in the fraction corresponding to monomeric tau. The results suggest that these agents bind to tau aggregates not to tau monomers, as reflected by the inhibition assays.
Figure 2.
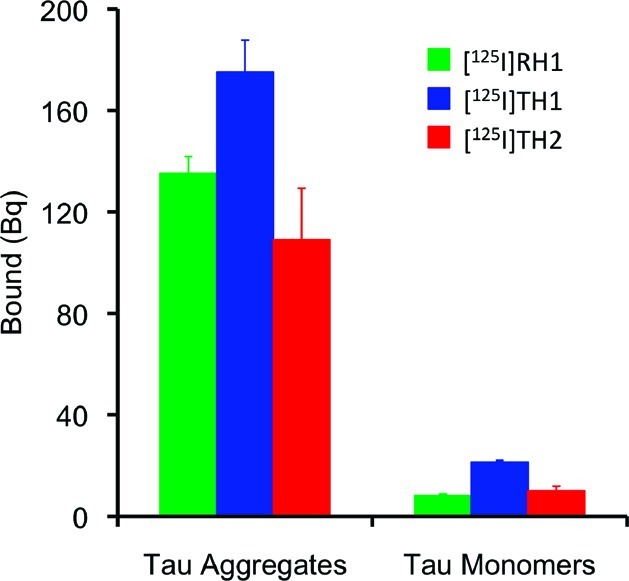
Binding of [125I]RH1, [125I]TH1, and [125I]TH2 to tau aggregates and tau monomers.
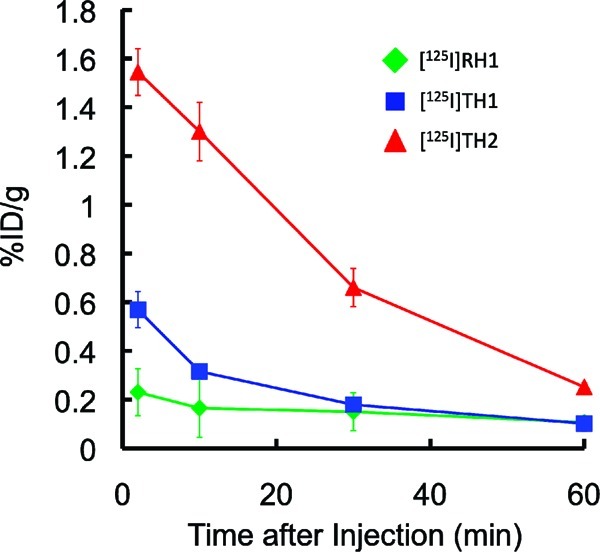
The biodistribution of the radioiodinated compounds ([125I]RH1, [125I]TH1, and [125I]TH2) was evaluated in normal mice (Table 2). A biodistribution study provides important information on brain uptake. The ideal NFT imaging agent should penetrate the blood−brain barrier well enough to deliver a sufficient dose into the brain while achieving rapid clearance from normal regions to result in a higher signal-to-noise ratio in the AD brain. The initial uptake of [125I]TH2 at 2 min after the iv injection was relatively high (1.54%ID/g), whereas the retention at later time points was low (0.25%ID/g at 60 min post iv injection). These properties (a high initial uptake and fast washout from the normal mouse brain) suggest [125I]TH2 to be a promising NFT imaging agent in the brain. On the other hand, [125I]RH1 and [125I]TH1 did not show marked initial uptake in the brain after iv injection (0.23 and 0.57%ID/g at 2 min postinjection, respectively), though the level of radioactivity in blood was similar to that for [125I]TH2. To directly compare the uptake and washout rates of [125I]RH1, [125I]TH1, and [125I]TH2, a combined plot is presented in Figure 3. The pharmacokinetics of [125I]TH2 may provide a better pattern for the distribution of tau in AD brains. Although many factors such as molecular size, ionic charge, and lipophilicity affect the uptake of a compound into the brain, the lower lipophilicity of [125I]TH2 may be one reason for the higher uptake of [125I]TH2. We selected TH2 with high specific binding to tau aggregates and favorable pharmacokinetics in the mouce brain, for additional studies.
Table 2. Biodistribution of Radioactivity after Intravenous Administration of [125I]RH1, [125I]TH1, and [125I]TH2 in Micea.
| time after injection (min) |
||||
|---|---|---|---|---|
| tissue | 2 | 10 | 30 | 60 |
| [125I]RH1 | ||||
| blood | 6.70 (0.53) | 3.58 (0.37) | 2.27 (0.44) | 1.59 (0.14) |
| liver | 43.06 (2.07) | 29.52 (2.17) | 14.74 (2.27) | 11.30 (0.87) |
| kidney | 8.50 (0.83) | 7.64 (0.69) | 6.42 (1.17) | 3.91 (0.18) |
| intestine | 1.77 (0.33) | 7.97 (1.24) | 15.07 (1.82) | 21.03 (2.73) |
| spleen | 6.70 (0.54) | 4.11 (0.80) | 2.66 (0.84) | 1.94 (0.40) |
| pancreas | 1.74 (0.19) | 1.75 (0.18) | 1.6 (0.17) | 0.73 (0.08) |
| heart | 9.41 (0.49) | 5.05 (0.39) | 2.38 (0.38) | 1.39 (0.19) |
| stomachb | 0.52 (0.03) | 1.16 (0.16) | 2.75 (0.36) | 2.94 (0.51) |
| brain | 0.23 (0.02) | 0.16 (0.01) | 0.15 (0.03) | 0.11 (0.02) |
| [125I]TH1 | ||||
| blood | 9.49 (0.82) | 2.38 (0.88) | 1.79 (0.11) | 1.50 (0.10) |
| liver | 32.19 (1.67) | 32.11 (2.09) | 22.60 (3.42) | 20.18 (1.93) |
| kidney | 9.21 (0.68) | 9.311 (1.15) | 3.86 (0.85) | 2.68 (0.75) |
| intestine | 1.85 (0.26) | 7.88 (1.46) | 17.73 (2.22) | 23.40 (5.37) |
| spleen | 9.16 (2.04) | 12.21 (2.28) | 13.58 (4.29) | 10.04 (2.49) |
| pancreas | 1.79 (0.27) | 0.98 (0.08) | 0.56 (0.10) | 0.45 (0.08) |
| heart | 7.02 (1.23) | 2.05 (0.29) | 1.19 (0.33) | 1.44 (0.39) |
| stomachb | 0.62 (0.22) | 2.47 (2.41) | 2.13 (1.01) | 3.30 (1.40) |
| brain | 0.57 (0.0.7) | 0.32 (0.02) | 0.18(0.02) | 0.10 (0.03) |
| [125I]TH2 | ||||
| blood | 8.16 (1.21) | 2.77 (0.21) | 2.11 (0.28) | 1.48 (0.27) |
| liver | 34.99 (2.27) | 33.32 (1.41) | 27.22 (2.05) | 22.75 (2.13) |
| kidney | 12.48 (0.76) | 7.34 (0.70) | 4.97 (0.71) | 3.37 (0.30) |
| intestine | 2.55 (0.16) | 7.41 (1.21) | 17.32 (1.67) | 23.58 (2.39) |
| spleen | 9.23 (0.63) | 10.87 (2.78) | 8.51 (2.68) | 8.46 (2.57) |
| pancreas | 3.30 (0.86) | 2.15 (0.23) | 1.15 (0.18) | 0.86 (0.08) |
| heart | 8.48 (0.97) | 2.78 (0.19) | 1.73 (0.18) | 1.30 (0.37) |
| stomachb | 0.87 (0.07) | 1.70 (1.14) | 2.78 (0.68) | 5.94 (4.80) |
| brain | 1.54 (0.10) | 1.30 (0.12) | 0.66 (0.08) | 0.25 (0.02) |
Expressed as % injected dose per gram. Each value represents the mean (s.d.) for 5 animals at each interval.
Expressed as % injected dose per organ.
Figure 3.
Comparison of brain uptake of [125I]RH1, [125I]TH1, and [125I]TH2 in normal mice.
Next, the affinity of [125I]TH2 for NFT was investigated using in vitro autroradiography in sections of human AD brain as shown in Figure 4. Autoradiographic images of [125I]TH2 showed high levels of radioactivity in the brain tissue (Figure 4A). Furthermore, we confirmed that the hot spots of [125I]TH2 corresponded with those of in vitro immunohistochemical staining in the same brain sections (Figure 4B).
Figure 4.
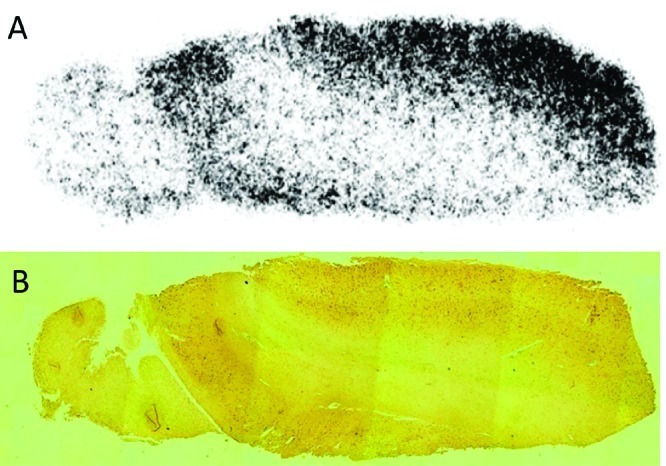
In vitro autoradiograms of sections of AD brain labeled with [125I]TH2 (A). The same sections were immunostained using an antibody against hyperphosphorylated tau (AT8) (B).
To further investigate the binding to NFT in AD brain sections, we performed neuropathological fluorescent staining with TH2. Many NFTs were clearly stained with TH2 as reflected in the in vitro assay (Figure 5A). The labeling pattern was consistent with that observed on immunohistochemical labeling with an antibody specific for hyperphosphorylated tau (AT8) (Figure 5B), indicating that TH2 shows specific binding to NFTs. These results demonstrate the feasibility of the use of TH2 as a probe for detecting NFTs in the brains of AD patients.
Figure 5.

Neuropathological staining of TH2 in 6 μm sections from the hippocampus of an AD patient (A). The same sections were immunostained using an antibody against hyperphosphorylated tau (AT8) (B).
In conclusion, we successfully designed and synthesized a new series of rhodanine and thiohydantoin derivatives as probes for the in vivo imaging of NFT in the brain. The derivatives, especially TH2, displayed higher affinity for tau aggregates than Aβ aggregates in experiments in vitro. Reflecting the results of the in vitro assays, TH2 clearly stained NFT in AD brain sections. In biodistribution experiments using normal mice, TH2 displayed good penetration of and fast washout from the brain, highly desirable characteristics for in vivo NFT imaging agents. Taken together, the present results suggest that [123I]TH2 should be further investigated as a potential imaging agent for detecting tau pathology. Additional chemical modification of the rhodanine and thiohydantoin structure may lead to more useful NFT imaging agents for both PET and SPECT.
Methods
General
All reagents were obtained commercially and used without further purification unless otherwise indicated. 1H NMR spectra were obtained on a JEOL JNM400 with TMS as an internal standard. Coupling constants are reported in hertz. Multiplicity was defined by s (singlet), d (doublet), t (triplet), q (quartet), quin (quintet), and m (multiplet). Mass spectra were obtained on a SHIMADZU LCMS-2010 EV. HPLC was performed with a Shimadzu system (a LC-20AT pump with a SPD-10A UV detector, λ = 254 nm) using a Cosmosil C18 column (Nakalai Tesque, 5C18-AR-II, 4.6 × 150 mm) and acetonitrile/water (7/3, 3/2, or 3/1) as the mobile phase at a flow rate of 1.0 mL/min. All key compounds were proven by this method to show >95% purity.
Chemistry
5-(3-Iodophenyl)furan-2-carbaldehyde (1)
To a solution of 5-formyl-2-furanboronic acid (280 mg, 2 mmol) and 1,3-diiodobenzene (660 mg, 2 mmol) in dimethoxyethane (15 mL) were added (Ph3P)4Pd (114 mg, 0.1 mmol) and 2 M Na2CO3 (4.6 mL). The reaction mixture was stirred for 3 h under reflux. Water (20 mL) was added to the cold mixture and extracted with ethyl acetate (20 mL × 2). The organic phase was dried over Na2SO4 and filtered. The solvent was removed, and the residue was purified by silica gel chromatography (hexane/ethyl acetate = 7/3) to give 155 mg of 1 (25.9%). 1H NMR (400 MHz, CDCl3) δ 6.85 (d, J = 3.7 Hz, 1H), 7.18 (t, J = 8.0 Hz, 1H), 7.31 (d, J = 3.8 Hz, 1H), 7.74−7.71 (m, 1H), 7.79−7.76 (m, 1H), 8.17 (t, J = 1.7 Hz, 1H), 9.67 (s, 1H).
Ethyl 2-(4-oxo-2-thioxothiazolidin-3-yl)acetate (2)
A mixture of glycine ethyl ester hydrochloride (140 mg, 1 mmol) and bis(carboxymethyl)trithiocarbonate (224 mg, 1 mmol) in a mixed solvent of 2-propanol (6 mL) and triethylamine (0.6 mL) was stirred for 1 h under reflux. The solvent was removed, and the residue was purified by silica gel chromatography (hexane/ethyl acetate = 1/1) to give 177 mg of 2 (80.8%). 1H NMR (400 MHz, CDCl3) δ 1.29 (t, J = 7.2 Hz, 3H), 4.07 (s, 2H), 4.23 (q, J = 7.2 Hz, 2H), 4.72 (s, 2H).
Ethyl 2-(5-oxo-2-thioxoimidazolidin-1-yl)acetate (3)
A mixture of glycine ethyl ester hydrochloride (140 mg, 1 mmol) and ethyl isothiocyanatoacetate (145 mg, 1 mmol) in a mixed solvent of acetonitrile (6 mL) and triethylamine (0.6 mL) was stirred for 10 min at room temperature. The solvent was removed, and the residue was purified by silica gel chromatography (hexane/ethyl acetate = 1/1) to give 170 mg of 3 (84.2%). 1H NMR (400 MHz, CDCl3) δ 1.30 (t, J = 7.2 Hz, 3H), 4.18 (s, 2H), 4.24 (q, J = 7.2 Hz, 2H), 4.57 (s, 2H).
(Z)-Ethyl 2-(5-((5-(3-iodophenyl)furan-2-yl)methylene)-4-oxo-2-thioxothiazolidin-3-yl) acetate (4, RH1)
A mixture of 1 (30 mg, 0.1 mmol) and 2 (22 mg, 0.1 mmol) in dichloromethane (7 mL) and piperidine (20 μL) was stirred for 3 h at room temperature. The solvent was removed, and the residue was purified by silica gel chromatography (hexane/ethyl acetate = 7/3) to give 38 mg of 4 (RH1) (76.2%). 1H NMR (400 MHz, DMSO-d6) δ 1.21 (t, J = 7.2 Hz, 3H), 4.17 (q, J = 7.2 Hz, 2H), 4.84 (s, 2H), 7.39 (t, J = 8.0 Hz, 1H), 7.43 (d, J = 4.0 Hz, 1H), 7.48 (d, J = 4.0 Hz, 1H), 7.80 (s, 1H), 7.81 (d, J = 8.0 Hz, 1H), 7.88 (d, J = 8.0 Hz, 1H), 8.25 (s, 1H). MS (APCI) m/z 500[MH+].
(Z)-Ethyl 2-(4-((5-(3-iodophenyl)furan-2-yl)methylene)-5-oxo-2-thioxoimidazolidin-1-yl) acetate (5, TH1)
A mixture of 1 (30 mg, 0.1 mmol) and 3 (20 mg, 0.1 mmol) in dichloromethane (7 mL) and piperidine (20 μL) was stirred for 15 h at room temperature. The residue was removed, and the residue was purified by silica gel chromatography (hexane/ethyl acetate = 7/3) to give 21 mg of 5 (TH1) (43.6%). 1H NMR (400 MHz, DMSO-d6) δ 1.21 (t, J = 7.2 Hz, 3H), 4.17 (q, J = 7.2 Hz 2H), 4.61 (s, 2H), 6.68 (s, 1H), 7.28 (t, J = 8.0 Hz, 1H), 7.33 (d, J = 4.0 Hz, 1H), 7.38 (d, J = 4.0 Hz, 1H), 7.73 (d, J = 8.0 Hz, 1H), 7.99 (d, J = 8.0 Hz, 1H), 8.34 (s, 1H). MS (APCI) m/z 483[MH+].
3-(2-(1H-Imidazol-4-yl)ethyl)-2-thioxoimidazolidin-4-one (6)
A mixture of histamine (111 mg, 1 mmol) and ethyl isothiocyanatoacetate (145 mg, 1 mmol) in acetonitrile (6 mL) was stirred for 10 min at room temperature. The solvent was removed, and the residue was purified by silica gel chromatography (CHCl3/MeOH = 4/1) to give 167 mg of 6 (79.5%). 1H NMR (400 MHz, DMSO-d6) δ 2.77 (t, J = 8.0 Hz, 2H), 3.86 (t, J = 8.0 Hz, 2H), 4.11 (s, 2H), 6.83 (s, 1H), 8.52 (s, 1H), 11.86 (br, s, 1H).
(Z)-3-(2-(1H-Imidazol-4-yl)ethyl)-5-((5-(3-iodophenyl)furan-2-yl)methylene)-2-thioxoimidazolidin-4-one (7)
A mixture of 1 (30 mg, 0.1 mmol) and 6 (21 mg, 0.1 mmol) in dichloromethane (7 mL) and piperidine (20 μL) was stirred for 3 h at room temperature. The solvent was removed, and the residue was purified by silica gel chromatography (chloroform/MeOH = 9/1) to give 25 mg of 7 (TH2) (51.0%). 1H NMR (400 MHz, DMSO-d6) δ 2.87 (t, J = 7.6 Hz, 2H), 4.02 (t, J = 7.6 Hz 2H), 6.55 (s, 1H), 6.86 (s, 1H), 7.28 (t, J = 8.0 Hz, 1H), 7.31 (d, J = 4.0 Hz, 1H), 7.35 (d, J = 4.0 Hz, 1H), 7.58 (s, 1H), 7.72 (d, J = 8.0 Hz, 1H), 7.98 (d, J = 8.0 Hz, 1H), 8.32 (s, 1H), 12.14 (br, s, 1H). MS (APCI) m/z 491[MH+].
5-(3-Bromophenyl)furan-2-carbaldehyde (8)
To a solution of 5-formyl-2-furanboronic acid (676 mg, 4.8 mmol) and 3-bromoiodobenzene (1.13 g, 4 mmol) in dimethoxyethane (30 mL) were added (Ph3P)4Pd (228 mg, 0.2 mmol) and 2 M Na2CO3 (9.6 mL). The reaction mixture was stirred for 2 h under reflux. Water (20 mL) was added to the cold mixture and extracted with ethyl acetate (20 mL × 2). The combined organic layer was dried over Na2SO4 and filtered. The solvent was removed, and the residue was purified by silica gel chromatography (hexane/ethyl acetate = 7/3) to give 306 mg of 8 (25.9%). 1H NMR (400 MHz, CDCl3) δ 6.86 (d, J = 3.7 Hz, 1H), 7.32 (d, J = 3.8 Hz, 1H), 7.34 (t, J = 8.0 Hz, 1H), 7.50−7.53 (m, 1H), 7.73−7.76 (m, 1H), 7.97 (t, J = 1.7 Hz, 1H), 9.68 (s, 1H).
5-(3-(Tributylstannyl)phenyl)furan-2-carbaldehyde (9)
A mixture of 8 (50 mg, 0.2 mmol), bis(tributyltin) (0.4 mL), and (Ph3P)4Pd (50 mg, 0.04 mmol) in a mixed solvent (9 mL, 5:4 dioxane/triethylamine mixture) was stirred for 3 h under reflux. The solvent was removed, and the residue was purified by silica gel chromatography (hexane/ethyl acetate = 9/1) to give 37 mg of 9 (40.0%). 1H NMR (400 MHz, CDCl3) δ 0.88−1.66 (m, 27H), 6.83 (d, J = 3.8 Hz, 1H), 7.32 (d, J = 3.8 Hz, 1H), 7.39 (t, J = 8.0 Hz, 1H), 7.48−7.50 (m, 1H), 7.74−7.76 (m, 1H), 7.87 (t, J = 1.2 Hz, 1H), 9.66 (s, 1H).
(Z)-Ethyl 2-(4-oxo-2-thioxo-5-((5-(3-(tributylstannyl)phenyl)furan-2-yl)methylene)thiazolidin-3-yl)acetate (10)
A mixture of 9 (7 mg, 0.015 mmol) and 2 (3.5 mg, 0.016 mmol) in a mixed solvent of dichloromethane (3 mL) and piperidine (5 μL) was stirred for 15 h at room temperature. The solvent was removed, and the residue was purified by silica gel chromatography (hexane/ethyl acetate = 7/3) to give 6 mg of 10 (56.6%). 1H NMR (400 MHz, CDCl3) δ 0.88−1.63 (m, 27H), 1.29 (t, J = 7.0 Hz, 3H), 4.24 (q, J = 7.0 Hz, 2H), 4.87 (s, 2H), 6.87 (d, J = 3.7 Hz, 1H), 6.99 (d, J = 3.7 Hz, 1H), 7.41−7.52 (m, 2H), 7.53 (s, 1H), 7.70−7.73 (m, 2H), 7.91 (s, 1H).
(Z)-Ethyl 2-(5-oxo-2-thioxo-4-((5-(3-(tributylstannyl)phenyl)furan-2-yl)methylene) imidazolidin-1-yl)acetate (11)
To a solution of 9 (10 mg, 0.022 mmol) and 3 (4.4 mg, 0.022 mmol) in dichloromethane (3 mL) was added piperidine (5 μL). The reaction mixture was stirred at room temperature overnight. The solvent was removed, and the residue was purified by silica gel chromatography (hexane/ethyl acetate = 7/3) to give 11 mg of 11 (74.0%). 1H NMR (400 MHz, DMSO-d6) δ 0.84−1.54 (m, 27H), 1.21 (t, J = 7.6 Hz, 3H), 4.17 (q, J = 7.2 Hz, 2H), 4.60 (s, 2H), 6.67 (s, 1H), 7.22 (d, J = 3.8 Hz, 1H), 7.43−7.45 (m, 3H), 7.88−7.90 (m, 2H). MS (APCI) m/z 645[M − H−].
(Z)-3-(2-(1H-Imidazol-4-yl)ethyl)-2-thioxo-5-((5-(3-(tributylstannyl)phenyl)furan-2-yl)methylene)imidazolidin-4-one (12)
To a solution of 9 (65 mg, 0.14 mmol) and 6 (32 mg, 0.15 mmol) in dichloromethane (7 mL) was added piperidine (20 μL). The reaction mixture was stirred at room temperature overnight. The solvent was removed, and the residue was purified by silica gel chromatography (CHCl3/MeOH = 9/1) to give 42 mg of 12 (45.9%). 1H NMR (400 MHz, DMSO-d6) δ 0.84−1.64 (m, 27H), 2.87 (t, J = 7.6 Hz 2H), 4.01 (t, J = 7.6 Hz 2H), 6.55 (s, 1H), 6.84 (s, 1H), 7.20 (d, J = 3.6 Hz, 1H), 7.40−7.44 (m, 3H), 7.54 (s, 1H), 7.86−7.88 (m, 2H), 12.14 (br, s, 1H). MS (APCI) m/z 655[MH+].
Iododestannylation Reaction
The radioiodinated forms of 4 (RH1), 5 (TH1), and 7 (TH2) were prepared from corresponding tributyltin derivatives by iododestannylation. Briefly, 50 μL of H2O2 (3%) was added to a mixture of a tributyltin derivative (100 μg/50 μL in EtOH), [125I]NaI (3.7−7.4 MBq, specific activity 81.4 TBq/mmol), and 100 μL of 1 N HCl in a sealed glass vial. The reaction was allowed to proceed at room temperature for 5 min and terminated by the addition of 100 μL of saturated aqueous NaHSO3. After addition of 100 μL of a saturated aqueous NaHCO3, the reaction was extracted with ethyl acetate (1 mL). The extract was dried by passing through an anhydrous Na2SO4 column and then blown dry with a stream of nitrogen gas. The radioiodinated ligands were purified by HPLC on a Cosmosil C18 column with an isocratic solvent of H2O/acetonitrile (3/7, 2/3, or 1/3 for RH1, TH, or TH2, respectively) at a flow rate of 1.0 mL/min.
Binding Experiments Using Recombinant Tau and Aβ(1−42) Aggregates
The 441 aa isoform of human tau was expressed from a cDNA clone in Escherichia coli and purified as described previously.32 Tau aggregates were prepared by incubating tau protein (1 mg/mL) in the presence of heparin (0.1 mg/mL) for 72 h with continuous shaking.30 A solid form of Aβ(1−42) was purchased from Peptide Institute (Osaka, Japan). Aggregation was carried out by gently dissolving the peptide (0.25 mg/mL) in a buffer solution (pH 7.4) containing 10 mM sodium phosphate and 1 mM EDTA. The solution was incubated at 37 °C for 42 h with gentle and constant shaking.
Thioflavin S was used as the tracer for the competition binding experiments. A mixture (100 μL of 10% EtOH) containing RH1, TH1, and TH2 (final conc. 0−10 μM), thioflavin S (final conc. 1.5 μM), and tau aggregates (final conc. 0.2 μM) or Aβ(1−42) aggregates (final conc. 2.2 μM) was incubated at room temperature for 30 min. Fluorescence intensity at an excitation wavelength of 510 nm for tau and 490 nm for Aβ(1−42), respectively, was plotted, and values for the half-maximal inhibitory concentration (IC50) were determined from displacement curves of three independent experiments using GraphPad Prism software (GraphPad Software, San Diego, CA). The inhibition constants (Ki) were calculated using the Cheng-Prusoff equation:33Ki = IC50/(1 + [L]/Kd), where [L] is the concentration of thioflavin S used in the assay and Kd is the dissociation constant of thioflavin S. The Kd value for tau and Aβ aggregates was 0.63 and 2.2 μM, respectively. (See Supporting Information.)
Binding Experiments Using Tau Monomers and Tau Aggregates
Tau aggregates were prepared as described above, and the tau monomer was used without aggregation. A mixture (300 μL of 10% EtOH) containing [125I]RH1, [125I]TH1, and [125I]TH2 (2.03 kBq) and the monomer or aggregates (final conc. 0.37 μM) were incubated at room temperature for 10 min. The reaction mixture was fractionated by size exclusion chromatography (PD-10 column, GE Healthcare) using phosphate-buffered saline (PBS) as the mobile phase, and the fraction in which tau aggregates or tau monomers were eluted was obtained. The radioactivity in this fraction was measured with a gamma counter (Perkin-Elmer, WIZARD 1470).
Biodistribution in Normal Mice
The experiments with animals were conducted in accordance with our institutional guidelines and approved by the Kyoto University Animal Care Committee. A saline solution (100 μL) of 125I-labeled derivatives (7.1−21.5 kBq) containing ethanol (10 μL) was injected intravenously directly into the tail of ddY mice (5 weeks old, 22−25 g). The mice were sacrificed at various time points postinjection. The organs of interest were removed and weighed, and radioactivity was measured with an automatic gamma counter (Perkin-Elmer, WIZARD3 1480).
Neuropathological Staining of AD Brain Sections
Postmortem brain tissues from an autopsy-confirmed case of an AD (93-year-old female) patient were obtained and examined neuropathologically by conventional silver staining. Experiments were performed according to the regulations of the ethics committee of Kyoto University. Six-micrometer-thick serial sections of paraffin-embedded blocks of the hippocampus were used for staining. Paraffin sections were subjected to two 5 min incubations in xylene, and two 1 min incubations in 100% EtOH to completely deparaffinize them, followed by two 5 min washes in water and then PBS. Tissue sections were immersed in the compound solution (200 μM) containing 50% ethanol for 1 h. Finally, the sections were washed in 50% ethanol for 10 min. Fluorescent sections were viewed using a BZ-9000 fluoromicroscope equipped with a GFP-B filter. The sections were also immunostained with DAB as a chromogen using monoclonal antibodies against hyperphosphorylated tau (AT8)30 as described previously.
In Vitro Autoradiography
Postmortem brain tissues from an autopsy-confirmed case of AD (72-year-old male) were obtained from BioChain Institute Inc. The presence and distribution of NFT in the sections were confirmed with immunohistochemical staining using a monoclonal tau antibody, AT8 (Wako), as reported. The sections were incubated with [125I]TH2 (3.05 kBq/ml) for 1 h at room temperature. They were then dipped in saturated lithium carbonate in 50% EtOH (two 2 min washes) and washed with 50% EtOH (one 2 min wash), before being rinsed with water for 30 s. After drying, the 125I-labeled sections were exposed to a Fuji Film imaging plate overnight.
Author Contributions
M.O. and H.S. oversaw and designed all experiments. S.H. performed synthetic chemistry work, and in vitro and in vivo experiments. K.M. performed biodistribution studies in normal mice. H.K. oversaw and performed synthetic chemistry work. Y.O., M.I. and R.T. oversaw and performed neuropathological staining of Alzheimer's brain sections. H.M. oversaw and designed binding experiments using tau protein.
Supporting Information Available
Method for saturation assay with thioflavin S using recombinant tau and Aβ1−42 aggregates; figure of binding of thioflavin S to tau aggregates and Aβ aggregates. This material is available free of charge via the Internet at http://pubs.acs.org.
This study was supported by the Funding Program for Next Generation World-Leading Researchers and a Grant-in-aid for Young Scientists (A) and Exploratory Research from the Ministry of Education, Culture, Sports, Science, and Technology, Japan.
Supplementary Material
References
- Selkoe D. J. (2001) Alzheimer’s disease: genes, proteins, and therapy. Physiol. Rev. 81, 741–766. [DOI] [PubMed] [Google Scholar]
- Mathis C. A.; Wang Y.; Klunk W. E. (2004) Imaging β-amyloid plaques and neurofibrillary tangles in the aging human brain. Curr. Pharm. Des. 10, 1469–1492. [DOI] [PubMed] [Google Scholar]
- Nordberg A. (2004) PET imaging of amyloid in Alzheimer’s disease. Lancet Neurol. 3, 519–527. [DOI] [PubMed] [Google Scholar]
- Ono M. (2009) Development of positron-emission tomography/single-photon emission computed tomography imaging probes for in vivo detection of β-amyloid plaques in Alzheimer’s brains. Chem. Pharm. Bull. (Tokyo) 57, 1029–1039. [DOI] [PubMed] [Google Scholar]
- Agdeppa E. D.; Kepe V.; Liu J.; Flores-Torres S.; Satyamurthy N.; Petric A.; Cole G. M.; Small G. W.; Huang S. C.; Barrio J. R. (2001) Binding characteristics of radiofluorinated 6-dialkylamino-2-naphthylethylidene derivatives as positron emission tomography imaging probes for β-amyloid plaques in Alzheimer’s disease. J. Neurosci. 21, RC189. [DOI] [PMC free article] [PubMed] [Google Scholar]
- Shoghi-Jadid K.; Small G. W.; Agdeppa E. D.; Kepe V.; Ercoli L. M.; Siddarth P.; Read S.; Satyamurthy N.; Petric A.; Huang S. C.; Barrio J. R. (2002) Localization of neurofibrillary tangles and β-amyloid plaques in the brains of living patients with Alzheimer disease. Am. J. Geriatr. Psychiatry 10, 24–35. [PubMed] [Google Scholar]
- Mathis C. A.; Wang Y.; Holt D. P.; Huang G. F.; Debnath M. L.; Klunk W. E. (2003) Synthesis and evaluation of 11C-labeled 6-substituted 2-arylbenzothiazoles as amyloid imaging agents. J. Med. Chem. 46, 2740–2754. [DOI] [PubMed] [Google Scholar]
- Klunk W. E.; Engler H.; Nordberg A.; Wang Y.; Blomqvist G.; Holt D. P.; Bergstrom M.; Savitcheva I.; Huang G. F.; Estrada S.; Ausen B.; Debnath M. L.; Barletta J.; Price J. C.; Sandell J.; Lopresti B. J.; Wall A.; Koivisto P.; Antoni G.; Mathis C. A.; Langstrom B. (2004) Imaging brain amyloid in Alzheimer’s disease with Pittsburgh Compound-B. Ann. Neurol. 55, 306–319. [DOI] [PubMed] [Google Scholar]
- Ono M.; Wilson A.; Nobrega J.; Westaway D.; Verhoeff P.; Zhuang Z. P.; Kung M. P.; Kung H. F. (2003) 11C-labeled stilbene derivatives as Aβ-aggregate-specific PET imaging agents for Alzheimer’s disease. Nucl. Med. Biol. 30, 565–571. [DOI] [PubMed] [Google Scholar]
- Verhoeff N. P.; Wilson A. A.; Takeshita S.; Trop L.; Hussey D.; Singh K.; Kung H. F.; Kung M. P.; Houle S. (2004) In-vivo imaging of Alzheimer disease β-amyloid with [11C]SB-13 PET. Am. J. Geriatr. Psychiatry 12, 584–595. [DOI] [PubMed] [Google Scholar]
- Zhang W.; Oya S.; Kung M. P.; Hou C.; Maier D. L.; Kung H. F. (2005) F-18 polyethyleneglycol stilbenes as PET imaging agents targeting Aβ aggregates in the brain. Nucl. Med. Biol. 32, 799–809. [DOI] [PubMed] [Google Scholar]
- Rowe C. C.; Ackerman U.; Browne W.; Mulligan R.; Pike K. L.; O’Keefe G.; Tochon-Danguy H.; Chan G.; Berlangieri S. U.; Jones G.; Dickinson-Rowe K. L.; Kung H. P.; Zhang W.; Kung M. P.; Skovronsky D.; Dyrks T.; Holl G.; Krause S.; Friebe M.; Lehman L.; Lindemann S.; Dinkelborg L. M.; Masters C. L.; Villemagne V. L. (2008) Imaging of amyloid β in Alzheimer’s disease with 18F-BAY94-9172, a novel PET tracer: proof of mechanism. Lancet Neurol. 7, 129–135. [DOI] [PubMed] [Google Scholar]
- Kudo Y.; Okamura N.; Furumoto S.; Tashiro M.; Furukawa K.; Maruyama M.; Itoh M.; Iwata R.; Yanai K.; Arai H. (2007) 2-(2-[2-Dimethylaminothiazol-5-yl]ethenyl)-6-(2-[fluoro]ethoxy)benzoxazole: a novel PET agent for in vivo detection of dense amyloid plaques in Alzheimer’s disease patients. J. Nucl. Med. 48, 553–561. [DOI] [PubMed] [Google Scholar]
- Kung M. P.; Hou C.; Zhuang Z. P.; Zhang B.; Skovronsky D.; Trojanowski J. Q.; Lee V. M.; Kung H. F. (2002) IMPY: an improved thioflavin-T derivative for in vivo labeling of β-amyloid plaques. Brain Res. 956, 202–210. [DOI] [PubMed] [Google Scholar]
- Zhuang Z. P.; Kung M. P.; Wilson A.; Lee C. W.; Plossl K.; Hou C.; Holtzman D. M.; Kung H. F. (2003) Structure-activity relationship of imidazo[1,2-a]pyridines as ligands for detecting β-amyloid plaques in the brain. J. Med. Chem. 46, 237–243. [DOI] [PubMed] [Google Scholar]
- Kung M. P.; Hou C.; Zhuang Z. P.; Cross A. J.; Maier D. L.; Kung H. F. (2004) Characterization of IMPY as a potential imaging agent for β-amyloid plaques in double transgenic PSAPP mice. Eur. J. Nucl. Med. Mol. Imaging 31, 1136–1145. [DOI] [PubMed] [Google Scholar]
- Newberg A. B.; Wintering N. A.; Clark C. M.; Plossl K.; Skovronsky D.; Seibyl J. P.; Kung M. P.; Kung H. F. (2006) Use of 123I IMPY SPECT to differentiate Alzheimer’s disease from controls. J. Nucl. Med. 47, 78P. [PubMed] [Google Scholar]
- Zhang W.; Kung M. P.; Oya S.; Hou C.; Kung H. F. (2007) 18F-labeled styrylpyridines as PET agents for amyloid plaque imaging. Nucl. Med. Biol. 34, 89–97. [DOI] [PubMed] [Google Scholar]
- Choi S. R.; Golding G.; Zhuang Z.; Zhang W.; Lim N.; Hefti F.; Benedum T. E.; Kilbourn M. R.; Skovronsky D.; Kung H. F. (2009) Preclinical properties of 18F-AV-45: a PET agent for Aβ plaques in the brain. J. Nucl. Med. 50, 1887–1894. [DOI] [PMC free article] [PubMed] [Google Scholar]
- Kung H. F.; Choi S. R.; Qu W.; Zhang W.; Skovronsky D. (2010) 18F stilbenes and styrylpyridines for PET imaging of Aβ plaques in Alzheimer’s disease: a miniperspective. J. Med. Chem. 53, 933–941. [DOI] [PMC free article] [PubMed] [Google Scholar]
- Johnson A. E.; Jeppsson F.; Sandell J.; Wensbo D.; Neelissen J. A.; Jureus A.; Strom P.; Norman H.; Farde L.; Svensson S. P. (2009) AZD2184: a radioligand for sensitive detection of β-amyloid deposits. J. Neurochem. 108, 1177–1186. [DOI] [PubMed] [Google Scholar]
- Jureus A.; Swahn B. M.; Sandell J.; Jeppsson F.; Johnson A. E.; Johnstrom P.; Neelissen J. A.; Sunnemark D.; Farde L.; Svensson S. P. (2010) Characterization of AZD4694, a novel fluorinated Aβ plaque neuroimaging PET radioligand. J. Neurochem. 114, 784–794. [DOI] [PubMed] [Google Scholar]
- Arriagada P. V.; Growdon J. H.; Hedley-Whyte E. T.; Hyman B. T. (1992) Neurofibrillary tangles but not senile plaques parallel duration and severity of Alzheimer’s disease. Neurology 42, 631–639. [DOI] [PubMed] [Google Scholar]
- Braak H.; Braak E. (1993) Entorhinal-hippocampal interaction in mnestic disorders. Hippocampus 3 Spec. No. 239–246. [PubMed] [Google Scholar]
- Gomez-Isla T.; Hollister R.; West H.; Mui S.; Growdon J. H.; Petersen R. C.; Parisi J. E.; Hyman B. T. (1997) Neuronal loss correlates with but exceeds neurofibrillary tangles in Alzheimer’s disease. Ann. Neurol. 41, 17–24. [DOI] [PubMed] [Google Scholar]
- Gomez-Isla T.; Wasco W.; Pettingell W. P.; Gurubhagavatula S.; Schmidt S. D.; Jondro P. D.; McNamara M.; Rodes L. A.; DiBlasi T.; Growdon W. B.; Seubert P.; Schenk D.; Growdon J. H.; Hyman B. T.; Tanzi R. E. (1997) A novel presenilin-1 mutation: increased β-amyloid and neurofibrillary changes. Ann. Neurol. 41, 809–813. [DOI] [PubMed] [Google Scholar]
- Small G. W.; Kepe V.; Ercoli L. M.; Siddarth P.; Bookheimer S. Y.; Miller K. J.; Lavretsky H.; Burggren A. C.; Cole G. M.; Vinters H. V.; Thompson P. M.; Huang S. C.; Satyamurthy N.; Phelps M. E.; Barrio J. R. (2006) PET of brain amyloid and tau in mild cognitive impairment. N. Engl. J. Med. 355, 2652–2663. [DOI] [PubMed] [Google Scholar]
- Velasco A.; Fraser G.; Delobel P.; Ghetti B.; Lavenir I.; Goedert M. (2008) Detection of filamentous tau inclusions by the fluorescent Congo red derivative FSB [(trans,trans)-1-fluoro-2,5-bis(3-hydroxycarbonyl-4-hydroxy)styrylbenzene]. FEBS Lett. 582, 901–906. [DOI] [PMC free article] [PubMed] [Google Scholar]
- Mohorko N.; Repovs G.; Popovic M.; Kovacs G. G.; Bresjanac M. (2010) Curcumin labeling of neuronal fibrillar tau inclusions in human brain samples. J. Neuropathol. Exp. Neurol. 69, 405–414. [DOI] [PubMed] [Google Scholar]
- Okamura N.; Suemoto T.; Furumoto S.; Suzuki M.; Shimadzu H.; Akatsu H.; Yamamoto T.; Fujiwara H.; Nemoto M.; Maruyama M.; Arai H.; Yanai K.; Sawada T.; Kudo Y. (2005) Quinoline and benzimidazole derivatives: candidate probes for in vivo imaging of tau pathology in Alzheimer’s disease. J. Neurosci. 25, 10857–10862. [DOI] [PMC free article] [PubMed] [Google Scholar]
- Bulic B.; Pickhardt M.; Khlistunova I.; Biernat J.; Mandelkow E. M.; Mandelkow E.; Waldmann H. (2007) Rhodanine-based tau aggregation inhibitors in cell models of tauopathy. Angew. Chem., Int. Ed. Engl. 46, 9215–9219. [DOI] [PubMed] [Google Scholar]
- Han D.; Qureshi H. Y.; Lu Y.; Paudel H. K. (2009) Familial FTDP-17 missense mutations inhibit microtubule assembly-promoting activity of tau by increasing phosphorylation at Ser202 in vitro. J. Biol. Chem. 284, 13422–13433. [DOI] [PMC free article] [PubMed] [Google Scholar]
- Cheng Y.; Prusoff W. (1973) Relationship between the inhibition constant (K1) and the concentration of inhibitor which causes 50% inhibition (I50) of an enzymatic reaction. Biochem. Pharmacol. 22, 3099–3108. [DOI] [PubMed] [Google Scholar]
Associated Data
This section collects any data citations, data availability statements, or supplementary materials included in this article.