

Abstract

The presynaptic dopamine (DA) transporter is responsible for DA inactivation following release and is a major target for the psychostimulants cocaine and amphetamine. Dysfunction and/or polymorphisms in human DAT (SLC6A3) have been associated with schizophrenia, bipolar disorder, Parkinson’s disease, and attention-deficit hyperactivity disorder (ADHD). Despite the clinical importance of DAT, many uncertainties remain regarding the transporter’s regulation, in part due to the poor spatiotemporal resolution of conventional methodologies and the relative lack of efficient DAT-specific fluorescent probes. We developed a quantum dot-based labeling approach that uses a DAT-specific, biotinylated ligand, 2-β-carbomethoxy-3-β-(4-fluorophenyl)tropane (IDT444), that can be bound by streptavidin-conjugated quantum dots. Flow cytometry and confocal microscopy were used to detect DAT in stably and transiently transfected mammalian cells. IDT444 is useful for quantum-dot-based fluorescent assays to monitor DAT expression, function, and plasma membrane trafficking in living cells as evidenced by the visualization of acute, protein-kinase-C (PKC)-dependent DAT internalization.
Keywords: Quantum dot, live cell imaging, single-cell analysis, dopamine transporter, cocaine analogue, trafficking
The neurotransmitter dopamine (DA) modulates a variety of physiological functions and behavioral responses including attention, arousal, cognition, reward, and motor activity in the central nervous system (Figure 1).1−3 Impaired DA signaling has been linked to a number of neurodegenerative and psychiatric disorders such as attention-deficit hyperactivity disorder (ADHD), bipolar disorder, major depression, Tourette’s syndrome, Parkinson’s disease, and schizophrenia.4−8 The synaptic DA concentration influences postsynaptic DA signal transduction capacity and is modulated by the activity of a presynaptic D2 DA receptor, that modulates DA release, and the DA transporter (DAT),1,9 that clears DA to achieve DA inactivation and recycling.10 DAT (SLC6A3) is a member of a family of Na+-coupled solute transporters whose substrates include neurotransmitters, nutrients, osmolytes, and amino acids. Several reports have demonstrated that experimental DAT deficiency results in pronounced changes in dopaminergic tone and locomotor hyperactivity.10−12 In addition, DAT is the primary target for widely used psychostimulants, such as amphetamine and cocaine that acutely elevate synaptic DA concentrations. Cocaine is a competitive DAT inhibitor and attenuates DA clearance by occupying the DA binding site on DAT, whereas amphetamine promotes DAT-mediated DA efflux that also results in the increased DA synaptic concentration.13 DAT activity has also been demonstrated to be a subject of acute, dynamic regulation by several post-translational mechanisms, such as constitutive endocytosis, protein-kinase-C (PKC)-dependent internalization, protein–protein interactions, and substrate-induced changes in surface expression level.13,14 The spatial organization and temporal control of these mechanisms remain largely unknown and, when disrupted, may influence risk for disorders linked to compromised DA signaling.
Figure 1.
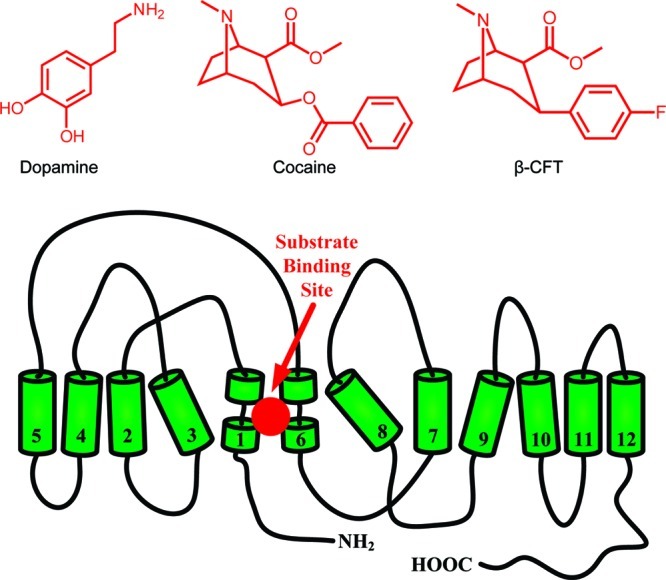
Structures of DAT and its relevant substrates. A two-dimensional topology of DAT based on the leucine transporter (LeuT) is shown with 12 transmembrane segments, intracellularly oriented N- and C-termini, and substrate binding site. Structures of dopamine, cocaine, and cocaine analogue β-CFT are shown as well. The binding site for dopamine, cocaine, and cocaine analogues has been suggested to overlap and is buried deep between transmembrane segments 1, 3, 6, and 8.39
The investigation of DAT regulation has thus far trailed similar efforts directed at membrane receptors and channels due a number of important challenges. First, the lack of an efficient antibody against an extracellular epitope does not allow direct localization and visualization of DAT molecules in living cells without prior chemical processing (fixation and permeabilization).15,16 Second, the use of popular fusion tags, such as green fluorescent protein (GFP) and hemagglutinin (HA), requires genetic perturbation of DAT and thus does not allow direct visualization of endogenous DAT. Third, traditional autoradiographic, biochemical, and optical techniques to monitor DAT expression, function, and cellular distribution suffer from suboptimal spatial and temporal resolution and are limited to providing ensemble-averaged information.17,18 Recently, a series of dye-conjugated fluorescent cocaine analogues has been developed and successfully used to directly visualize DAT in living cells for the first time. Cha, Eriksen and colleagues used an organic dye-conjugated 2β-carbomethoxy-3β-(3,4-dichlorophenyl)tropane (RTI 111) ligand to visualize changes in DAT cellular movement in response to different stimuli via laser confocal microscopy.16 However, this ligand does not have the photostability properties to permit single-molecule resolution.
We have focused on developing new DAT-specific ligands for conjugation with nanometer-sized semiconductor nanocrystals, known as quantum dots (Qdots). Qdots offer several distinct advantages over conventional fluorophores and permit visualization of membrane-associated proteins with high accuracy and temporal resolution, with reported values as low as 10 nm with 10 ms integration time.19−23 Specifically, their excellent brightness and superior resistance to photodegradation enable noninvasive imaging of complex biological processes with high signal-to-noise ratio (SNR) over time scales from milliseconds to hours. Also, the broad absorption spectra and size-dependent, narrow, symmetric emission spectra of Qdots considerably simplify multiplexed, molecular imaging experiments. We have previously reported the synthesis of GBR12909- and GBR12935-based DAT-specific ligands for conjugation with Qdots.24,25 In this effort, we sought to improve the design of the DAT ligand by incorporating a phenyltropane-based dopamine reuptake inhibitor parent compound (β-CFT, WIN 35,428) into the structure. β-CFT is a structural analogue of cocaine, is 3–10× more potent than cocaine, and is characterized by excellent structural stability.26,27 Our choice of the parent compound is also validated by multiple instances of the use of radiolabeled β-CFT to map DAT distribution in the animal and human brain.28−31
Here, we present a relatively simple and rapid approach for Qdot-based direct visualization of DAT in living cells that uses a DAT-specific, biotinylated 2-β-carbomethoxy-3-β-(4-fluorophenyl)tropane (IDT444) in conjunction with streptavidin-conjugated Qdots (SavQdots). Using this approach, we demonstrate the specificity of DAT Qdot labeling and the ability to detect DAT-expressing mammalian cells at a combination of low nanomolar concentrations of IDT444 and picomolar concentrations of Qdots. To determine whether we could use our Qdot-based approach to capture DAT trafficking, we visualized acute, PKC-dependent internalization of DAT-Qdot complexes in response to phorbol ester treatment. Finally, we show the advantages of Qdot photophysical properties in time-lapse image series acquisition over extended periods of time.
Results and Discussion
Cocaine Analogue Synthesis
To develop a DAT-specific probe, a biotinylated cocaine analogue IDT444 (6) was synthesized (Figure 2A). The IDT444 ligand is composed of four distinct parts: (i) a high-affinity cocaine analogue, 2-β-carbomethoxy-3-β-(4-fluorophenyl)tropane (β-CFT or WIN 35,428), first reported by Clarke et al., (ii) a short alkyl spacer, (iii) a poly(ethylene glycol) (PEG) chain (average MW 5000), and (iv) a biotin terminus (Figure 2B).26 β-CFT was chosen as the parent drug due to its high affinity for DAT, excellent structural stability, and pharmacological properties closely resembling those of cocaine.26,27 The hydrophobic alkyl linker was incorporated into the IDT444 ligand by attaching it to the nitrogen atom on the tropane ring. The tropane nitrogen was chosen as the attachment point based on previous studies, which showed that bulky groups attached to the tropane N-position had no significant effect on the phenyl tropane pharmacological properties and structural stability.27−31 The short alkyl spacer was attached to the tropane nitrogen to increase flexibility and allow enhanced access to the binding site. The PEG chain was used to ensure the IDT444 ligand is soluble in aqueous buffers and possibly reduce any potential nonspecific interactions with the cellular membrane.33 The biotin handle at the end of the PEG chain served as a binding site for SavQdots. Detailed synthetic steps are described in the Supporting Information.
Figure 2.

(A) Synthetic route used to prepare IDT444 (6). (B). Schematic representation of the two-step DAT labeling approach using IDT ligand and SavQdots.
DAT Visualization in Flp-In-293 Cells in Suspension
The HEK Flp-In-293 cell line was used as a model stable expression system to investigate the interactions of our Qdot-based fluorescent probes with DAT. To achieve DAT expression, a plasmid vector containing the FRT site linked to the hygromycin resistance gene and the DAT cDNA was integrated into the genome via Flp recombinase-mediated DNA recombination at the FRT site. DAT-expressing Flp-In-293 cells were selected in the presence of 100 μg/mL hygromycin B.
DAT-Flp-In-293 cells were subjected to a two-step solution-based Qdot labeling protocol. Flp-In-293 cells were incubated with the IDT444 ligand and subsequently labeled with SavQdots in solution to prevent the loss of cells due to detachment from the plate surface, reduce nonspecific Qdot interactions with the culture vessel, and enhance specific recognition of the biotinylated ligand. These cells were incubated with 100 nM IDT444 phosphate-buffered saline (PBS) solution for 5 min at 37 °C, lifted off the culture plate by gentle pipetting, centrifuged, and resuspended in 1 nM SavQdot PBS solution for 5 min at 4 °C. After several wash steps to rinse away the unbound ligands and conjugates, specific DAT Qdot labeling was demonstrated by confocal microscopy and flow cytometry, which were used as complementary techniques to quantify DAT Qdot labeling. Representative flow cytometry histograms and confocal images of the specific labeling of DAT expressed in hDAT-Flp-In-293 cells are shown in Figure 3. DAT-Flp-In-293 cells pretreated with 1 μM GBR12909, a high-affinity DAT antagonist, and DAT-Flp-In-293 cells incubated with 1 nM SavQDs only were used as control cell populations.34,35 Compared to the control samples, the prominent increase of the median fluorescence intensity (MFI) as assessed by flow cytometry (Figure 3A3) and the presence of membrane-associated uniform fluorescent halos on the acquired confocal images (Figure 3A1–A2) indicated successful, specific hDAT Qdot labeling. GBR12909 effectively blocked the interaction of SavQdot-IDT444 conjugates with hDAT (Figure 3B1–B3), and the cell population exposed to SavQdots only (Figure 3C1–C3) had similarly low percentage of labeled cells as observed for the preblocked cell population, indicating minimal ligand nonspecific binding. The images and flow cytometry histograms shown in Figure 3 are representative of at least five independent experiments.
Figure 3.

Specific SavQdot-IDT444 labeling of DAT stably expressed in Flp-In-293 cells. Representative flow cytometry histograms and confocal images are shown for DAT-expressing cells (A1–A3), DAT-expressing cells pretreated with 1 μM GBR12909 (B1–B3), and DAT-expressing cells incubated with SavQdot only (C1–C3). All samples were incubated with 100 nM solution of IDT444 in PBS for 5 min at 37 °C and subsequently exposed to 1 nM SavQdot in PBS for 5 min at 4 °C.
IDT444 and SavQdot Dose Response
Next, we investigated the sensitivity of flow cytometric detection of DAT-Flp-In-293 cells using our Qdot-based approach. In the first series of dose–response experiments, the SavQdot concentration was kept constant at 1 nM, and IDT444 concentration was varied over several orders of magnitude (10 pM to 1 μM). The cell populations were subjected to the two-step labeling protocol described above and analyzed by flow cytometry. Parallel DAT-Flp-In-293 cells that were preblocked with 1 μM GBR12909 were used as a control to assess ligand nonspecific binding at different IDT444 concentrations. The IDT444 concentration–response curves are shown for both cell populations in Figure 4A. Each data point represents the averaged MFI from three independent experiments. Robust standard deviation (rSD) was calculated from the MFI and the robust coefficient of variation (rCV) of the fluorescence intensity distribution (see the Supporting Information). We observed statistically significant difference in MFI of labeled and control DAT-Flp-In-293 at the IDT444 concentration of 1 nM (p < 0.05). Also, it is apparent from the control population MFI curve that the increase of IDT444 concentration over several orders of magnitude does not result in significant ligand-mediated nonspecific binding. This suggests that DAT detection in Flp-In-293 cells is ligand-specific and dose-dependent. In the second series of dose–response experiments, IDT444 concentration was kept constant at 100 nM, and SavQdot concentration was varied over several orders of magnitude (10 pM to 10 nM). Parallel DAT-Flp-In-293 cells preblocked with 1 μM GBR12909 were used as a control to assess Qdot nonspecific binding at different concentrations. We observed statistically significant difference in MFI of labeled and control DAT-Flp-In-293 at SavQdot concentration as low as 100 pM (p < 0.05, Figure 4B). It should be noted that the MFI of the control population increased significantly with the increasing SavQdot dose. This indicates that one must carefully optimize the concentration of Qdots to be used in our approach, since the SNR will be dependent on the Qdot surface chemistry as well as cell type.33 Here, we determined that we could successfully detect Flp-In-293 cells stably expressing DAT at a combination of low nanomolar concentrations of IDT444 and picomolar concentrations of SavQdots.
Figure 4.

IDT444 (A) and SavQdot (B) dose response curves. Individual data points represent averaged MFI from three independent experiments. rSD was calculated from the MFI and rCV of the fluorescence intensity distribution (see the Supporting Information).
DAT Visualization in HeLa Cells in Situ
After we successfully demonstrated specific Qdot labeling of DAT in stably transfected Flp-In-293 cells in suspension, we attempted to visualize Flp-In-293 cells in 8-well chamber slides in situ. This proved to be a very challenging task, since Flp-In-293 cells are weakly adherent and detach easily during gentle washes between labeling steps even in collagen- and fibronectin-coated chamber slides. Therefore we chose a relatively strongly adherent HeLa cell line to determine whether we could use our approach to label living DAT-expressing cells in situ. HeLa cells were transiently transfected with a pcDNA3 vector containing the human DAT cDNA in 8-well chamber slides. Parallel HeLa cells were transfected with an empty (sham) pcDNA3 vector and served as a negative control to evaluate nonspecific cell labeling. Just prior to confocal imaging, DAT-transfected HeLa cells were incubated with 100 nM IDT444, washed 3× with warm imaging buffer, incubated with 1 nM SavQD, and washed 3× with warm imaging buffer, and Qdot-labeled HeLa cells were subsequently visualized (Figure 5A1,A2). Confocal images clearly demonsrate uniform plasma membrane labeling of DAT-transfected cells. No fluorescence staining was observed for DAT-transfected HeLa cells preincubated with 1 μM GBR12909 (Figure 5B1,B2) and sham-transfected HeLa cells (Figure 5C1,C2), indicating a low level of nonspecific labeling. These data demonstrate that our Qdot-based approach can be used to specifically label DAT in living cells in situ with high SNR.
Figure 5.

Specific SavQdot-IDT444 labeling of DAT stably expressed in living HeLa cells in situ. Representative confocal images are shown for DAT-pcDNA3 transiently transfected HeLa cells (A1,A2), DAT-pcDNA3 transiently transfected cells pretreated with 1 μM GBR12909 (B1,B2), and sham-pcDNA3 transiently transfected cells (C1,C2). Fluorescent (top) and overlay (bottom) images are shown. All samples were incubated with 100 nM solution of IDT444 in the imaging buffer for 5 min at 37 °C and subsequently exposed to 1 nM SavQdot in the imaging buffer for 2–3 min at 37 °C. Images are representative of at least five independent experiments.
Visualization of PKC-Dependent DAT Internalization
Many groups have demonstrated that PKC activation by phorbol esters, such as phorbol 12-myristate 13-acetate (PMA), results in acute down-regulation of DAT surface expression levels in several heterologous cell lines.36−38 To investigate whether we could use our IDT444-SavQdot conjugates to visualize acute DAT internalization, we incubated transiently transfected HeLa cells with 100 nM IDT444 for 5 min at 37 °C, washed the cells 3× with warm imaging medium, incubated the cells with 1 nM SavQdot for 2–3 min 37 °C, and washed the cells 3× with warm imaging medium. Qdot-labeled HeLa cells were then incubated for 30 min at 37 °C in the presence or absence of 1 μM PMA. While we did not observe any apparent change in the distribution of membrane DAT-Qdot complexes in HeLa cells incubated in the presence of vehicle (DMSO) only (Figure 6A1,A2), PMA treatment led to the appearance of punctate intracellular fluorescence, a clear sign of acute, PKC-dependent DAT-Qdot complex internalization consistent with the previous reports (Figure 6B1,B2). This experiment demonstrates the applicability and utility of our Qdot-based labeling approach in the investigation of DAT regulation in living cells.
Figure 6.
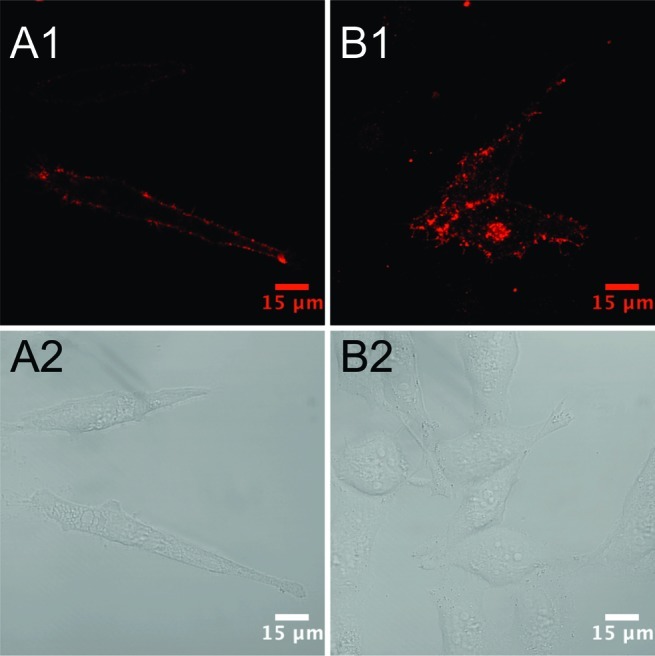
Visualization of DAT internalization in HeLa cells transiently expressing DAT using IDT444-SavQdot conjugates. PMA promotes internalization of the DAT-Qdot complex in live HeLa cells transiently transfected with DAT-pcDNA3. The cells were incubated with 100 nM solution of IDT444 in the imaging buffer for 5 min at 37 °C and subsequently exposed to 1 nM SavQdot in the imaging buffer for 2–3 min at 37 °C before incubation in the absence (A1,A2) or presence of 1 μM PMA (B1,B2) for 30 min at 37 °C. Images are representative of at least three independent experiments.
Qdot Photostability
To demonstrate that our Qdot-based labeling approach can be used as a tool to visualize DAT over extended periods of time, we compared SavQdots to a standard organic dye FITC. Individual 8-bit images (512 × 512 pixels, 1 Airy unit) were acquired every 30 s for 10 min at a scan speed of 51.20 μs/pixel, with laser intensity set to 20% (Figure 7A). Fluorescence intensity of Qdot or FITC DAT membrane labeling in Flp-In-293 cells was quantified, normalized, and plotted as a function of acquisition time (Figure 7B). Each data point represents average integrated membrane fluorescence intensity for 6 cells from two independent experiments. In the case of FITC, bleaching occurs within 300 s (Inorm < 0.2), whereas the intensity of Qdot labeling undergoes minimal decrease within 600 s. The photobleaching issue becomes important when one is monitoring biological processes for longer periods of time at high temporal resolution. Excellent photostability of Qdots makes our Qdot-based labeling approach an excellent candidate for monitoring changes in DAT surface expression level and cellular localization for prolonged periods of time at temporal resolution higher than that allowed by the use of traditional fluorophores.
Figure 7.
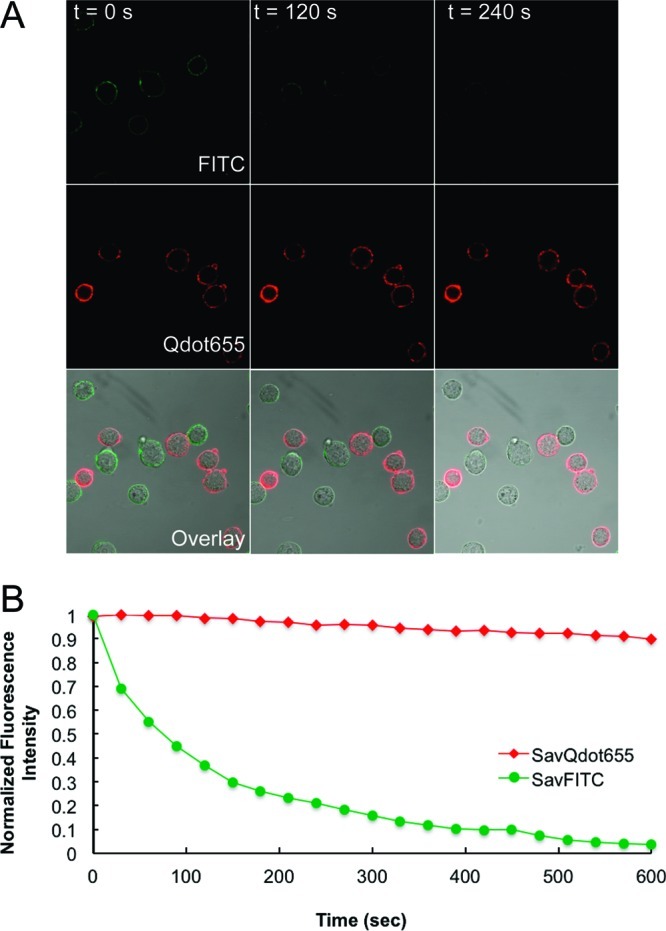
Photostability comparison between Qdot655 and FITC. (A) Top row: DAT-Flp-In-293 cells labeled with IDT444 and SavFITC. Bottom row: DAT-Flp-In-293 cells labeled with IDT444 and SavQdot655. The time-lapse image series were acquired on the Zeiss LSM 510 inverted confocal microscope with the 488 nm excitation laser, a 650 nm long pass filter (Qdot), or a 505–550 nm band-pass filter (FITC), and Zeiss Plan-Apo oil immersion objective (63×, NA 1.40). Images (512 × 512 pixels, 1 Airy unit) were acquired every 30 s for 10 min at a scan speed of 51.20 μs/pixel, with laser intensity set to 20%. Images at 0, 120, and 240 s are shown. (B) Quantitative analysis of changes in intensities of SavQdot655 and SavFITC. Membrane-associated intensity was quantified for each frame by integrating fluorescence intensity over a manually drawn region encompassing the membrane area, with DIC images serving as a reference point (Metamorph). Intensity values were normalized with respect to the highest intensity value obtained (I/I0, where I0 = Imax).
Conclusion
To summarize, our goal for the current effort was to develop a DAT-specific ligand and demonstrate specific labeling of cell surface DAT using Qdot-based detection. The biotinylated derivative of the β-CFT cocaine analogue, IDT444, was prepared by attaching the biotin-PEG-alkyl group to the tropane nitrogen. The ability to visualize mammalian cells stably expressing DAT with SavQdot-IDT444 conjugates was clearly demonstrated by flow cytometry and confocal microscopy for Flp-In-293 cells in suspension and HeLa cells in situ. We determined that DAT-expressing cells can be detected using a combination of low nanomolar concentrations of IDT444 and picomolar concentrations of SavQdots, as assessed by flow cytometry. The relatively high sensitivity of our approach in combination with short sample preparation time renders IDT444 useful in a quantum-dot-based fluorescent assay to monitor DAT expression, function, cellular distribution, and regulation. Specifically, we demonstrated the applicability and utility of our approach in the visualization of acute, PKC-dependent DAT internalization. Due to its sensitivity and flexibility, the quantum dot-based fluorescent assay platform we describe can potentially replace conventional biochemical and radiolabeled isotope-based approaches to study the distribution and regulation of DAT proteins, and may also be useful in high-throughput screening of novel DAT modulators. If issues related to blood-brain barrier penetration of Qdots can be overcome, it is not unreasonable to consider whether our approach might not also be of diagnostic utility for perturbations of in vivo DAT levels in addiction, neuropsychiatric, or neurodegenerative disorders. Finally, our Qdot-based approch should allow appropriation of the unique photophysical properties of Qdots to achieve time-lapse imaging of single DAT molecules in living cells for prolonged periods of time combined with improved temporal resolution, providing new opportunities to elucidate the molecular mechanisms supporting DAT regulation.
Methods
Materials
All reagents were purchased from VWR or Sigma-Aldrich and used without further purification unless otherwise noted. Analytical TLC was performed on commercial plates obtained from Sorbent Technologies (Atlanta, GA) coated with silica gel with a UV indicator (cat. no. 1634126), and spots were located by UV light (254 and 365 nm). Silica gel for flash chromatography was obtained from Sorbent Technologies (60 Å, 230–400 mesh). Biotinylated PEG5000 NHS ester was obtained from Laysan Bio (Arab, AL). Streptavidin-conjugated quantum dots with a maximum fluorescence emission at 655 nm (SavQdots655) were obtained as a 1 μM solution dissolved in borate buffer at pH 8.5 from Invitrogen (Carlsbad, CA). GBR12909 was obtained from Tocris Bioscience (Ellisville, MI). Streptavidin-conjugated fluorescein isothiocyanate (SavFITC) was purchased from Invitrogen (Carlsbad, CA).
Ligand Synthesis
A mixture of the diastereoisomers (1a) and (1b) was synthesized from tropanone using the method described by Meltzer et al., and these were demethylated with α-chloroethyl chloroformate to give a mixture of the boat (2a) and the chair (2b) in 87% yield (Figure 2A).28 According to Meltzer et al., cocaine analogues (1a) and (1b) both exhibited low nanomolar affinity for DAT; therefore, the biotin-terminated linker arm was attached to both diastereoisomers in the following manner. The alkyl spacer was then attached to the mixture of diastereoisomers (2a) and (2b) by refluxing overnight in acetonitrile with the phthalimide protected alkyl spacer (3) in the presence of potassium carbonate and potassium iodide. This gave the mixture of diasterioisomers (4a) and (4b). Compound (3) was synthesized as previously described by Tomlinson et al.32 The pthalimide protecting group was removed from (4a) and (4b) by stirring a solution of the desired compound in the presence hydrazine mono hydrate to yield the mixtures (5a) and (5b). The final intermediate was conjugated to biotinylated PEG-NHS ester by stirring a solution of the mixture of diastereoisomers of phenyl tropane attached to the amino terminated alkyl spacer with biotinylated PEG5000-NHS in methylene chloride for 24 h. The solution was then evaporated, and the product was washed with diethyl ether to give IDT444 (6). The product was further purified from excess unreacted intermediate (5a,b) by size-exclusion chromatography using PD-10 column (GE Biosciences). The final product was characterized by MALDI-TOF mass spectrometry (Supporting Information Figure S1). Detailed synthetic steps are described in the Supporting Information.
Cell Line Maintenance
The Flp-In 293 host cell line (Invitrogen) was grown in complete medium (D-MEM with 2 mM l-glutamine, 10% FBS, 1% pen/strep) supplemented with 100 μg/mL Hygromycin B in a 37 °C incubator with 5% CO2. The wild-type human DAT (hDAT) cDNA cloned in the pcDNA5/FRT expression vector was transfected into Flp-In-293 cells using the Fugene 6 transfection reagent (Roche, NJ). After 48 h recovery, the cells were grown in medium with 100 μg/mL hygromycin B (100 μg/mL) added for several weeks to select for resistant cells where the cDNA construct had been recombined into the Flp-In site in the Flp-In-293 cells. Prior to fluorescent imaging and flow cytometry experiments, cells were seeded in 24-well polylysine-coated culture plates (BD Biosciences, Bedford, MA). HeLa cell line (ATCC #CCL-2) was grown in complete medium (D-MEM with 2 mM l-glutamine, 10% FBS, 1% penn/strep) in a 37 °C incubator with 5% CO2. For transient transfection experiments, HeLa cells were grown in complete medium in the absence of pen/strep. Twenty-four hours after seeding HeLa cells, nonexpressing (sham) and DAT-expressing pcDNA3 vectors containing the SV40 origin and early promoter region for episomal replication were introduced into HeLa cells. Fugene HD (Roche, NJ) was used to facilitate transient transfection according to the manufacturer’s recommendations. The cells were allowed 24 h post-transfection for successful expression of DAT.
Flp-In 293 Cell Labeling
A two-step labeling assay was utilized to specifically target DAT with the IDT444 ligand and SavQdots655. The cells were incubated in 24-well culture plates with a solution of the biotinylated ligand (IDT444) in PBS (Gibco) for 10 min at 37 °C. Then the contents of each well were pipetted, transferred into 1.5 mL microfuge tubes (Millipore, Billerica, MA), pelleted by centrifugation at 2000 rpm for 5 min, and resuspended in a solution of SavQdots655 in PBS for 5 min at 4 °C. Qdot-labeled cells were washed two times by centrifugation and resuspension in PBS at 4 °C, transferred to 5 mL polystyrene round-bottom tubes (BD Biosciences, Bedford, MA), and assayed for SavQdot655 labeling with flow cytometry and confocal microscopy.
Flow Cytometry
Qdot-labeled cells were analyzed on a BD LSRII flow cytometer (BD Biosciences). Qdot655 fluorescence was detected with the 488 nm excitation laser on the FL3 channel (640 nm long pass filter). Forward (FSC) and side scatter (SSC) data were collected in linear mode, while the FL3 channel data was collected in log mode. Twenty thousand events were collected per sample. FSC and SSC measurements were used to gate the viable cell region to assay for Qdot fluorescence (Supporting Information Figure S2). Median fluorescence intensity (MFI) and robust standard deviation (rSD) were then determined for the gated cell population using Flow Jo (Tree Star, Ashland, OR). See the Supporting Information for detailed explanation of the statistical analysis in Flow Jo.
Confocal Microscopy (Suspended Cells)
Flow cytometry cell samples were also used for confocal image acquisition. A 50 μL aliquot of the suspended cells was transferred onto the 0.13–0.17 mm thin microscope cover glass. DIC and fluorescent images were acquired on the Zeiss LSM 510 inverted confocal microscope with the 488 nm excitation laser, a 650 nm long pass filter (SavQdot655) or a 505–550 nm band-pass filter (SavFITC), and Zeiss Plan-Apo oil immersion objective (63×, NA 1.40).
Confocal Microscopy (Adherent Cells)
HeLa cells were seeded in 8-well chamber slides (Nalge Nunc, Rochester, NY) and transiently transfected as described above. Prior to confocal confocal microscopy, the old medium was aspirated from the chamber slide wells, and HeLa cells were washed 3× with warm imaging buffer (Phenol Red-free DMEM/5%FBS). HeLa cells were then incubated with 100 nM IDT444, washed 3× with warm imaging buffer, incubated with 1 nM SavQdot655, washed 3× with warm imaging buffer, and visualized in 200 μL of warm imaging buffer at 37 °C. DIC and fluorescent images were acquired on the Zeiss LSM 510 inverted confocal microscope with the 488 nm excitation laser, a 650 nm long pass filter, and Zeiss Plan-Apo oil immersion objective (63×, NA 1.40).
Qdot versus FITC Photostability
DAT-Flp-In-293 cells were incubated with 100 nM IDT444 and resuspended in either 1 nM SavQdot or 10 μg/mL SavFITC. The time-lapse image series were acquired on the Zeiss LSM 510 inverted confocal microscope with the 488 nm excitation laser, a 650 nm long pass filter (Qdot) or a 505–550 nm band-pass filter (FITC), and Zeiss Plan-Apo oil immersion objective (63×, NA 1.40). Images (512 × 512 pixels, 1 Airy unit) were acquired every 30 s for 10 min at a scan speed of 51.20 μs/pixel, with laser intensity set to 20%. Membrane-associated intensity was quantified for each frame by integrating fluorescence intensity over a manually drawn region encompassing the membrane area, with DIC images serving as a reference point (Metamorph). Intensity values were normalized with respect to the highest intensity value obtained (I/I0, where I0 = Imax).
Acknowledgments
The authors would like to thank Dr. Michael R. Warnement and Dr. Michael A. Schreuder for helpful discussions, Jane Wright and Qiao Han for help with cell line maintenance, and Josh Swartz for help with size-exclusion chromatography.
Confocal imaging using Zeiss LSM 510 Meta was performed in part through the use of the VUMC Cell Imaging Shared Resource supported by NIH Grants CA68485, DK20593, DK58404, HD15052, DK59637, and EY08126. Flow cytometry experiments were performed in the VMC Flow Cytometry Shared Resource supported by the Vanderbilt Ingram Cancer Center (P30 CA68485) and the Vanderbilt Digestive Disease Research Center (DK058404). This work was supported by NIH Grants EB003728 to S.J.R., and DA07390 and DA027739 to R.D.B.
Supporting Information Available
Detailed synthetic steps and ligand characterization, flow cytometry analysis, and Qdot labeling of HeLa cells in suspension. This material is available free of charge via the Internet at http://pubs.acs.org.
Funding Statement
National Institutes of Health, United States
Supplementary Material
References
- Giros B.; Caron M. G. (1993) Molecular characterization of the dopamine transporter. Trends Pharmacol. Sci. 14(2), 43–49. [DOI] [PubMed] [Google Scholar]
- Darvas M.; Palmiter R. D. (2010) Restricting dopaminergic signaling to either dorsolateral or medial striatum facilitates cognition. J. Neurosci. 30(3), 1158–1165. [DOI] [PMC free article] [PubMed] [Google Scholar]
- Bannon M. J. (2004) Dopamine. Nature Encyclopedia of Life Sciences, Nature Publishing Group, retrieved May 6, 2010 from www.els.net. [Google Scholar]
- Swanson J. M.; Flodman P.; Kennedy J.; Spence M. A.; Moyzis R.; Schuck S.; Murias M.; Moriarity J.; Barr C.; Smith M.; Posner M. (2000) Dopamine genes and ADHD. Neurosci. Biobehav. Rev. 24(1), 21–25. [DOI] [PubMed] [Google Scholar]
- Greenwood T. A.; Alexander M.; Keck P. E.; McElroy S.; Sadovnick A. D.; Remick R. A.; Kelsoe J. R. (2001) Evidence for linkage disequilibrium between the dopamine transporter and bipolar disorder. Am. J. Med. Genet. 105(2), 145–151. [DOI] [PubMed] [Google Scholar]
- Tremblay L. K.; Naranjo C. A.; Graham S. J.; Herrmann N.; Mayberg H. S.; Hevenor S.; Busto U. E. (2005) Functional neuroanatomical substrates of altered reward processing in major depressive disorder revealed by a dopaminergic probe. Arch. Gen. Psychiatry 62(11), 1228–1236. [DOI] [PubMed] [Google Scholar]
- Sulzer D. (2007) Multiple hit hypotheses for dopamine neuron loss in Parkinson’s disease. Trends Neurosci. 30(5), 244–250. [DOI] [PubMed] [Google Scholar]
- Swerdlow N. R.; Koob G. F. (1987) Dopamine, schizophrenia, mania, and depression: Toward a unified hypothesis of cortico-striatopallido-thalamic function. Behav. Brain Sci. 10(02), 197–208. [Google Scholar]
- Usiello A.; Baik J.-H.; Rouge-Pont F.; Picetti R.; Dierich A.; LeMeur M.; Piazza P. V.; Borrelli E. (2000) Distinct functions of the two isoforms of dopamine D2 receptors. Nature 408(6809), 199–203. [DOI] [PubMed] [Google Scholar]
- Giros B.; Jaber M.; Jones S. R.; Wightman R. M.; Caron M. G. (1996) Hyperlocomotion and indifference to cocaine and amphetamine in mice lacking the dopamine transporter. Nature 379(6566), 606–12. [DOI] [PubMed] [Google Scholar]
- Raul R. G.; Sara R. J.; Marc G. C. (1999) Functional hyperdopaminergia in dopamine transporter knock-out mice. Biol. Psychiatry 46(3), 303–311. [DOI] [PubMed] [Google Scholar]
- Ralph R. J.; Paulus M. P.; Fumagalli F.; Caron M. G.; Geyer M. A. (2001) Prepulse Inhibition Deficits and Perseverative Motor Patterns in Dopamine Transporter Knock-Out Mice: Differential Effects of D1 and D2 Receptor Antagonists. J. Neurosci. 21(1), 305–313. [DOI] [PMC free article] [PubMed] [Google Scholar]
- Schmitt K. C.; Reith M. E. A. (2010) Ann. N.Y. Acad. Sci. 1187, 316–340. [DOI] [PubMed] [Google Scholar]
- Eriksen J.; Jorgensen T. N.; Gether U. (2010) Regulation of dopamine transporter function by protein-protein interactions: new discoveries and methodological challenges. J. Neurochem. 113(1), 27–41. [DOI] [PubMed] [Google Scholar]
- Furman C. A.; Chen R.; Guptaroy B.; Zhang M.; Holz R. W.; Gnegy M. (2009) Dopamine and amphetamine rapidly increase dopamine transporter trafficking to the surface: live-cell imaging using total internal reflection fluorescence microscopy. J. Neurosci. 29(10), 3328–3336. [DOI] [PMC free article] [PubMed] [Google Scholar]
- Eriksen J.; Rasmussen S. G.; Rasmussen T. N.; Vaegter C. B.; Cha J. H.; Zou M. F.; Newman A. H.; Gether U. (2009) Visualization of dopamine transporter trafficking in live neurons by use of fluorescent cocaine analogs. J. Neurosci. 29(21), 6794–808. [DOI] [PMC free article] [PubMed] [Google Scholar]
- Haraguchi T. (2002) Live cell imaging: approaches for studying protein dynamics in living cells. Cell Struct. Funct. 27(5), 333–334. [DOI] [PubMed] [Google Scholar]
- Adkins E. M.; Samuvel D. J.; Fog J. U.; Eriksen J.; Jayanthi L. D.; Vaegter C. B.; Ramamoorthy S.; Gether U. (2007) Membrane Mobility and Microdomain Association of the Dopamine Transporter Studied with Fluorescence Correlation Spectroscopy and Fluorescence Recovery after Photobleaching. Biochemistry 46(37), 10484–10497. [DOI] [PubMed] [Google Scholar]
- Bruchez M. Jr.; Moronne M.; Gin P.; Weiss S.; Alivisatos A. P. (1998) Semiconductor Nanocrystals as Fluorescent Biological Labels. Science 281(5385), 2013–2016. [DOI] [PubMed] [Google Scholar]
- Chan W. C. W; Nie S. (1998) Quantum Dot Bioconjugates for Ultrasensitive Nonisotopic Detection. Science 281(5385), 2016–2018. [DOI] [PubMed] [Google Scholar]
- Pinaud F.; Clarke S.; Sittner A.; Dahan M. (2010) Probing cellular events, one quantum dot at a time. Nat. Methods 7(4), 275–285. [DOI] [PubMed] [Google Scholar]
- Rosenthal S. J.; Chang J. C.; Kovtun O.; McBride J. R.; Tomlinson I. D. (2011) Biocompatible Quantum Dots for Biological Applications. Chem. Biol. 18(1), 10–24. [DOI] [PMC free article] [PubMed] [Google Scholar]
- Rosenthal S. J.; Tomlinson I.; Adkins E. M.; Schroeter S.; Adams S.; Swafford L.; McBride J.; Wang Y.; DeFelice L. J.; Blakely R. D. (2002) Targeting Cell Surface Receptors with Ligand-Conjugated Nanocrystals. J. Am. Chem. Soc. 124(17), 4586–4594. [DOI] [PubMed] [Google Scholar]
- Tomlinson I. D.; Mason J.; Burton J. N.; Blakely R.; Rosenthal S. J. (2003) The design and synthesis of novel derivatives of the dopamine uptake inhibitors GBR 12909 and GBR 12935. High-affinity dopaminergic ligands for conjugation with highly fluorescent cadmium selenide/zinc sulfide core/shell nanocrystals. Tetrahedron 59(40), 8035–8047. [Google Scholar]
- Tomlinson I. D.; Mason J. N.; et al. (2006) High affinity inhibitors of the dopamine transporter (DAT): Novel biotinylated ligands for conjugation to quantum dots. Bioorg. Med. Chem. Lett. 16(17), 4664–4667. [DOI] [PubMed] [Google Scholar]
- Clarke R. L.; Daum S. J.; Gambino A. J.; Aceto M. D.; Pearl J.; Levitt M.; Cumiskey W. R.; Bogado E. F. (1973) Compounds affecting the central nervous system. 4. 3 Beta-phenyltropane-2-carboxylic esters and analogs. J. Med. Chem. 16(11), 1260–1267. [DOI] [PubMed] [Google Scholar]
- Carroll F. I.; Lewin A. H.; Boja J. W.; Kuhar M. J. (1992) Cocaine receptor: biochemical characterization and structure–activity relationships of cocaine analogues at the dopamine transporter. J. Med. Chem. 35(6), 969–981. [DOI] [PubMed] [Google Scholar]
- Meltzer P. C.; Blundell P.; Zona T.; Yang L.; Huang H.; Bonab A. A.; Livni E.; Fischman A.; Madras B. K. (2003) A Second-Generation 99mTechnetium Single Photon Emission Computed Tomography Agent That Provides in Vivo Images of the Dopamine Transporter in Primate Brain. J. Med. Chem. 46(16), 3483–3496. [DOI] [PubMed] [Google Scholar]
- Davis M. R.; Votaw J. R.; Bremner J. D.; Byas-Smith M. G.; Faber T. L.; Voll R. J.; Hoffman J. M.; Grafton S. T.; Kilts C. D.; Goodman M. M. (2003) Initial Human PET Imaging Studies with the Dopamine Transporter Ligand 18F-FECNT. J. Nucl. Med. 44(6), 855–861. [PubMed] [Google Scholar]
- Rinne J.; Ruottinen H.; Bergman J.; Haaparanta M.; Sonninen P.; Solin O. (1999) Usefulness of a dopamine transporter PET ligand [18F]β-CFT in assessing disability in Parkinson’s disease. J. Neurol., Neurosurg. Psychiatry 67(6), 737–741. [DOI] [PMC free article] [PubMed] [Google Scholar]
- Harada N.; Ohba H.; Fukumoto D.; Kakiuchi T.; Tsukada H. (2004) Potential of [(18)F]beta-CFT-FE (2beta-carbomethoxy-3beta-(4-fluorophenyl)-8-(2-[(18)F]fluoroethyl)nortropane) as a dopamine transporter ligand: A PET study in the conscious monkey brain. Synapse 54(1), 37–45. [DOI] [PubMed] [Google Scholar]
- Bentzen E. L.; Tomlinson I. D.; Mason J.; Gresch P.; Warnement M. R.; Wright D.; Sanders-Bush E.; Blakely R.; Rosenthal S. J. (2005) Surface modification to reduce nonspecific binding of quantum dots in live cell assays. Bioconjugate Chem. 16(6), 1488–1494. [DOI] [PubMed] [Google Scholar]
- Hösli E.; Hösli L. (1997) Autoradiographic studies on the uptake of 3H-dopamine by neurons and astrocytes in explant and primary cultures of rat CNS: effects of uptake inhibitors. Int. J. Dev. Neurosci. 15(1), 45–53. [DOI] [PubMed] [Google Scholar]
- Inazu M.; Kubota N.; Takeda H.; Zhang J.; Kiuchi Y.; Oguchi K.; Matsumiya T. (1999) Pharmacological characterization of dopamine transport in cultured rat astrocytes. Life Sci. 64(24), 2239–2245. [DOI] [PubMed] [Google Scholar]
- Blakely R. D.; Bauman A. L. (2000) Biogenic amine transporters: regulation in flux. Curr. Opin. Neurobiol. 10, 328–336. [DOI] [PubMed] [Google Scholar]
- Daniels G. M.; Amara S. G. (1999) Regulated trafficking of the human dopamine transporter. Clathrin-mediated internalization and lysosomal degradation in response to phorbol esters. J. Biol. Chem. 274, 35794–35801. [DOI] [PubMed] [Google Scholar]
- Melikian H. E.; Buckley K. M. (1999) Membrane trafficking regulates the activity of the human dopamine transporter. J. Neurosci. 19, 7699–7710. [DOI] [PMC free article] [PubMed] [Google Scholar]
- Kurian M. A.; Zhen J.; Cheng S.-Y.; Li Y.; Mordekar S. R.; Jardine P.; Morgan N. V.; Meyer E.; Tee L.; Pasha S.; Wassmer E.; Heales S. J. R.; Gissen P.; Reith M. E. A.; Maher E. R. (2009) Homozygous loss-of-function mutations in the gene encoding the dopamine transporter are associated with infantile parkinsonism-dystonia. J. Clin. Invest. 119(6), 1595–1603. [DOI] [PMC free article] [PubMed] [Google Scholar]
- Tomlinson I. D.; Gies A. P.; Gresch P. J.; Dillard J.; Orndorff R. L.; Sanders-Bush E.; Hercules D. M.; Rosenthal S. J. (2006) Universal polyethylene glycol linkers for attaching receptor ligands to quantum dots. Bioorg. Med. Chem. Lett. 16(24), 6262–6266. [DOI] [PubMed] [Google Scholar]
Associated Data
This section collects any data citations, data availability statements, or supplementary materials included in this article.