Abstract
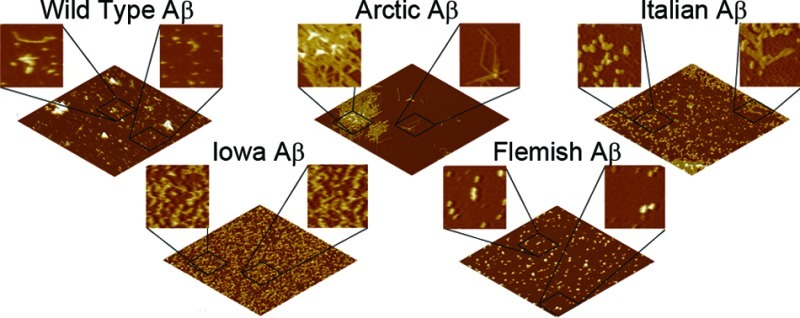
A pathological hallmark of Alzheimer’s disease (AD), a late onset neurodegenerative disease, is the development of neuritic amyloid plaques, composed predominantly of aggregates of the β-amyloid (Aβ) peptide. It has been demonstrated that Aβ can aggregate into a variety of polymorphic aggregate structures under different chemical environments, and a potentially important environmental factor in dictating aggregate structure is the presence of surfaces. There are also several mutations clustered around the central hydrophobic core of Aβ (E22G Arctic mutation, E22K Italian mutation, D23N Iowa mutation, and A21G Flemish mutation). These mutations are associated with hereditary diseases ranging from almost pure cerebral amyloid angiopathy (CAA) to typical Alzheimer’s disease pathology. The goal of this study was to determine how these mutations influence the morphology of Aβ aggregates under free solution conditions and at an anionic surface/liquid interface. While the rate of formation of specific aggregates was altered by mutations in Aβ under free solution conditions, the respective aggregate morphologies were similar. However, aggregation occurring directly on a negatively charged mica surface resulted in distinct aggregate morphologies formed by different mutant forms of Aβ. These studies provide insight into the potential role anionic surfaces play in dictating the formation of Aβ polymorphic aggregate structures.
Keywords: Atomic force microscopy, Alzheimer’s disease, β-amyloid, point mutations in Aβ, polymorphic aggregate formation, protein aggregation
A common motif associated with many neurodegenerative diseases is the formation of extended, β-sheet rich, proteinaceous fibrillar aggregates that are commonly referred to as amyloids.1 Neuritic amyloid plaques composed predominately of the β-amyloid peptide (Aβ), a cleavage product of the amyloid precursor protein (APP), are a neuropathological hallmark of Alzheimer’s disease. The process of fibril formation is complex, with several metastable intermediate aggregates associated with the fibrillization pathway.2 Such intermediate species include globular oligomers, protofibrils, and annular aggregates. The elusive toxic species along the aggregation pathway, whether monomeric or higher-order, may subsequently initiate a cascade of pathogenic protein–protein interactions that culminate in neuronal dysfunction. The precise timing of such interactions and the mechanisms by which altered protein conformations or aggregates trigger neuronal dysfunction are unclear.
An interesting observation commonly associated with the aggregation of many amyloid forming peptides is their ability to form a variety of morphologically distinct and stable fibril structures, commonly referred to as polymorphs.3 The ability of Aβ to form distinct polymorphic fibril structures is well-known and highly dependent on the chemical environment of the peptide during the aggregation process.4−6 Aggregation conditions that lead to these distinct polymorphic fibrils can modulate toxicity associated with Aβ. For example, subtle alterations in fibril growth conditions results in two structurally distinct polymorphic fibrils of Aβ(1–40) with significantly different levels of toxicity to neuronal cell cultures.7 Further studies have indentified other fibrillar polymorphs of Aβ extracted from AD patient brains that had the ability to seed further aggregation.8 More recent studies demonstrated variations in Aβ(1–40) sample preparation result in at least five structurally distinct fibrillar aggregates in vitro.6
While chemical preparation and seeding are factors associated with the formation of polymorphic aggregates of Aβ, surface induced conformational changes may also play a critical role. This is demonstrated by studies of Aβ aggregation using in situ tapping mode atomic force microscopy (AFM) in physiological buffer solutions. Small, highly mobile, globular aggregates of both Aβ(1–40)9 and Aβ(1–42)10 were observed on mica. With time, they organized into elongated prefibrillar aggregates that continued to grow in length. Aggregation of Aβ(1–42) on a graphite surface resulted in distinct polymorphic aggregate structures compared to those formed on mica.10 Such results indicate that surface interactions influence Aβ self-assembly. As Aβ in a physiological or cellular environment is exposed to a variety of surfaces (lipid membranes, for example), the ability of surface interactions to dictate aggregate structure may play a role in the formation of potentially toxic aggregates associated with AD.
There are several point mutations in APP that are associated with a variety of familial forms of Alzheimer’s disease.11 Several of these point mutations (E22G Arctic mutation, E22K Italian mutation, D23N Iowa mutation, and A21G Flemish mutation) (Figure 1) are clustered around the central hydrophobic core of the Aβ fragment at positions 21–23. Excluding the Flemish mutation, these missense mutations are not associated with increased Aβ secretion12−17 and have a greater propensity of the peptide to aggregate into protofibrils and/or fibrils than Aβ Wild Type (WT).14,18−21 The Arctic, Italian, and Iowa mutations of Aβ(1–40) are reported to be more toxic to neuroblastoma cells in vitro.11,15,22−26
Figure 1.
Experimental systems. Schematic representation of the Aβ peptide with point mutations used in this study and occurring between the 21–23 amino acid sequence of Aβ(1–40) indicated. These mutations include Arctic, Italian, Iowa, and Flemish.
The altered charge of mutant Aβ peptides can influence their interactions with surfaces, resulting in altered aggregation process both kinetically and morphologically. Such changes would potentially impact the deposition, proteolytic susceptibility, clearance rates, and cellular toxicity of Aβ. Here, we seek to determine how point mutations in the central region of Aβ altered the aggregation process at an anionic surface/liquid interface. For these studies, we compared the aggregation of Wild Type Aβ(1–40) with Aβ(1–40) containing the E22G Arctic, E22K Italian, D23N Iowa, or A21G Flemish mutations. Because traditional light and electron microscopic approaches have important limitations for studying heterogeneous mixtures of Aβ aggregates, we used atomic force microscopy (AFM) to characterize the morphology of the assembly states of the different Aβ peptides. AFM is uniquely well suited to study amyloidogenic proteins, as it is capable of obtaining three-dimensional surface maps with nanometer spatial resolution in solution in the absence of artifacts from sample processing. Our aim was to determine the role point mutations play in determining aggregate morphology, kinetics of formation, and interactions with an anionic surface.
Results and Discussion
Point Mutations in the Central Region of Aβ Result in Variable Rates of Aggregation
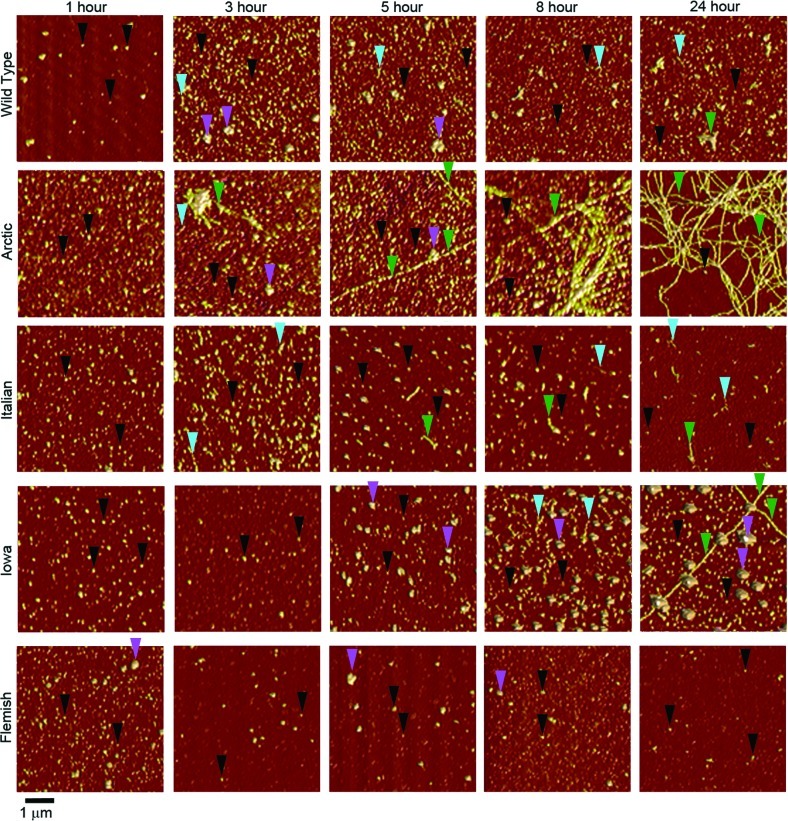
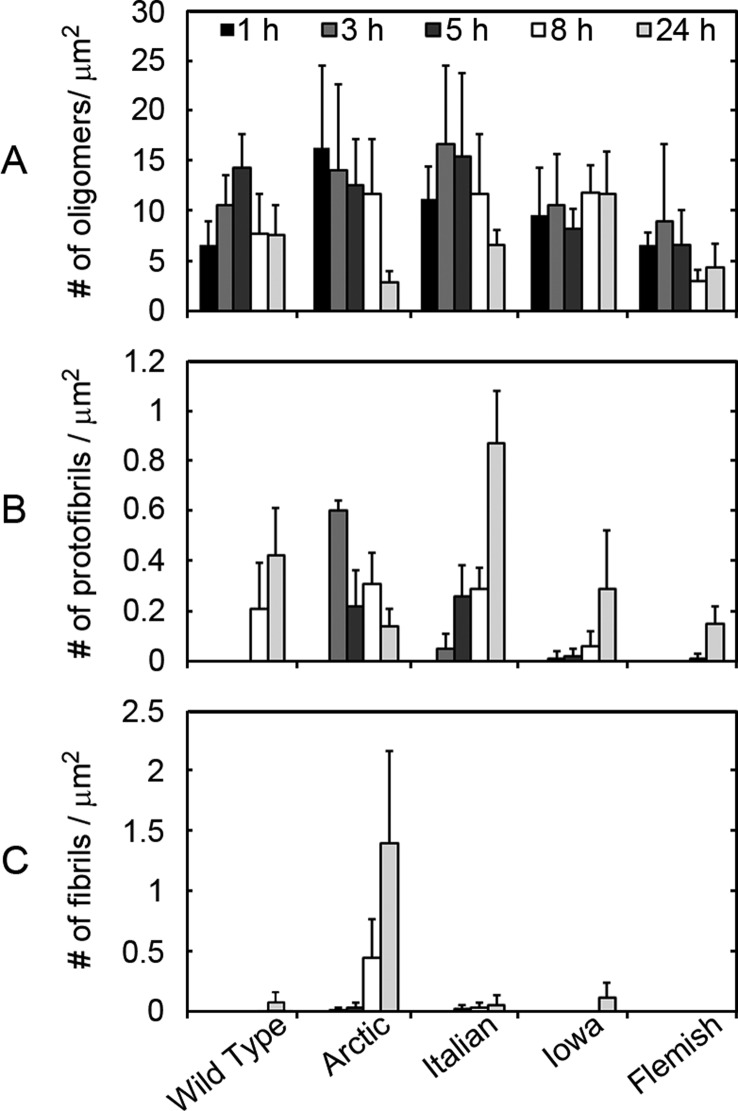
To determine how point mutations in the central region of Aβ alter aggregation under free solution conditions (without the presence of a surface), we prepared separate incubations of Wild Type, Italian, Arctic, Flemish, and Iowa Aβ at 20 μM. After dilution into phosphate-buffered saline (PBS), these solutions were incubated at 37 °C and sampled for ex situ AFM analysis at 1, 3, 5, 8, and 24 h (Figure 2). To quantify the relationship between oligomer, protofibril, and fibril formation, the number of each respective aggregate type per square micrometer was determined by use of automated image analysis software (Figure 3). For this analysis, aggregate types were defined strictly by morphological features (Supporting Information Figure 1). Oligomers were defined as aggregates that were at least 1 nm in height and had an aspect ratio (longest distance across to shortest distance across) of less than 2.5, which indicated a predominantly round, globular structure. Protofibrils and fibrils were defined as aggregates with heights larger than 1 nm and an aspect ratio greater than 2.5. These elongated aggregates were further separated by a height filter. Protofibrils were defined as being 1–4 nm in height, whereas fibrils were larger than 4 nm in height anywhere along their contour. The characteristic morphological features associated with these distinct aggregate types were justified by measurements performed on representative aggregates in images. When fibrils grew long enough to intertwine and be detected as a single aggregate, the number of fibrils bundled together was estimated visually by counting. The incubations were performed in triplicate. Five 25 μm2 images of different areas of the mica substrate were taken and analyzed at each time point for every replicate (a total of 15 images per data point in Figure 3). It should be noted that, at some time points, annular aggregates were observed (Supporting Information Figure 2). There were two types of annular aggregates: larger rings with inner diameter greater than 100 nm and smaller rings with inner diameter smaller than 25 nm. The larger annular aggregates possessed heights similar to those of fibrils; meanwhile, the smaller annular aggregates were similar to protofibrils in height. However, as these annular aggregates were rare, they were not included in further analysis.
Figure 2.
Point mutations in Aβ alter the temporal appearance of distinct aggregate forms. AFM images demonstrate the aggregation of Wild Type, Arctic, Italian, Iowa, or Flemish Aβ(1–40). Incubations with protein concentration of 20 μM were imaged at different time points after the dilution of DMSO stocks into PBS buffer. Examples of oligomers, the larger subpopulation oligomers, protofibrils, and fibrils are indicated by black, magenta, blue, and green arrows, respectively. At 1 h, Wild Type and mutant Aβ peptides all formed predominately oligomeric aggregates. However, heterogeneous mixtures of aggregate types appeared at later times for all incubations.
Figure 3.
Quantification of the temporal appearance of distinct Aβ aggregate forms with respect to mutation. Quantification of aggregate types observed in AFM images for 20 μM incubations of Wild Type, Arctic, Italian, Iowa, or Flemish Aβ(1–40). The numbers of (A) oligomeric, (B) protofibrillar, and (C) fibrillar aggregates per square micrometer were calculated from AFM images taken at discrete time points for each incubation (for examples of images, see Figure 2). The appearance of protofibrillar and fibrillar aggregates varied for the different Aβ peptides.
Oligomeric structures were observed for all forms of Aβ within 1 h. The appearance of protofibrillar and fibrillar aggregates depended on the specific form of Aβ, with these structures appearing after different incubation times. Images (Figure 2) and quantification of distinct aggregate types per unit area (Figure 3) demonstrated that aggregation results in a heterogeneous mixture of aggregate forms (under free solution conditions at any given time), which is influenced by the presence of disease-related point mutations in Aβ. The number of oligomers per unit area in Wild Type incubations gradually increased, reaching a maximum population at the 5 h time point. After this initial increase, the population of Wild Type oligomers decreased as protofibrils (8 h) and fibrils (24 h) appeared. There was also a subpopulation of larger oligomer (that is, globular) species observed throughout the Wild Type Aβ aggregation experiment. Due to their “bumpy” morphology, these larger oligomers were most likely accumulations of smaller globular aggregates. Fibrils of Wild Type Aβ at the 24 h time point were typically a few hundred nanometers to a micrometer in length. The same aggregation pattern emerged for the Italian form of Aβ. However, the maximum population of oligomers occurred at an earlier time-point (3 h) that corresponded with the appearance of protofibrils at 3 h. Fibrils of Italian Aβ also appeared (5 h) more quickly in comparison to Wild Type, which is compatible with previous reports indicating that Italian Aβ aggregates with faster kinetics.27 Despite appearing at a much earlier time point, fibrils of Italian Aβ observed after 24 h of incubation were similar in length to those observed by Wild Type at the same time point. The population of oligomers peaked at the 1 h time point for incubations of Arctic Aβ. Protofibrils and fibrils appeared after 3 h of incubation for Arctic Aβ, with protofibrils being the more abundant of the two aggregate forms. With time, the number of protofibrils of Arctic Aβ decreased as the fibril population grew. Arctic Aβ demonstrated the most prolific fibril formation, eventually resulting in fibrils that extended over several micrometers in length and formed intertangled meshes or bundles of fibrils. While the initial reports on the aggregation kinetics of Arctic Aβ indicated that the mutation increases protofibril formation but not fibril formation,14 subsequent reports are more consistent with our observations that the Arctic mutation increased the rate of fibril formation.24,28−30 A potential source for this discrepancy is the well documented observations that preparatory conditions have an impact on the types of aggregates formed by Aβ31 and can lead to distinct polymorphic aggregates.6 The Iowa mutation resulted in a steady population of oligomers, in comparison to the other Aβ forms. Similar to Wild Type, a subpopulation of larger oligomers (globular morphology) also formed in incubations of Iowa Aβ. Protofibrils appeared after 3 h of incubation for Iowa Aβ, which was faster compared to Wild Type but similar to Italian and Arctic Aβ. Despite the early appearance of protofibrils, fibrils of Iowa Aβ were not observed until 24 h of incubation, yet these fibrils were very long, extending several micrometers in length. Flemish Aβ formed oligomers with a peak population appearing after 3 h of incubation, but unlike the other forms of Aβ this peak did not correspond with the appearance of protofibrils (appeared at 8 h) or fibrils (were not observed during the 24 h incubation). A subpopulation of larger oligomers comprising Flemish Aβ, similar to that observed for Wild Type, was observed. Overall, our observations are consistent with reports that the Flemish mutant reduces the rate of Aβ aggregation and fibril formation.21,27,32
Aggregation of Wild Type or Mutant Forms of Aβ Results in Similar Aggregate Morphologies under Free Solution Conditions
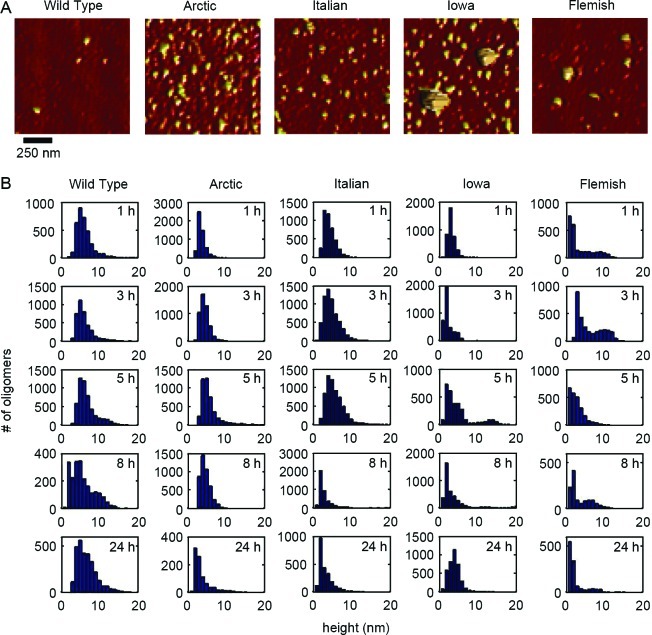
While we had automatically quantified the populations of aggregate forms based on morphological criteria, we next wanted to determine if, once formed, there were more subtle morphological differences within these aggregate categories as a function of these specific point mutations in Aβ. Representative AFM images and size analysis of oligomers are presented in Figure 4. The morphological dimension chosen for this comparison was aggregate height because this measurement contains the least amount of distortion associated with the finite size and shape of the AFM probe tip. Due to the large numbers of oligomers observed at each time point, we were able to construct height histograms of all aggregates that met the morphological requirements to be considered oligomers as a function of time. While the majority of oligomers formed from Wild Type Aβ were ∼4–6 nm tall at all time points, after 5 h a second, larger subpopulation of oligomers appeared, as evidenced by a shoulder or secondary peak in the height histograms. While larger oligomers were observed for the other mutant forms of Aβ, only with the Flemish and Iowa mutation did the population of these larger oligomers become high enough to result in a distinct second peak in the histograms. The majority of oligomers formed by Italian Aβ were slightly smaller compared to Wild Type. The Italian Aβ oligomers were predominately 2–4 nm tall at 1, 3, and 5 h; however, Italian Aβ oligomers were significantly smaller (∼1–2 nm) after 8 and 24 h of incubation. Oligomers formed from Arctic Aβ gradually transitioned to larger aggregate forms based on height before becoming smaller at later time points (2–3 nm at 1 h; 2–4 nm at 3 h; 3–4 nm at 5 h; 2–4 nm at 8 h; and 1–2 nm at 24 h). Iowa Aβ formed oligomers that were consistently 1–3 nm in height; however, at the 24 h time point, the size of the oligomers shifted to 3–5 nm. At all time points except 3 h, oligomers of Flemish Aβ were predominately smaller than 2 nm; however, there was the previously mentioned subpopulation of larger oligomeric aggregates.
Figure 4.
Oligomers formed by Wild Type or mutant Aβ peptides displayed a variety of sizes. (A) Representative ex situ AFM images of oligomeric aggregates of Wild Type, Arctic, Italian, Iowa, or Flemish Aβ(1–40) after 8 h of incubation. Arrows indicate examples of larger oligomeric (globular) aggregates. (B) Height histograms of oligomeric aggregates for each type of Aβ for different incubation time points.
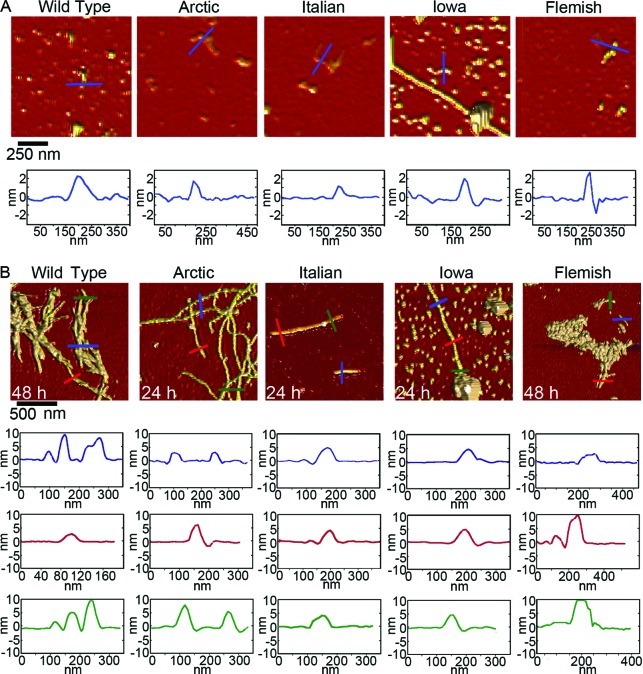
We next compared the morphologies of elongated aggregate structures, that is, protofibrils and fibrils, formed by Wild Type and mutant forms of Aβ (Figure 5). As there were much fewer observed elongated aggregates and the height along the contour of these aggregates was quite variable, we chose to present representative height profiles across these aggregates (Figure 5A). Our morphological criteria used for defining protofibrils was aggregates of 1–4 nm in height with an elongated aspect ratio; however, most (>90% for all Aβ forms) of the observed protofibrils were 1.5–2.5 nm tall. Once formed, protofibrils of Wild Type, Italian, Arctic, Flemish, or Iowa were morphologically indistinguishable from each other. All of the protofibrils displayed various degrees of curvature along their contour and often had an appearance of being a series of connected globular blobs. As fibrils were rare or not observed for some of the variants of Aβ within the 24 h incubation time, we sampled some of our incubations at a 48 h time point to obtain aggregates that satisfied the sorting criteria for fibrils to facilitate morphological comparisons (Figure 5B). Fibrils were defined as having a height anywhere along their contour greater than 4 nm, with no upper limit. Despite this lack of no upper restriction in our criteria, we seldom observed fibrils (for Wild Type and all mutant forms of Aβ) containing a height larger than 10 nm along its contour unless there was a bundling of fibrils or accumulation of other aggregates associated with the fibril. While the criteria for a fibril required at least a portion of the fibril to be taller than 4 nm, there were also regions along fibrils that would be shorter than this limit. However, we never observed a fibril region shorter than 3 nm. Once abundantly formed, fibrils of Wild Type Aβ tended to form bundles. Despite this bundling, regions of Wild Type fibrils not bundled closely resembled fibrils formed from Arctic and Iowa Aβ morphologically, with fibril heights varying from ∼4 to 10 nm along the fibril contour. Fibrils of Italian Aβ tended to not be as tall, seldom having regions taller than 5–6 nm. The fibrils formed from Flemish Aβ were often obscured by accumulation of particulate aggregate forms; however, fibrillar morphologies often extended out from these large structures. These regions of Flemish fibrils were also very similar to those formed by Wild Type.
Figure 5.
Comparison of protofibrillar and fibrillar aggregates formed from Wild Type or mutant Aβ. Representative ex situ AFM images of (A) protofibrils and (B) fibrils of Wild Type, Arctic, Italian, Iowa, or Flemish Aβ(1–40). Height profiles under each image are indicated by colored lines.
Point Mutations in the 21st to 23rd Amino Acid of Aβ Result in Polymorphic Aggregates at Mica Surface/Liquid Interfaces
Previous studies with Aβ and other amyloid forming peptides have demonstrated that fibril formation may be driven by interactions at the interface of aqueous solutions and surfaces.10 Here, we wanted to determine if such a solid/liquid interface could invoke polymorphic aggregate structures in a mutant dependent manner. If mutations exert influence on the interaction of Aβ with surfaces, this would have consequences for a variety of biophysical phenomenon related to Aβ cellular binding, aggregation, and ultimately mechanisms of toxicity, potentially playing a factor in mutation related alterations in disease pathology. For these studies, we characterized the aggregation of Wild Type and mutant Aβ peptides in real time by in situ AFM using hydrophilic mica (which can be considered a mimic of an anionic lipid membrane) as a model surface. Based on recent studies indicating that Aβ oligomers have a higher affinity for lipid membranes with an increased net negative charge,33 the negatively charged mica surface seems to be an appropriate choice for a simple model surface. For these studies, Wild Type or the mutant forms of Aβ were all freshly prepared by the same procedure, to eliminate variance associated with these conditions.
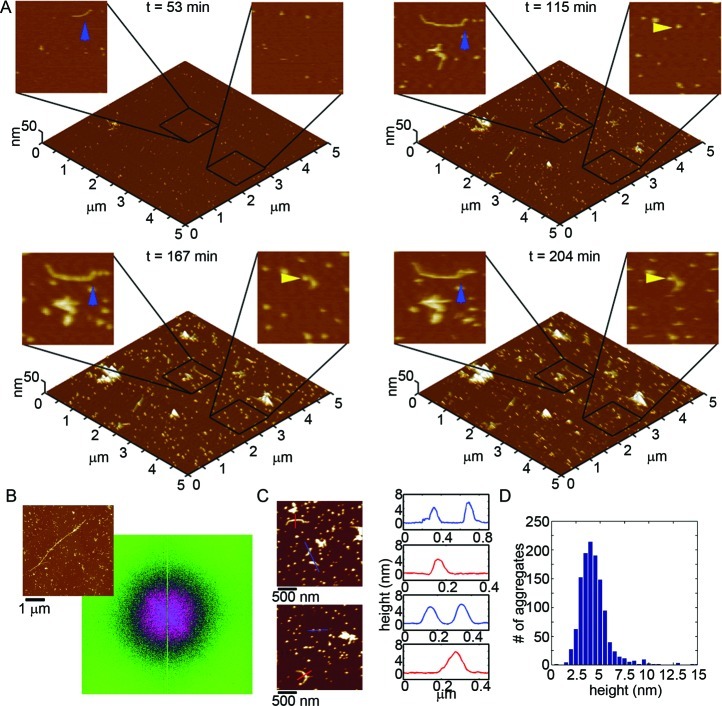
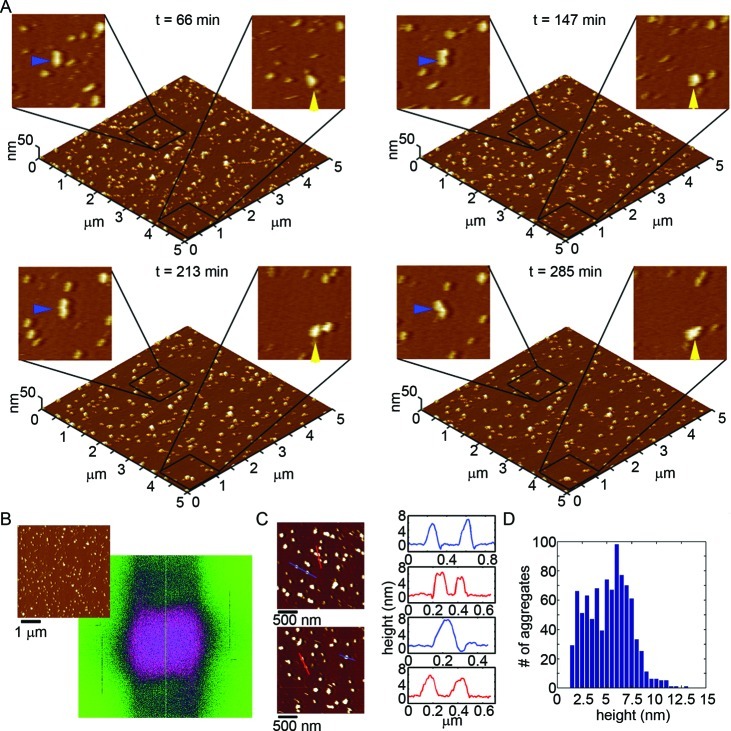
We first tracked the aggregation of Wild Type Aβ(1–40) on a mica surface at 20 μM using in situ AFM (Figure 6 and Supporting Information Movie S1). For the first 20–30 min, several oligomers appeared on the surface, and with time the number of oligomers increased (Movie S1). Some small putative, protofibrillar aggregates were present on mica after ∼35 min. These elongated protofibrils were highly curved and often displayed morphology of connected globules. As they were fully hydrated, these protofibrils were taller than observed in ex situ AFM experiments with Wild Type (Figure 6C). Furthermore, these protofibrillar aggregates displayed varying stability. That is, some of these protofibrils disappeared after a few minutes (Movie S1, blue box), while others remained and grew in size for the remainder of the experiment (Movie S1, green box). With time several oligomers moved together to form protofibrils (Figure 6A, yellow arrows and Movie S1, yellow box), while other migrating oligomers joined the ends of established protofibrillar aggregates (Figure 6A, blue arrows and Movie S1, purple box). These phenomena of oligomers nucleating and adding onto protofibrils most likely underlie the observations that they were similar in height (Figure 6C). Histograms of all aggregates formed at 123 min, which contained a large population of oligomers and protofibrils, displays a tight population of aggregate height of ∼3–5 nm (Figure 6D). However, many of the protofibrillar structures did not appear to have oligomeric precursors. These protofibrils probably formed in solution before depositing on the mica surface. As protofibrils grew into larger aggregate structures, they often accumulated great amounts of Aβ that amorphously clumped around the extended structure (Movie S1, green box). 2D Fourier analysis of a representative image (Figure 6B) demonstrates that there does not appear to be any long-range lateral organization of Wild Type Aβ aggregation on a mica surface. These observations were similar to previous reports.10
Figure 6.
Wild Type Aβ(1–40) aggregates into a variety of structures on mica. (A) Freshly prepared Wild Type Aβ was imaged continuously in solution on mica at a concentration of 20 μM. Images (5 × 5 μm2) are presented as 3D reconstructions with indicated zoomed in 1 × 1 μm2 areas presented in 2D. The yellow arrow indicates an oligomer that coalesced with other oligomers to form a fibrillar aggregate. The blue arrow indicates a fibrillar aggregate that elongated with time and eventually had two discrete oligomers incorporate into its structure. (B) 2D Fourier analysis performed on a representative image (shown to the upper left) demonstrated that Wild Type aggregates did not display long-range order along the mica surface. (C) Height profiles of Wild Type Aβ aggregates on mica (corresponding to the lines indicated in the adjacent images) and (D) height histograms of all aggregates after 123 min of aggregation.
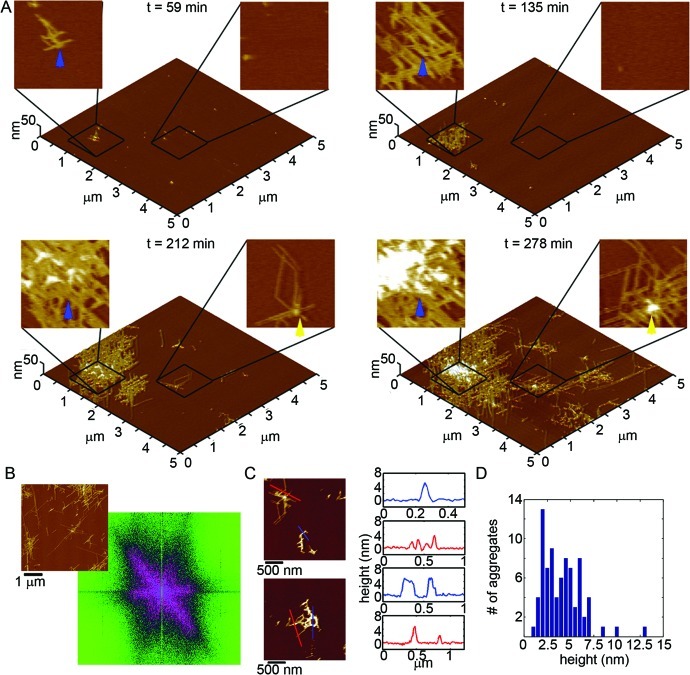
When tracking the aggregation of Arctic Aβ(1–40) on the mica surfaces using in situ AFM (Figure 7A and Supporting Information Movie S2), we observed a distinctly different aggregation pattern compared to Wild Type. For the first ∼50–60 min of observation, oligomers of Arctic Aβ appeared on mica. However, the formation of distinct extended (fibrillar) aggregates soon dominated the aggregation process (blue and yellow arrows in Figure 7A). Several of the oligomers of Arctic Aβ eventually nucleated or were incorporated into these elongated structures (for examples see the boxed areas in Movie S2). In contrast to the extended protofibril aggregates formed by Wild Type Aβ on mica, the extend Arctic aggregates displayed a more rigid morphology (less curvature), were often highly branched, and formed highly ordered arrays along the crystallographic lattice of the mica surface. 2D Fourier analysis of these images (Figure 7B) demonstrates that these aggregates grew predominately in three directions rotated by 60° with respect to each other, supporting an epitaxial patterning of Arctic aggregation by the mica surface. Once formed, these fibrillar aggregates rapidly extended and branched along these three directions. The height along the extended Arctic aggregates was quite variable, ranging from ∼2 to 5 nm along their contours (Figure 7C). While the heights of these Arctic fibril-like aggregates are quite variable (Figure 7D), these structures are primarily composed of thinner ∼2.5 nm tall regions or thicker ∼5 nm tall regions (Figure 7D).
Figure 7.
Arctic Aβ(1–40) forms polymorphic distinct aggregates on mica compared to Wild Type. (A) Freshly prepared Arctic Aβ was imaged continuously in solution on mica at a concentration of 20 μM. 5 × 5 μm2 images are presented as 3D reconstructions with indicated zoomed in 1 × 1 μm2 areas presented in 2D. The yellow and blue arrows indicate the formation and growth of elongated aggregates with time. (B) 2D Fourier analysis performed on a representative image (shown to the upper left) demonstrated that Arctic Aβ aggregation occurred predominately along three directions rotated by 60° with respect to each other. (C) Height profiles of these Aβ aggregates on mica (corresponding to the lines indicated in the adjacent images) and (D) height histograms of all aggregates after 221 min of aggregation.
In order to understand the epitaxial growth of Arctic Aβ on mica, the details of the structure of the underlying substrate and the changes in the peptide associated with the mutation are necessary. These studies were performed on the muscovite form of mica, which belongs to the class of dioctahedral phyllosilicates. Mica has a sheetlike structure consisting of tetrahedral and octahedral layers. The tetrahedral unit consists of SiO4 or AlO4; the octahedral unit is AlO6 or MgO6. A sheet consists of an octahedral layer sandwiched between two tetrahedral layers. An uncompensated charge within the sheetlike structure is caused by a partial substitution of Al3+ for Si4+ in the tetrahedral layers, resulting in the need for an interlayer of potassium cations that leads to the ability to easily cleave mica. Upon cleavage, the tetrahedral layer is the exposed surface, with the tetrahedral subunits being arranged in a slightly distorted hexagonal pattern, providing the epitaxial interface, resulting in the specific orientation of the Arctic Aβ aggregates. The hexagonal pattern of the mica interface does not completely explain why Arctic Aβ formed these orientated extended aggregates while Wild Type Aβ did not. The Arctic mutation replaces a polar, negatively charged glutamic acid with a nonpolar, neutral glycine. The Arctic mutation also results in a shift in the hydropathy index at the 22nd amino acid of Aβ from −3.5 to −0.4, indicating a significant reduction in the hydrophilic nature of the peptide at this region. Furthermore, the side chain of glycine in comparison to glutamic acid is much smaller. All three of these features associated may contribute to the observed unique morphology and epitaxial growth pattern observed for the aggregation of Arctic Aβ on mica. The resulting removal of the negative charge should alter the interaction of Arctic Aβ with the negatively charged mica surface, which may partially contribute to the distinct morphological pattern observed. However, the rate of absorption of peptide to the mica surface, as measured by the surface area covered by protein (Supporting Information Figure 3), was not appreciably different between Wild Type and Arctic Aβ during the first 100 min. Then, despite having a reduced negative charge, the absorption of Arctic Aβ lagged behind Wild Type until the elongated aggregates began to steadily elongate. It appears the reduction in the hydrophilic character of the peptide compensates for the loss of the negative charge with respect to the initial rate of absorption to mica. The average height of 2.5 nm of these fibrillar aggregates is approximately twice that which would be observed for a fully extended peptide, as was observed for Wild Type Aβ on graphite in other studies.10 This height indicates that the individual Arctic Aβ peptides that comprise these structures contain a turn, which can be facilitated by the smaller glycine removing steric hindrance to the required conformation.
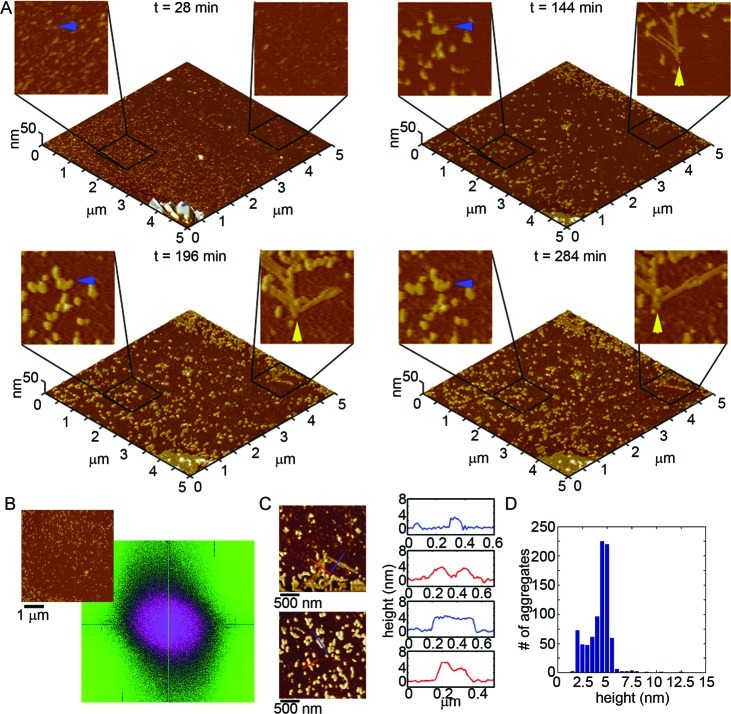
Next, we studied the aggregation of Italian Aβ(1–40) on mica using in situ AFM (Figure 8A and Supporting Information Movie S3). Initially, small oligomers (1–2 nm in height) of Italian Aβ were the predominate aggregate form to appear on the mica surface for approximately the first 50 min. While some smaller oligomers were observed in Wild Type aggregation on mica, these small oligomers were much more abundant for Italian Aβ at early time points in comparison. With time, these smaller oligomers coalesced into larger oligomers and highly curved fibrillar structures reminiscent of protofibrils (blue arrow in Figure 8A and purple and blue boxes in Movie S3), similar to the curved structures observed during in situ AFM experiments with Wild Type. These Italian Aβ aggregates continued to move together, creating larger aggregates. At ∼ 100 min, some more rigid (straight morphology) elongated aggregates appeared on the surface (yellow arrows in Figure 8A and yellow box in Movie S3) which had similar morphology in comparison to those formed by Arctic Aβ on mica. Specifically, these aggregates appeared to be growing in specific directions influenced by the underlying substrate. However, these extended aggregates were never the dominate aggregate form for Italian Aβ, and the vast majority of Italian Aβ aggregates did not exhibit any long-range ordering on mica based on 2D Fourier analysis of larger areas of the in situ AFM images (Figure 8B). The majority of the Italian aggregates after ∼150 min of aggregation were predominately 4.5–5.0 nm tall with a very narrow distribution compared to Wild Type (Figure 8C,D); however, there were some smaller aggregates still present within the size range of 2–3 nm. These smaller aggregates include the “Arctic-like” extended aggregates of Italian Aβ as demonstrated by height profiles (Figure 8C top), demonstrating that these structures are morphologically indistinguishable to their Arctic counterparts.
Figure 8.
Italian Aβ(1–40) forms a variety of aggregate morphologies on mica. (A) Freshly prepared Italian Aβ was imaged continuously in solution on mica at a concentration of 20 μM. 5 × 5 μm2 images are presented as 3D reconstructions with indicated zoomed in 1 × 1 μm2 areas presented in 2D. The blue arrows indicate regions where small oligomers of Italian Aβ came together to form highly curved, elongated aggregates. The yellow arrows indicate the formation of a small number of fibrillar aggregates had with a distinct morphology. (B) 2D Fourier analysis performed on a representative image (shown to the upper left) demonstrated that the majority of Italian Aβ aggregates did not display long-range order along the mica surface. (C) Height profiles of Italian Aβ aggregates on mica (corresponding to the lines indicated in the adjacent images) for the different aggregate types are shown to be ∼2.5 and ∼5 nm in height, respectively. (D) Height histograms of all aggregates after 275 min of aggregation show that, although there is a small population of ∼2.5 nm tall aggregates, the majority of Italian aggregates are ∼5 nm in height.
The Italian mutation replaces a polar, negatively charged glutamic acid residue with a polar, positively charged lysine, with a corresponding small increase in hydrophilic character (hydropathy index changes from −3.5 to −3.9). The positive charge associated with the Italian mutation resulted in a significantly increased rate of absorption onto the mica surface compared to Wild Type (Supporting Information Figure 3). While the negative charge is removed from position 22 for both Arctic and Italian mutations in Aβ, Italian Aβ had a much lower propensity to form the epitaxial oriented fibril-like structure, but it was observed. The removal of the negative charge at position 22 appears to promote the formation of laterally ordered, elongated aggregates on mica, as this morphology was only observed for the Arctic and Italian mutations that replace this residue. As this structure is not the dominant aggregation product on mica for the Italian mutation, the additional positive charge, and resultant increased absorption on mica, makes the formation of this morphology less efficient. As the laterally ordered aggregates did not form from Italian Aβ until after approximately 100 min (Movie S3, yellow box) compared to within 30 min for Arctic Aβ, another potential explanation for this observation is that the conformational freedom associated with the glycine of the Arctic mutation lowers the barrier for Aβ to rearrange into this, presumably, ordered structure that contains a turn within the peptide. The bulk of the lysine residue would make such a structure less favorable compared with glycine.
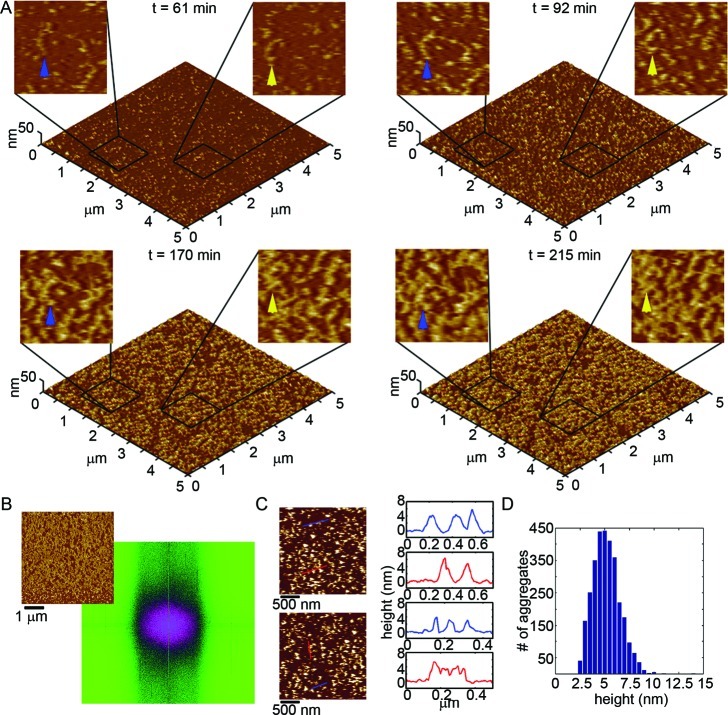
Another unique morphology was formed from the aggregation of Iowa Aβ(1–40) on mica, as observed by in situ AFM (Figure 9A and Supporting Information Movie S4). For the first 30–40 min, small oligomers (2–3 nm tall) of Iowa Aβ were the predominate aggregate form to appear on the mica surface, but these oligomers quickly coalesced into larger structures (Movie S4). After this initial period, the oligomers gave way to elongated protofibrillar-like aggregates with highly curved morphologies (Figure 9A, blue and yellow arrows). Within 130–160 min, these elongated aggregates covered the surface and became highly interconnected, forming a large network of aggregated Iowa Aβ. Despite this large network of aggregation, the elongated aggregates of Iowa Aβ did not appear to have any long-range order in the lateral dimension on mica (Figure 9B). This extended, meandering network was not observed for Wild Type or any other mutant form of Aβ. Accumulations of amorphous protein clumps around these extended protofibrillar-like aggregates of Iowa Aβ did not appear, further distinguishing Iowa aggregation from Wild Type. These Iowa Aβ aggregates (both oligomeric and elongated) formed at later time points and had heights that were slightly larger on average (∼4–6 nm) compared to Wild Type (Figure 9C,D).
Figure 9.
Iowa Aβ(1–40) forms a dense network of elongated aggregates on mica. (A) Freshly prepared Iowa Aβ was imaged continuously in solution on mica at a concentration of 20 μM. 5 × 5 μm2 images are presented as 3D reconstructions with indicated zoomed in 1 × 1 μm2 areas presented in 2D. Blue and yellow arrows indicate regions where small oligomers of Iowa Aβ came together to form highly curved, elongated aggregates, eventually forming a dense mesh of interconnected aggregates. (B) Despite the formation of this highly interconnected mesh of aggregates, the growth of Iowa Aβ fibrillar aggregates did not appear to have any long-range order along the mica surface based on 2D Fourier analysis. (C) Height profiles of Iowa Aβ aggregates on mica (corresponding to the lines indicated in the adjacent images) and (D) height histograms of all aggregates after 83 min of aggregation.
The Iowa mutation replaces a polar, negatively charged aspartic acid with a polar, neutral asparagine, but there is no change in the hydropathy index. The absorption of Iowa Aβ on the mica surface occurred at a faster rate than that of Wild Type (Supporting Information Figure 3). The absorption of Italian Aβ to mica was initially similar to that of Italian Aβ, and after ∼100 min more Iowa absorbed to the surface despite not having the extra positive charge associated with Italian. Removal of a negative charge must also be accompanied without an increase in hydrophobicity to result in an increased rate of peptide absorption compared to Wild Type. While the Iowa and Italian mutations did not change or slightly decreased the hydrophobic character of Aβ, the removal of the negative charge in the Arctic mutation was accompanied by an increased hydrophobic character, resulting in no increase in the rate of absorption to mica. The absence of this negative charge at position 23 of Aβ did not lead to the laterally ordered aggregation associated with removal of a negative charge at position 22. This may be due to the importance of residue 22 in forming these elongated aggregates or remaining conformational barriers associated with the large asparagines side group. However, the Iowa mutation did promote increased aggregation on the negatively charged mica surface, resulting in a unique morphology compared to Wild Type.
Finally, we studied the aggregation of Flemish Aβ(1–40) on mica using in situ AFM (Figure 10A and Supporting Information Movie S5). Due to the slow aggregation of Flemish Aβ on mica at 20 μM, experiments presented here were performed at a higher concentration (40 μM) so that observation on aggregate morphology could be observed in an experimentally accessible time frame. At this elevated concentration, two types of oligomers (smaller oligomers ∼2–4 nm in height and larger oligomers ∼5–7.5 nm in height) of Flemish Aβ appeared on the mica surface throughout the experiment (Figure 10A,C,D). The larger oligomers, however, were the dominant form observed for the entirety of the experiment (353 min). These taller oligomers of Flemish Aβ were the largest oligomers observed in situ for any of the varieties of Aβ. Both the smaller and larger oligomers moved together and coalesced into larger aggregates, most often forming larger, globular oligomers (Figure 10A, yellow arrow and Movie S5, blue box). Some of these interacting oligomers formed putative protofibrils similar in morphology to those observed for Wild Type and Italian Aβ (Figure 10A, yellow arrow and Movie S5, yellow box); however, these often remained quite short in comparison. Overall, the Flemish Aβ aggregates did not exhibit any long-range ordering on mica based on 2D Fourier analysis of larger areas of the in situ AFM images (Figure 10B).
Figure 10.
Flemish Aβ(1–40) predominately forms a variety of oligomeric aggregates on mica. (A) Freshly prepared Flemish Aβ was imaged continuously in solution on mica at a concentration of 40 μM. The increased concentration was used because the Flemish aggregation was much slower compared to Wild Type and the other mutants. 5 × 5 μm2 images are presented as 3D reconstructions with indicated zoomed in 1 × 1 μm2 areas presented in 2D. Yellow arrows indicate two oligomers coalescing into a slightly larger oligomer. The blue arrows indicate short, slightly elongated aggregates that were stable. (B) 2D Fourier analysis performed on a representative image (shown to the upper left) demonstrated that Flemish aggregates did not display long-range order along the mica surface. (C) Height profiles of Flemish Aβ aggregates on mica (corresponding to the lines indicated in the adjacent images) and (D) height histograms of all aggregates after 362 min of aggregation, demonstrating that Flemish Aβ formed a variety of oligomers of different heights.
The Flemish mutation replaces a nonpolar, neutral alanine residue with a nonpolar, neutral glycine at position 21, leading to a large decrease in hydrophobic character (a change of 1.8 to −0.04 in the hydropathy index). Despite a doubling of the concentration (40 μM compared to 20 μM), the absorption of Flemish Aβ to mica initially increased quickly but stabilized to a percent of surface area coverage similar to that of Wild Type (Supporting Information Figure 3). Despite potentially gaining some conformational freedom associated with the glycine compared to alanine, Flemish Aβ did not form extensive, elongated aggregates. As the Flemish mutation does not change the local charge of Aβ, the lack of these extended morphologies on mica further implicate the importance of removing the negative charge of the adjacent amino acid at position 22.
In recent years, the focus of many studies of Aβ aggregates associated with AD has predominately been on nonfibrillar intermediates;28,34−39 however, the relative importance for disease of different aggregate forms of Aβ has not been fully elucidated. A complicating factor for understanding the role of different aggregate forms is the ability of Aβ to form a large array of polymorphic fibril structures.3,5−7,40 For example, it has been shown with investigating just eight different preparatory conditions that five distinct fibrillar polymorphs of Aβ can result.6 The existence of different polymorphic fibril structures may also indicate that there are a variety of soluble intermediate structures. Indeed, several distinct oligomeric forms of Aβ have been reported.34,41 The ability of Aβ to form a variety of polymorphic aggregate structures may underlie the variations observed in AD pathology. While the chemical environment of Aβ appears to have a profound effect on Aβ aggregation,6,31 the interaction of proteins with solid surfaces is a fundamental phenomenon with potential implications for protein misfolding associated with neurodegenerative diseases. Kinetic and thermodynamic studies indicate that significant conformational changes can be induced in proteins encountering surfaces.42 Such surface induced conformational changes can play a critical role in nucleating or inducing Aβ aggregate formation. Here, we have shown that single point mutations influence the interaction of Aβ at a negatively charged surface, resulting in the formation of several polymorphic aggregate forms. The aggregate morphologies of the mutant forms of Aβ can be drastically different from those formed in the absence of a surface (free solution conditions). Recent studies have also reported that the same mutations in Aβ studied here can form a variety of polymorphic aggregates on model lipid membranes.43 Such results indicate that surfaces influence Aβ self-assembly, and these surface effects in a physiological environment may dictate whether specific aggregates with potential roles in disease pathology form and/or are stable.
Interestingly, the mutations studied here are located at the end of or directly adjacent to a sequence in Aβ (residues 16–21) that has been identified to have amyloidogenic properties.44 Furthermore, it has been reported that toxic forms of Aβ contain a turn at positions 22 and 23,45,46 precisely where the mutations (Arctic, Italian, and Iowa) that increased aggregation occur. Several other studies using antibodies specific for this central region of Aβ demonstrate that this domain represents an appropriate target for preventing Aβ aggregation,47−49 which is compatible with the notion that this sequence plays an important role in the formation of Aβ fibrils. More recently, an antibody has been reported that is specific for the turn at position 22 and 23 associated with toxic forms of Aβ aggregates.45 Studies presented here demonstrate that mutations in this region not only change the rates of formation of Aβ aggregates in free solution but also the morphology of aggregates formed at anionic surfaces.
Previous reports using in situ AFM to study the aggregation of Wild Type forms of Aβ indicated that chemically diverse surfaces significantly influence aggregate morphology. Small, highly mobile, globular aggregates of both Aβ(1–40)9 and Aβ(1–42)10 were observed on mica. The results of both studies are similar to those reported here for Wild Type Aβ on mica. However, aggregation of Aβ(1–42) on graphite resulted in markedly different aggregated morphology from those observed on mica.10 In that study, Aβ(1–42) formed extended nanoribbons with heights of 1–1.2 nm and widths of ∼18 nm, which suggested that peptide chains adopted fully extended β-sheet conformation and were perpendicular to the long axis of nanoribbons. Comparison of the dimension of aggregates of Aβ forming on graphite with the expected dimensions of a β-sheet provides a strong indication that the elongated aggregates indeed correspond to single β-sheets (parallel or antiparallel) with fully extended peptide chains perpendicular to the long axis of the aggregate. These putative β-sheets elongated over time and preferentially organized into parallel “rafts” while maintaining preferential alignment along three equivalent directions, most likely pointing to a templating effect of the graphite lattice. This lateral association of aggregates is similar to that observed here for Arctic Aβ (and to a lesser extent Italian Aβ) on mica. Despite similar lateral aggregation patterns, the aggregates formed by Arctic Aβ on mica had heights approximately twice as tall as those reported for Wild Type aggregates on graphite, indicating that these extended aggregates were structurally unique. Nevertheless, the central domain of Aβ, containing the point mutations studied here, appears to play an important role in Aβ’s interaction with negatively charged surfaces.
Methods
Aβ Sample Preparation
Synthetic Wild Type, Arctic, Iowa, Italian, and Flemish Aβ(1–40) peptides (AnaSpec Inc., San Jose, CA) were used for all studies. The same lot of peptide for each variant of Aβ was used for all experiments. These peptides were prepared exactly the same based on previously reported protocols.31 In short, peptides were treated with hexafluoroisopropanol (HFIP) to dissolve pre-existing aggregates and seeds present in the lyophilized stocks. The solutions of Aβ in HFIP were placed under vacuum in a Vacufuge concentrator (Eppendorf) to remove the HFIP completely, resulting in a small film of Aβ. The attained Aβ films were resuspended in 10.00 μL of dimethyl sulfoxide (DMSO) and thoroughly vortexed to make a 2000 μM stock solution. These stock solutions were then dissolved directly into 37 °C phosphate-buffered saline (PBS) (pH 7.3) to a final peptide concentration of 20–40 μM depending on the required experimental conditions. The concentration of Aβ solutions were verified with Bradford assays.
Ex Situ AFM Imaging Conditions (Free Solution)
For experiments aimed at elucidating the aggregation of Aβ peptides under free solution conditions, 20 μM solutions of each peptide were prepared and incubated at 37 °C and 1400 rpm for the duration of the experiment. At 1, 3, 5, 8, and 24 h after the final dilution of the peptide into buffer, 5 μL aliquots of each incubation were spotted on freshly cleaved mica, washed with 200 μL of HPLC grade water, and dried under a gentle stream of nitrogen. Three separate incubations were performed for each type of Aβ, and each of these was sampled twice at each time point. Aβ aggregates deposited on mica were imaged ex situ using a Nanoscope V MultiMode scanning probe microscope (Veeco, Santa Barbara, CA) equipped with a closed-loop vertical engage J-scanner and operated in the tapping mode. Images were taken with a diving board shaped silicon cantilever with a nominal spring constant of 40 N/m. Scan rates were set at 2–3 Hz with cantilever drive frequencies of approximately 300 kHz.
In Situ AFM Imaging Conditions (On a Mica Surface)
For in situ AFM experiments tracking aggregation of Wild Type and mutant Aβ(1–40) on a mica surface, the Nanoscope V MultiMode scanning probe microscope (Veeco, Santa Barbara, CA) was furnished with a fluid cell sealed with an O-ring and operated in the tapping mode. Images were obtained with a V-shaped oxide-sharpened silicon nitride cantilever with a nominal spring constant of 0.5 N/m (Budget Sensors, Bulgaria). Typical scan size was 10 × 10 μm2 with resolution 1024 × 1024 pixels. Scan rates were set between 1 and 2 Hz with cantilever drive frequencies ranging from ∼8 to 10 kHz. A total of 25 μL of filtered PBS buffer was added to the cell, and background images were obtained to ensure cleanliness of the cell before the addition of Aβ. Next, a 25 μL aliquot of freshly prepared 40 μM Aβ(1–40) peptide solution in PBS was injected via channels on the fluid cell, resulting in a final peptide concentration of 20 μM. After injection of the peptide, the surface was continuously imaged in order to track the aggregation of Aβ on the mica surface. Intermittently, the scan area was offset to a completely different area of the surface to compare aggregate morphologies of previously unimaged portions of the mica to the aggregates forming under continual imaging. As a result, we were able to compare the morphology and relative abundance of aggregates that formed without the continuous presence of the AFM probe. This was done to ensure that the imaging process itself was not significantly altering the aggregation process on the surface.
Quantitative Image Analysis
AFM image analysis was performed using Matlab equipped with the image processing toolbox (MathWorks, Natick, MA). Physical dimensions of most aggregates were measured automatically in this way: (1) Images were imported into Matlab. (2) Images were flattened to correct for curvature due to the imaging process. (3) Flattened images were converted into binary maps of aggregate locations by using a height threshold (set at ∼1 nm). This was accomplished by assigning values of 1 to any pixel of the image that represented a height above the threshold and assigning a value of 0 to any pixel corresponding to a height below the threshold. (4) The binary map was used to locate aggregates within the original AFM image using pattern recognition algorithms. (5) Once a discrete aggregate was located, dimensions were automatically measured. Each aggregate was also assigned an individual number so that aggregates chosen based on specific measured properties could be located, allowing for verification that chosen dimensions corresponded to specific aggregate types. In this way, large data sets were automatically constructed that could be used to keep track of thousands of individual aggregates and sorted based on specific dimensional characteristics. Two dimensional fast Fourier transform (FFT 2D) analysis was performed on in situ AFM images using the NanoScope v7.30 AFM processing software (Veeco, Santa Barbara, CA).
Glossary
Abbreviations
- Aβ
amyloid-β peptide
- AFM
atomic force microscopy
- AD
Alzheimer’s disease
- APP
β-amyloid precursor protein
- WT
Wild Type
- PBS
phosphate-buffered saline
Supporting Information Available
Additional figures and movies that track aggregation occurring at the mica surface. This material is available free of charge via the Internet at http://pubs.acs.org.
Author Contributions
Experiment design, peptide preparation, and AFM characterizations were accomplished by E.A.Y. and J.L. Data analysis, writing, and editing were completed by E.A.Y., E.M.C., and J.L.
This work was supported by West Virginia University (start-up package, J.L.). E.M.C. was supported by the Center for Neuroscience Summer Undergraduate Research Internship (SURI) program (Robert C. Byrd Health Sciences Center, West Virginia University).
Supplementary Material
References
- Sunde M.; Blake C. C. F. (1998) From the globular to the fibrous state: protein structure and structural conversion in amyloid formation. Q. Rev. Biophys. 31, 1–39. [DOI] [PubMed] [Google Scholar]
- Necula M.; Kayed R.; Milton S.; Glabe C. G. (2007) Small molecule inhibitors of aggregation indicate that amyloid beta oligomerization and fibrillization pathways are independent and distinct. J. Biol. Chem. 282, 10311–10324. [DOI] [PubMed] [Google Scholar]
- Kodali R.; Wetzel R. (2007) Polymorphism in the intermediates and products of amyloid assembly. Curr. Opin. Struct. Biol. 17, 48–57. [DOI] [PubMed] [Google Scholar]
- Goldsbury C.; Wirtz S.; Muller S.; Sunderji S.; Wicki P.; Aebi U.; Frey P. (2000) Studies on the in vitro assembly of Aβ 1–40: implications for the search for a beta fibril formation inhibitors. J. Struct. Biol. 130, 217–231. [DOI] [PubMed] [Google Scholar]
- Meinhardt J.; Sachse C.; Hortschansky P.; Grigorieff N.; Fandrich M. (2009) Aβ(1–40) fibril polymorphism implies diverse interaction patterns in amyloid fibrils. J. Mol. Biol. 386, 869–877. [DOI] [PMC free article] [PubMed] [Google Scholar]
- Kodali R.; Williams A. D.; Chemuru S.; Wetzel R. (2010) Aβ(1–40) Forms Five Distinct Amyloid Structures whose β-Sheet Contents and Fibril Stabilities Are Correlated. J. Mol. Biol. 401, 503–517. [DOI] [PMC free article] [PubMed] [Google Scholar]
- Petkova A. T.; Leapman R. D.; Guo Z.; Yau W.-M.; Mattson M. P.; Tycko R. (2005) Self-Propagating, Molecular-Level Polymorphism in Alzheimer’s β-Amyloid Fibrils. Science 307, 262–265. [DOI] [PubMed] [Google Scholar]
- Paravastu A. K.; Qahwash I.; Leapman R. D.; Meredith S. C.; Tycko R. (2009) Seeded growth of β-amyloid fibrils from Alzheimer’s brain-derived fibrils produces a distinct fibril structure. Proc. Natl. Acad. Sci. U.S.A. 106, 7443–7448. [DOI] [PMC free article] [PubMed] [Google Scholar]
- Blackley H. K. L.; Sanders G. H. W.; Davies M. C.; Roberts C. J.; Tendler S. J. B.; Wilkinson M. J. (2000) In-Situ Atomic Force Microscopy Study of β-Amyloid Fibrillization. J. Mol. Biol. 298, 833–840. [DOI] [PubMed] [Google Scholar]
- Kowalewski T.; Holtzman D. M. (1999) In situ atomic force microscopy study of Alzheimer’s β-amyloid peptide on different substrates: new insights into mechanism of β-sheet formation. Proc. Natl. Acad. Sci. U.S.A. 96, 3688–3693. [DOI] [PMC free article] [PubMed] [Google Scholar]
- Murakami K.; Irie K.; Morimoto A.; Ohigashi H.; Shindo M.; Nagao M.; Shimizu T.; Shirasawa T. (2002) Synthesis, aggregation, neurotoxicity, and secondary structure of various Aβ 1–42 mutants of familial Alzheimer’s disease at positions 21–23. Biochem. Biophys. Res. Commun. 294, 5–10. [DOI] [PubMed] [Google Scholar]
- De Jonghe C.; Zehr C.; Yager D.; Prada C. M.; Younkin S.; Hendriks. L.; Van Broeckhoven C.; Eckman C. B. (1998) Flemish and Dutch mutations in amyloid b precursor protein have different effects on amyloid β secretion. Neurobiol. Dis. 5, 281–286. [DOI] [PubMed] [Google Scholar]
- Miravalle L.; Tokuda T.; Chiarle R.; Giaccone G.; Bugiani O.; Tagliavini F.; Frangione B.; Ghiso J. (2000) Substitutions at codon 22 of Alzheimer’s Aβ peptide induce diverse conformational changes and apoptotic effects in human cerebral endothelial cells. J. Biol. Chem. 275, 27110–27116. [DOI] [PubMed] [Google Scholar]
- Nilsberth C.; Westlind-Danielsson A.; Eckman C. B.; Condron M. M.; Axelman K.; Forsell C.; Stenh C.; Luthman J.; Teplow D. B.; Younkin S. G.; Naslund J.; Lannfelt L. (2001) The “Arctic” APP mutation (E693G) causes Alzheimer’s disease by enhanced Aβ protofibril formation. Nat. Neurosci. 4, 887–893. [DOI] [PubMed] [Google Scholar]
- Sian A. K.; Frears E. R.; El-Agnaf O. M.; Patel B. P.; Manca M. F.; Siligardi G.; Hussain R.; Austen B. M. (2000) Oligomerization of β-amyloid of the Alzheimer’s and the Dutch-cerebral-haemorrhage types. Biochem. J. 349, 299–308. [DOI] [PMC free article] [PubMed] [Google Scholar]
- Van Nostrand W. E.; Melchor J. P.; Cho H. S.; Greenberg S. M.; Rebeck G. W. (2001) Pathogenic effects of D23N Iowa mutant amyloid β-protein. J. Biol. Chem. 376, 32680–33266. [DOI] [PubMed] [Google Scholar]
- Watson D. J.; Selkoe D. J.; Teplow D. B. (1999) Effects of the amyloid precursor protein Glu693Gln “Dutch” mutation on the production and stability of amyloid β-protein. Biochem. J. 340, 703–709. [PMC free article] [PubMed] [Google Scholar]
- Clements A.; Walsh D. M.; Williams C. H.; Allsop D. (1993) Effects of the mutations Glu22 to Gln and Ala21 to Gly on the aggregation of a synthetic fragment of the Alzheimer’s amyloid β/A4 peptide. Neurosci. Lett. 161, 17–20. [DOI] [PubMed] [Google Scholar]
- Clements A.; Allsop D.; Walsh D. M.; Williams C. H. (1996) Aggregation and metal-binding properties of mutant forms of the amyloid Aβ peptide of Alzheimer’s disease. J. Neurochem. 66, 740–747. [DOI] [PubMed] [Google Scholar]
- Walsh D. M.; Lomakin A.; Benedek G. B.; Condron M. M.; Teplow D. B. (1997) Amyloid β-protein fibrillogenesis. Detection of a protofibrillar intermediate. J. Biol. Chem. 272, 22364–22372. [DOI] [PubMed] [Google Scholar]
- Walsh D. M.; Hartley D. M.; Condron M. M.; Selkoe D. J.; Teplow D. B. (2001) In vitro studies of amyloid β-protein fibril assembly and toxicity provide clues to the aetiology of Flemish variant (Ala692Gly) Alzheimer’s disease. Biochem. J. 355, 869–877. [DOI] [PMC free article] [PubMed] [Google Scholar]
- Dahlgren K. N.; Manelli A. M.; Stine W. B. Jr; Baker L. K.; Krafft G. A.; LaDu M. J. (2002) Oligomeric and fibrillar species of amyloid-β peptides differentially affect neuronal viability. J. Biol. Chem. 277, 32046–32053. [DOI] [PubMed] [Google Scholar]
- Demeester N.; Mertens C.; Caster H.; Goethals M.; Vandekerckhove J.; Rosseneu M.; Labeur C. (2001) Comparison of the aggregation properties, secondary structure and apoptotic effects of wild-type, Flemish and Dutch N-terminally truncated amyloid β peptides. Eur. J. Neurosci. 13, 2015–2024. [DOI] [PubMed] [Google Scholar]
- Murakami K.; Irie K.; Morimoto A.; Ohigashi H.; Shindo M.; Nagao M.; Shimizu T.; Shirasawa T. (2003) Neurotoxicity and physicochemical properties of Aβ mutant peptides from cerebral amyloid angiopathy: Implication for the pathogenesis of cerebral amyloid angiopathy and Alzheimer’s Disease. J. Biol. Chem. 278, 46179–46187. [DOI] [PubMed] [Google Scholar]
- Sennvik K.; Nilsberth C.; Stenh C.; Lannfelt L.; Benedikz E. (2002) The Arctic Alzheimer mutation enhances sensitivity to toxic stress in human neuroblastoma cells. Neurosci. Lett. 326, 51–55. [DOI] [PubMed] [Google Scholar]
- Verbeek M. M.; Eikelenboom P.; de Waal R. M. (1997) Differences between the pathogenesis of senile plaques and congophilic angiopathy in Alzheimer disease. J. Neuropathol. Exp. Neurol. 56, 751–761. [PubMed] [Google Scholar]
- Meinhardt J.; Tartaglia G. G.; Pawar A.; Christopeit T.; Hortschansky P.; Schroeckh V.; Dobson C. M.; Vendruscolo M.; Fandrich M. (2007) Similarities in the thermodynamics and kinetics of aggregation of disease-related Aβ(1–40) peptides. Protein Sci. 16, 1214–1222. [DOI] [PMC free article] [PubMed] [Google Scholar]
- Cheng I. H.; Scearce-Levie K.; Legleiter J.; Palop J. J.; Gerstein H.; Bien-Ly N.; Puolivali J.; Lesne S.; Ashe K. H.; Muchowski P. J.; Mucke L. (2007) Accelerating amyloid-β fibrillization reduces oligomer levels and functional deficits in Alzheimer disease mouse models. J. Biol. Chem. 282, 23818–23828. [DOI] [PubMed] [Google Scholar]
- Johansson A.-S.; Berglind-Dehlin F.; Karlsson G.; Edwards K.; Gellerfors P.; Lannfelt L. (2006) Physiochemical characterization of the Alzheimer’s disease-related peptides Aβ1–42Arctic and Aβ1–42wt. FEBS J. 273, 2618–2630. [DOI] [PubMed] [Google Scholar]
- Lashuel H. A.; Hartley D. M.; Petre B. M.; Wall J. S.; Simon M. N.; Walz T.; Lansbury J.; Peter T. (2003) Mixtures of Wild-type and a Pathogenic (E22G) Form of Aβ40 in Vitro Accumulate Protofibrils, Including Amyloid Pores. J. Mol. Biol. 332, 795–808. [DOI] [PubMed] [Google Scholar]
- Stine W. B. Jr.; Dahlgren K. N.; Krafft G. A.; LaDu M. J. (2003) In vitro characterization of conditions for amyloid-β peptide oligomerization and fibrillogenesis. J. Biol. Chem. 278, 11612–11622. [DOI] [PubMed] [Google Scholar]
- Fernandez-Escamilla A. M.; Rousseau F.; Schymkowitz J.; Serrano L. (2004) Prediction of sequence-dependent and mutational effects on the aggregation of peptides and proteins. Nat. Biotechnol. 22, 1302–1306. [DOI] [PubMed] [Google Scholar]
- Wong P. T.; Schauerte J. A.; Wisser K. C.; Ding H.; Lee E. L.; Steel D. G.; Gafni A. (2009) Amyloid-β Membrane Binding and Permeabilization are Distinct Processes Influenced Separately by Membrane Charge and Fluidity. J. Mol. Biol. 386, 81–96. [DOI] [PubMed] [Google Scholar]
- Lesné S.; MT K.; Kotilinek L.; Kayed R.; Glabe C. G.; Yang A.; Gallagher M.; Ashe K. H. (2006) A specific amyloid-β protein assembly in the brain impairs memory. Nature 440, 352–357. [DOI] [PubMed] [Google Scholar]
- Ashley R. H.; Harroun T. A.; Hauss T.; Breen K. C.; Bradshaw J. P. (2006) Autoinsertion of soluble oligomers of Alzheimer’s Aβ(1–42) peptide into cholesterol-containing membranes is accompanied by relocation of the sterol towards the bilayer surface. BMC Struct. Biol. 6, 21. [DOI] [PMC free article] [PubMed] [Google Scholar]
- Bitan G.; Kirkitadze M. D.; Lomakin A.; Vollers S. S.; Benedek G. B.; Teplow D. B. (2003) Amyloid β-protein (Aβ) assembly: Aβ40 and Aβ42 oligomerize through distinct pathways. Proc. Natl. Acad. Sci. U.S.A. 100, 330–335. [DOI] [PMC free article] [PubMed] [Google Scholar]
- Bitan G.; Lomakin A.; Teplow D. B. (2001) Amyloid β-protein oligomerization: prenucleation interactions revealed by photo-induced cross-linking of unmodified proteins. J. Biol. Chem. 276, 35176–35184. [DOI] [PubMed] [Google Scholar]
- Cleary J. P.; Walsh D. M.; Hofmeister J. J.; Shankar G. M.; Kuskowski M. A.; Selkoe D. J.; Ashe K. H. (2005) Natural oligomers of the amyloid-β protein specifically disrupt cognitive function. Nat. Neurosci. 8, 79–84. [DOI] [PubMed] [Google Scholar]
- Haass C.; Selkoe D. J. (2007) Soluble protein oligomers in neurodegeneration: lessons from the Alzheimer’s amyloid beta-peptide. Nat. Rev. Mol. Cell Biol. 8, 101–112. [DOI] [PubMed] [Google Scholar]
- Paravastu A. K.; Leapman R. D.; Yau W.-M.; Tycko R. (2008) Molecular structural basis for polymorphism in Alzheimer’s β-amyloid fibrils. Proc. Natl. Acad. Sci. U.S.A. 105, 18349–18354. [DOI] [PMC free article] [PubMed] [Google Scholar]
- Lambert M. P.; Barlow A. K.; Chromy B. A.; Edwards C.; Freed R.; Liosatos M.; Morgan T. E.; Rozovsky I.; Trommer B.; Viola K. L.; Wals P.; Zhang C.; Finch C. E.; Krafft G. A.; Klein W. L. (1998) Diffusible, nonfibrillar ligands derived from Aβ1–42 are potent central nervous system neurotoxins. Proc. Natl. Acad. Sci. U.S.A. 95, 6448–6453. [DOI] [PMC free article] [PubMed] [Google Scholar]
- Gray J. J. (2004) The interaction of proteins with solid surfaces. Curr. Opin. Struct. Biol. 14, 110–115. [DOI] [PubMed] [Google Scholar]
- Pifer P. J.; Yates E. A. (2011) Point mutations in Aβ result in the formation of distinct polymorphic aggregates in the presence of lipid bilayers. PLoS One 6, e16248. [DOI] [PMC free article] [PubMed] [Google Scholar]
- Pastor M. T.; Kummerer N.; Schubert V.; Esteras-Chopo A.; Dotti C. G.; Lopez de la Paz M.; Serrano L. (2008) Amyloid Toxicity Is Independent of Polypeptide Sequence, Length and Chirality. J. Mol. Biol. 375, 695–707. [DOI] [PubMed] [Google Scholar]
- Murakami K.; Horikoshi-Sakuraba Y.; Murata N.; Noda Y.; Masuda Y.; Kinoshita N.; Hatsuta H.; Murayama S.; Shirasawa T.; Shimizu T.; Irie K. (2010) Monoclonal Antibody Against the Turn of the 42-Residue Amyloid β-Protein at Positions 22 and 23. ACS Chem. Neuroci. 1(11), 747–756. [DOI] [PMC free article] [PubMed] [Google Scholar]
- Murakami K.; Masuda Y.; Shirasawa T.; Shimizu T.; Irie K. (2010) The turn formation at positions 22 and 23 in the 42-mer amyloid β peptide: The emerging role in the pathogenesis of Alzheimer’s disease. Geriatr. Gerontol. Int. 10, S169–S179. [DOI] [PubMed] [Google Scholar]
- Legleiter J.; Czilli D.; Demattos R.; Gitter B.; Holtzman D.; Kowalewski T. (2004) Effect of different anti-Aβ antibodies on Aβ fibrillogenesis as assessed by atomic force microscopy. J. Mol. Biol. 335, 997–1006. [DOI] [PubMed] [Google Scholar]
- Zameer A.; Schulz P.; Wang M. S.; Sierks M. R. (2006) Single chain Fv antibodies against the 25–35 Aβ fragment inhibit aggregation and toxicity of Aβ42. Biochemistry 45, 11532–11539. [DOI] [PubMed] [Google Scholar]
- Liu R.; Yuan B.; Emadi S.; Zameer A.; Schulz P.; McAllister C.; Lyubchenko Y.; Goud G.; Sierks M. R. (2004) Single chain variable fragments against β-Amyloid Aβ can inhibit Aβ Aggregation and Prevent Aβ-Induced Neurotoxicity. Biochemistry 43, 6959–6967. [DOI] [PubMed] [Google Scholar]
Associated Data
This section collects any data citations, data availability statements, or supplementary materials included in this article.


