Abstract
Recent increased usage of stereo displays has been accompanied by public concern about potential adverse effects associated with prolonged viewing of stereo imagery. There are numerous potential sources of adverse effects, but we focused on how vergence–accommodation conflicts in stereo displays affect visual discomfort and fatigue. In one experiment, we examined the effect of viewing distance on discomfort and fatigue. We found that conflicts of a given dioptric value were slightly less comfortable at far than at near distance. In a second experiment, we examined the effect of the sign of the vergence–accommodation conflict on discomfort and fatigue. We found that negative conflicts (stereo content behind the screen) are less comfortable at far distances and that positive conflicts (content in front of screen) are less comfortable at near distances. In a third experiment, we measured phoria and the zone of clear single binocular vision, which are clinical measurements commonly associated with correcting refractive error. Those measurements predicted susceptibility to discomfort in the first two experiments. We discuss the relevance of these findings for a wide variety of situations including the viewing of mobile devices, desktop displays, television, and cinema.
Keywords: stereopsis, depth perception, vergence, accommodation, discomfort, fatigue, displays, asthenopia
Introduction
There is currently an explosion of interest in technology for presenting stereo 3D (S3D) imagery in entertainment (e.g., cinema, television, video games; Halbfinger, 2008), communication (mobile devices, scientific visualization; Fröhlich, Barrass, Zehner, Plate, & Gobel, 1999; Ware & Franck, 1996), and medicine (diagnosis, surgical planning and control, medical instruction; Blavier, Gaudissart, Cadiere, & Nyssen, 2006; Chan, Chung, Yu, & Wells, 2004; Edwards et al., 2004; Getty, D’Orsi, & Pickett, 2008). The explosion has been accompanied by public concern about potential adverse effects associated with prolonged viewing of stereo imagery. A recent survey of cinema viewers in Russia found that 30% reported eye tiredness after watching an S3D film (Berezin, 2010). Some of the public concern has been rather extreme. For example, a prominent display manufacturer issued a warning a year ago that some viewers of S3D television could experience altered vision, lightheadedness, confusion, nausea, and even convulsions. The warning went on to recommend against watching S3D television if the viewer is in bad physical condition, needs sleep, is pregnant, or has been drinking alcohol. Clearly, a signifi-cant hurdle for the emerging technology is to determine what the potential adverse effects are and how to reduce or eliminate them.
There are numerous potential causes of visual discomfort when viewing stereo displays. These include discomfort due to the eyewear required to separate the two eyes’ images, ghosting or crosstalk between the two images, misalignment of the images, inappropriate head orientation, vergence–accommodation conflict, visibility of flicker or motion artifacts, and visual–vestibular conflicts (Kooi & Toet, 2004). Here, we focus on the vergence–accommodation conflict and we do so for two reasons. First, it is present in all conventional stereo displays, while the other factors are not present in some types of displays. Second, the visual discomfort and fatigue associated with S3D viewing has often been attributed to vergence–accommodation conflicts (Emoto, Niida, & Okano, 2005; Häkkinen, Pölönen, Takatalo, & Nyman, 2006; Hoffman, Girshick, Akeley, & Banks, 2008; Howarth, 2011; Lambooij, IJsselsteijn, Fortuin, & Heynderickx, 2009; Ukai & Howarth, 2008; Wann & Mon-Williams, 2002; Yano, Emoto, & Mitsuhashi, 2004; Yano, Ide, Mitsuhashi, & Thwaites, 2002). Unfortunately, the great majority of those publications did not present persuasive evidence that the reported symptoms were caused specifically by vergence–accommodation conflicts, so one purpose of the current paper is to investigate whether such conflicts do indeed cause discomfort.
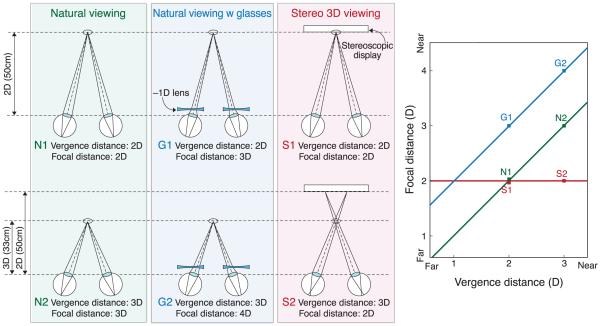
Figure 1 schematizes three viewing situations in which vergence–accommodation conflicts may or may not arise: natural viewing, natural viewing with optical correction by spectacles or contact lenses, and stereo display viewing. To understand the viewing situations, we need to make a distinction between the stimuli that drive vergence and accommodation and the vergence and accommodation responses themselves. The figure illustrates the stimuli, not the responses. In our usage, vergence distance is the distance to which the eyes must converge for both to foveate the same point in space, and focal distance is the distance to which the eyes must accommodate to bring the image of that point in space to sharp focus. For convenience, we express vergence and focal distances in diopters (1/d, where d is distance in meters). This is somewhat unconventional in optometry and ophthalmology, where vergence distance is commonly expressed in meter angles or prism diopters (Howard & Rogers, 2002). Meter angles and diopters are mathematically equivalent; prism diopters and diopters are not (see Discussion section).
Figure 1.
Vergence and focal distance in various viewing situations. The three columns on the left represent natural viewing (N), natural viewing with optical correction (G), and stereo 3D viewing (S). In natural viewing, the vergence stimulus and focal stimulus are always at the same distance and, therefore, are consistent with one another. In natural viewing with an optical correction for refractive error (spectacles or contact lenses), the focal distance is different from the vergence distance because of the constant decrement or increment in focal power due to the correction. Stereo viewing creates inconsistencies between vergence and focal distances because the vergence distance varies depending on the image contents while the focal distance remains constant. The right side of the figure plots focal distance in diopters as a function of vergence distance in diopters for the six viewing conditions schematized on the left side. The green line represents natural viewing, the blue line represents natural viewing with an optical correction, and the red line represents viewing a stereo display. Near and far distances are indicated on the axes.
The first column in Figure 1 illustrates natural viewing of objects that are 2.0 and 3.0 D from the eyes (N1 and N2, respectively). In natural viewing, vergence and focal distance are equal to one another, so they lie on the green line of slope 1 in the plot on the right. In the optometric/ophthalmic literature, this line is called the demand line or Donders’ line (Donders, 1864). Because vergence and focal distance are the same in natural viewing, it is not surprising that the responses are neurally coupled. Specifically, accommodative changes evoke changes in vergence (accommodative vergence), and vergence changes evoke changes in accommodation (vergence accommodation; Fincham & Walton, 1957; Martens & Ogle, 1959). A benefit of the coupling is increased response speed. For example, accommodation is faster with binocular viewing where blur and disparity specify the same change in distance than with monocular viewing where only blur specifies the change (Cumming & Judge, 1986; Krishnan, Shirachi, & Stark, 1977). Likewise, vergence responses are faster when disparity and blur specify the same change in distance than when only disparity specifies the change (Cumming & Judge, 1986; Semmlow & Wetzel, 1979).
The second column in the figure depicts viewing the real world when the observer is given an optical correction (G1 and G2). For an individual accustomed to no correction, the introduction of the new correction (−1 D) increases the focal demand on the crystalline lens within the eye without changing the vergence distance. This creates a constant difference in magnitude between the vergence and focal stimuli. Thus, stimuli like G1 and G2 are shifted vertically from the natural viewing line by the dioptric power of the correction. When the optical correction is appropriate, the constant change in focal demand eventually allows the person to see clearly with minimal effort. However, a new correction (particularly if it is erroneous) often causes visual discomfort at least initially.
The third column in the figure illustrates the viewing of images on stereo displays (S1 and S2). Focal distance is now fixed at the distance from the eyes to the display screen. Vergence distance varies depending on the distance being simulated by the contents of the display; here, the simulated distances are 2.0 and 3.0 D. Thus, vergence–accommodation conflict is created by viewing stereo displays, but the magnitude of the conflict depends on the image contents relative to the viewer’s distance from the display. In the right side of the figure, stimuli like S1 and S2 are now horizontal.
Because of the neural coupling between vergence and accommodation, the conflicts induced by optical correction and by stereo viewing need to be resolved: The viewer must accommodate to a different distance than the distance to which he/she must converge. If he/she does not, blurred or double vision ensues. In attempting to resolve the conflict, symptoms like eyestrain, headache, and visual fatigue can occur (Hoffman et al., 2008; Lambooij et al., 2009; Wann & Mon-Williams, 1997).
Vergence–accommodation conflict has been well studied in optometry and ophthalmology where numerous investigators have monitored patients’ adjustment to optical correction (Scheiman & Wick, 1994). Two important concepts have emerged from this literature: phoria and the zone of clear single binocular vision.
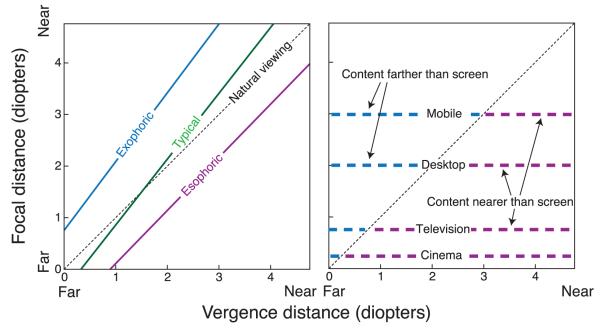
Phoria is the vergence posture of the eyes when stimuli at different distances are viewed monocularly. It can be thought of as the resting vergence state for a given accommodative state. Because it represents a resting state, it may be predictive of what stereo imagery will be most comfortable. With monocular viewing, vergence is driven by the neural coupling between accommodation and vergence (specifically, by accommodative vergence) rather than by binocular disparity. Phoria is usually plotted as in the left panel of Figure 2, where the distance to which the eyes are converged is plotted as a function of the focal distance (in diopters). Note that the abscissa value is a response, while the ordinate value is a stimulus. An individual’s phoria is typically plotted as a line: the so-called phoria line. For comparison, the right panel of Figure 2 plots the focal distances associated with typical viewing of some stereo devices. When the phoria line is to the left of the natural viewing line, the individual has exophoria; their eyes tend to under-converge relative to what is best suited for natural viewing. One might expect that an individual with exophoria would find stereo content farther than the screen more comfortable than content nearer than the screen. When the phoria line is to the right of the natural viewing line, the individual has esophoria; they tend to over-converge. One might expect that an esophoric person would be more comfortable when the stereo content is nearer rather than farther than the screen. Frequently, people are exophoric for near focal distances and esophoric for far ones, leading to a phoria line that crosses the natural viewing line. There are, however, substantial individual differences (Tait, 1951).
Figure 2.
Natural viewing, phoria, and stereo displays. The left panel plots phoria as a function of vergence and focal distance. The abscissa is the vergence response in diopters. The ordinate is the focal stimulus in diopters. The dashed diagonal line represents the vergence and focal distances associated with natural viewing. The purple and blue lines are examples of esophoria and exophoria, respectively. The green line represents the phoria of a typical individual: esophoric at far and exophoric at near. The right panel shows the focal distances for typical stereo devices: mobile devices, desktop displays, television, and cinema. Assuming that the vergence response is accurate, we can plot the focal distances associated with those devices on the same graph. The blue dashed lines indicate stereo content that would be farther than the screen and the purple dashed lines indicate content that would be nearer than the screen.
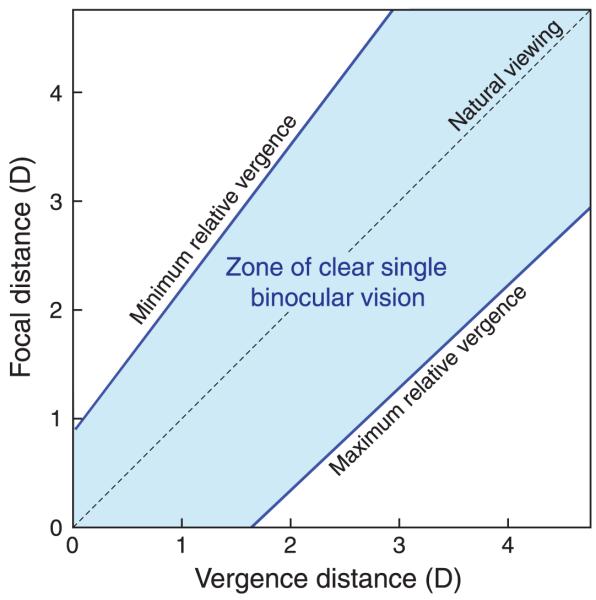
The zone of clear single binocular vision (ZCSBV) is the set of vergence and focal stimuli that the patient can see clearly while maintaining binocular fusion (Fry, 1939). To measure it, the examiner adjusts the vergence stimulus via continuous prisms for different fixed focal stimuli. The examiner finds the maximum convergence and divergence for which the patient sees a single, well-focused target. This is called the relative vergence range for the various focal stimuli. By measuring relative vergence ranges for several focal distances, the examiner maps out the ZCSBV. Figure 3 is a schematic of the zone for a typical young adult. Note that both axes plot stimuli, not responses. Usually, the sides of the ZCSBV are approximately parallel to the phoria line. Like phoria, the ZCSBV varies substantially across individuals (Saladin & Sheedy, 1978).
Figure 3.
The zone of clear single binocular vision (ZCSBV). Focal and vergence distances are plotted in diopters on the ordinate and abscissa, respectively. The dashed diagonal line represents the vergence and focal stimuli associated with natural viewing. The line labeled “Minimum relative vergence” represents the smallest vergence distance for which the viewer can maintain a single, well-focused image of the stimulus target at each focal distance. The line labeled “Maximum relative vergence” represents the largest vergence distance for which the viewer can maintain single, well-focused vision.
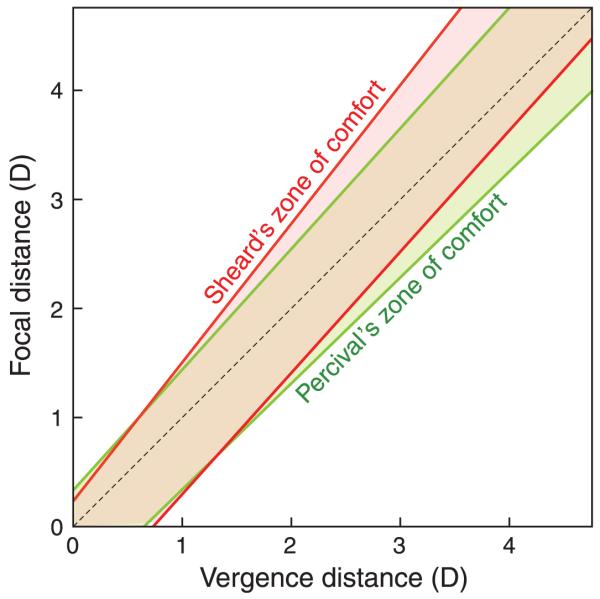
The first published measurements of the ZCSBV were by Donders (1864; see Hofstetter, 1945). However, the relevance of these measurements to fitting patients comfortably with spectacles was first realized by Percival (1892) who used the ZCSBV to better understand which optical corrections might cause visual discomfort. From his experience as a clinician, Percival proposed that a subregion of the ZCSBV is comfortable and that spectacle prescriptions should utilize prisms and lenses to place natural stimuli inside this subregion. He argued that the comfortable subregion is the middle third of the ZCSBV: specifically, 1/3 of the region bounded by the maximum and minimum relative vergence lines. This region became known as Percival’s zone of comfort (Percival, 1892). Sheard (1934) reached a similar conclusion but claimed that the comfort zone extends from each side of the phoria line to 1/3 of the distance to the ZCSBV. Percival’s and Sheard’s criteria are the same when the phoria line bisects the ZCSBV and differ when it does not. Figure 4 shows a case in which they differ. Sheedy and Saladin (1977) compared various criteria for comfort after optical correction and found that Sheard’s criterion was a slightly better predictor for exophores and Percival’s criterion was slightly better for esophores.
Figure 4.
Percival’s and Sheard’s zones of comfort. Accommodative distance in diopters is plotted as a function of vergence distance in diopters. Percival’s criterion is represented by the green-shaded region. It encompasses the middle third of the ZCSBV. Sheard’s criterion is represented by the red-shaded region. It extends on both sides of the phoria line one-third of the way to the boundary of the ZCSBV.
Because phoria and the ZCSBV concern the relationship between vergence and focal stimuli, they may be useful for understanding how visual discomfort arises with viewing of S3D displays. There are, however, some potentially important differences between the conflicts that occur with optical correction and with stereo viewing. (1) With optical correction, the magnitude of the vergence–accommodation conflict is constant in diopters, but with viewing of stereo displays it varies. Thus, it may be much easier for the viewer to adapt to the conflict induced by optical correction than to the conflict induced by stereo viewing. (2) Optical corrections are worn most waking hours, while stereo viewing generally occurs for a much shorter duration. This difference should again make it easier to adapt to the conflict caused by optical correction than to the conflict caused by stereo viewing. Thus, phoria and the ZCSBV may or may not be useful for understanding discomfort associated with stereo viewing in entertainment, communication, and medicine. One purpose of this paper is to examine whether an individual’s phoria and ZCSBV predict the likelihood of experiencing discomfort in viewing S3D displays, and if so, the sorts of vergence–accommodation conflicts that lead to that discomfort.
As we said earlier, S3D displays are believed to cause discomfort and eventually fatigue beyond that experienced with non-stereo displays. Most researchers and engineers have assumed that the symptoms are caused by differences between the stimuli to vergence and accommodation because such differences require the viewer to uncouple vergence and accommodation (Emoto et al., 2005; Häkkinen et al., 2006; Howarth & Costello, 1997; Lambooij et al., 2009; Menozzi, 2000; Ukai, 2007; Wann & Mon-Williams, 2002; Yano et al., 2004). The evidence offered in support of this hypothesis is that viewers report more discomfort and fatigue when viewing stereo displays than when viewing conventional non-stereo displays (Emoto et al., 2005; Häkkinen et al., 2006; Jin, Zhang, Wang, & Plocher, 2007; Yamazaki, Kamijo, & Fukuzumi, 1990; Yano et al., 2002). This observation, however, does not prove that vergence–accommodation conflicts cause the symptoms because there are several other important differences between viewing non-stereo and stereo displays; these include the eyewear required with stereo displays to separate the two eyes’ images, ghosting or crosstalk from one eye’s image to the other’s image, misalignment of the images presented to the two eyes (Kooi & Toet, 2004), and the perceptual distortions that occur with stereo displays (Bereby-Meyer, Leiser, & Meyer, 1999) and not with non-stereo displays (Vishwanath, Girshick, & Banks, 2005). To show that the vergence– accommodation conflict per se causes visual discomfort and eventually fatigue, it is essential to have subjects view the same content in the same way with and without conflict. To do this, subjects should view the same stereo imagery when a conflict is present and when it is not present, and the experimenter should then compare the resulting symptoms. To our knowledge, only Hoffman et al. (2008) have done this, and consequently, that is the only study to have shown convincingly that vergence– accommodation conflict per se causes discomfort and fatigue. However, Hoffman et al. presented only one base viewing distance (39 cm or 2.5 D) and randomized the sign of the vergence–accommodation conflict. Therefore, they could not determine what the effects of viewing distance and conflict sign are. In the current paper, we present different viewing distances in different sessions in order to determine which distances cause the greatest symptoms. We also present both signs of conflict to determine whether one conflict direction is more uncomfortable than the other.
A model of what causes discomfort with stereo displays is sorely needed. With respect to the vergence–accommodation conflict, it would be very useful to establish guidelines for the range of disparities that should be presented on such displays, for the positioning of viewers relative to the display, and for the viewer characteristics that are likely to lead to discomfort. A guideline for S3D cinema has been described by Mendiburu (2009). His 3% rule states that the separation of the cameras used to generate the imagery should never be more than 1/30th of the distance from the cameras to the foreground in the scene. Such a rule would at first glance appear to yield a maximum allowable value of crossed disparity (disparities that place the specified object in front of the display screen). However, the rule only concerns the method by which the images were captured, and not how the images are displayed (i.e., a large display magnifies the images and the disparities, while a small display does not; see Discussion section), how the images are translated horizontally in post-processing, and how they are viewed (i.e., from what distance). All of these post-capture parameters are relevant to the disparity magnitude and, thus, to the magnitude of the vergence–accommodation conflict. Furthermore, the rule does not specify the maximum allowable uncrossed disparity (disparities specifying object positions behind the screen). It also does not incorporate the properties of the viewer (i.e., their refractive error, phoria, age, etc.).
In the current paper, we examine how vergence– accommodation conflicts affect visual comfort. In particular, we examine the effect of viewing distance, the sign of the vergence–accommodation conflict (i.e., crossed vs. uncrossed disparity), and some viewer properties such as refractive error and phoria. We also measure the time course of the buildup of discomfort as someone views stereo images.
Experiment 1
Methods
We first investigated the effect of viewing distance on the visual discomfort that accompanies a vergence– accommodation conflict of a given magnitude in diopters.
Subjects
Twenty-four subjects participated in the whole experiment. One was excluded because of an inability to accommodate and converge to all stimuli. Subjects’ ages ranged from 19 to 33 years. All had normal stereoacuity according to the Titmus Stereo test. Those who normally wear optical correction (15) wore their correction during the experiment (11 with contact lenses, 4 with spectacles). All subjects were unaware of the experimental hypotheses.
Equipment
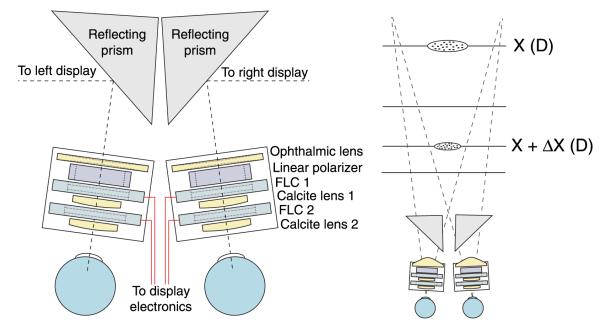
To investigate how different vergence and focal stimuli affect discomfort, we needed a display that could manipulate vergence distance and focal distance independently. To this end, we used the switchable lens, volumetric display developed by Love et al. (2009). Images were presented on two CRTs (22-in Iiyama HM204DT), one for each eye. The CRTs were arranged in a haploscope, so the images were viewed with front surface mirrors in front of the eyes (Figure 5). A switchable lens system was positioned between each eye and its front surface mirror. The lens systems enabled the manipulation of focal distance. The key element in the system is a birefringent lens; it is calcite machined into the shape of a lens. Birefringent material has two indices of refraction, one for light polarized along one crystalline axis and the other for light polarized along the orthogonal axis. When such material is lenticular in shape, it can take on one of two focal powers depending on the light’s polarization axis. We use calcite as the birefringent material because it is machinable and transparent. To implement the change in focal power, the light’s polarization angle is manipulated using ferroelectric liquid-crystal (FLC) polarization modulators. By stacking two modulator lens pairs, we obtain four discrete focal powers separated by 0.6 D. We synchronize each CRT with the switchable lens system so that the system adjusts focal distance to an assigned value for an image displayed on the CRT at that time. The displayed image at a given time contains the range of distances in the simulated scene that is appropriate for the current focal state of the lens system. By cycling the lens and imagery at 180 Hz, the full volume can be displayed with a 45-Hz refresh rate. For further details on this display technique, see Akeley, Watt, Girshick, and Banks (2004), Hoffman et al. (2008), and Love et al. (2009).
Figure 5.
Schematics of the apparatus. (Left) Schematic of the lens systems. The switchable lens systems (indicated by rectangles) both consist of two calcite lenses, two ferroelectric liquid-crystal modulators, a linear polarizer, and a glass ophthalmic lens. Display electronics controls the focal power of the lens system. Each eye views a CRT display via the switchable lens system and a prism with a front surface mirror. (Right) The display can create four image planes. Here, stimuli are displayed on two of them, spaced 1.2 D apart (horizontal lines). The ellipses represent cue-consistent stimuli. The gray dashed lines from the switchable lens systems indicate the viewing frusta for each eye.
The display’s workspace covers 1.8 D, but we needed focal distances ranging from 0.1 to 3.7 D. To meet this requirement, we shifted the focal workspace by placing glass lenses in the system. We used three base focal distances: 0.1 D (10 m), 1.3 D (77 cm), and 2.5 D (40 cm). Base vergence distance was set to those same values by rotating the arms of the haploscope. The display was carefully calibrated so that we could present visual stimuli with the intended vergence and focal distance accurately while keeping visual angle constant. Subjects were positioned such that both eyes were correctly positioned in the optical paths. This was accomplished by a combination of a sighting technique to locate the eyes relative to the bite bar (Hillis & Banks, 2001), adjustment of the separation of the two haploscope arms to be compatible with the subject’s interocular distance, positioning of the bite bar relative to the haploscope, and software alignment (Akeley et al., 2004). The diameter of the circular field of view was ~25°.
Stimuli
The experimental stimuli were random dot stereograms depicting sinusoidal depth corrugations. The dots were white on an otherwise dark background. We wanted the stimuli to require accurate vergence and accommodation. To this end, the dot density was high at 43 dots/deg2 and the depth corrugations were small in amplitude (peak– trough disparity = 4 arcmin) and high in spatial frequency (1, 1.4, and 2 cpd). Because of the high dot density and high corrugation frequency, subjects had to converge the eyes and focus reasonably accurately in order to perform the psychophysical task. The stimuli were presented in a circular aperture with a diameter of 4.2°. The space-average luminance was 0.13 cd/m2. The low value is due primarily to the use of a dark background for the random dot stereograms.
Procedure
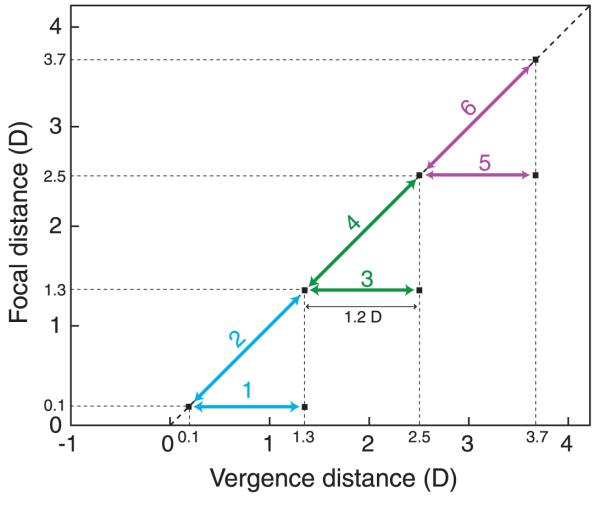
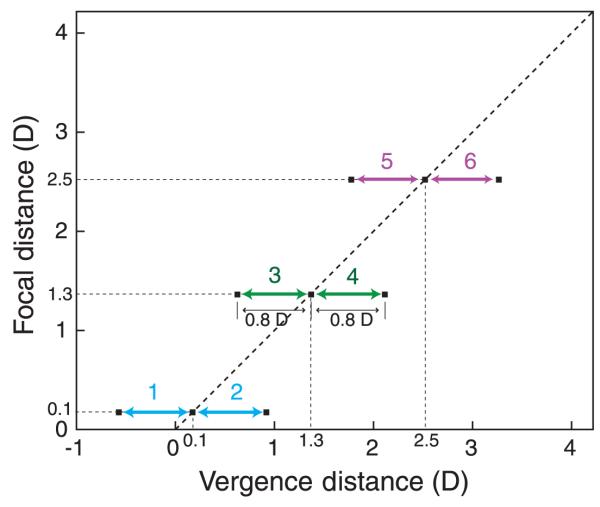
The six experimental conditions are depicted in Figure 6; more details are provided in Table 1. Two distances were presented in each subsession: a base distance and an increment distance. There were three cue-consistent conditions in which the vergence and focal distances were always equal to one another; these conditions simulate real-world viewing. There were also three cue-inconsistent conditions in which the focal distance was constant while the vergence distance changed; these conditions simulate the viewing of stereo displays. The experiment was divided into three sessions conducted on three consecutive days. Each session consisted of two subsessions conducted on the same day. A pair of subsessions always consisted of a cue-consistent subsession and a cue-inconsistent sub-session at one base distance. In a consistent subsession, the base vergence and focal distances were either 10 m (0.1 D), 77 cm (1.3 D), or 40 cm (2.5 D) and the increment vergence and focal distances were, respectively, 77 cm (1.3 D), 40 cm (2.5 D), or 27 cm (3.7 D). Table 1 shows the changes from one stimulus to another in different units. (The column for on-screen disparity is on-screen horizontal separation of the right- and left-eye images for a screen at the base distance.) In an inconsistent subsession, the base vergence and focal distances were the same as in the consistent subsession, but the increments were 1.2 D for the vergence stimulus and 0 D for the focal stimulus. Thus, in this condition subjects had to decouple their vergence and accommodation responses to fuse the stimulus and see it clearly. Note that the vergence stimuli were the same in the paired subsessions: The only difference was the focal stimulus, which was equal to the vergence stimulus in the consistent condition and fixed in the inconsistent condition. The ordering of the cue-consistent and cue-inconsistent conditions was random. Neither the subject nor the experimenter knew whether a given subsession was cue-consistent or cue-inconsistent. The experimenter did know the base distance because he had inserted the appropriate fixed glass lens into the system to adjust the workspace distance at the beginning of the session.
Figure 6.
The vergence and focal stimuli in Experiment 1. Vergence distance in diopters is plotted on the abscissa and focal distance in diopters is plotted on the ordinate. The diagonal arrows represent the stimuli in the three cue-consistent conditions (2, 4, and 6). In those conditions, the vergence and focal distances were always equal to one another; within the 3-interval trials, they changed by 1.2 D as indicated by the arrows. The horizontal arrows represent the stimuli in the three cue-inconsistent conditions (1, 3, and 5). In those conditions, the vergence distance changed in the same way as in the cue-consistent conditions, but the focal distance remained fixed.
Table 1.
Conditions in Experiment 1.
| Condition | Vergence distances (D) |
Vergence distances (m) |
Focal distances (D) |
Focal distances (m) |
On-screen disparities (m) |
|---|---|---|---|---|---|
| 1 | 0.1 and 1.3 | 10 and 0.77 | 0.1 | 10 | 0 and +0.756 |
| 2 | 0.1 and 1.3 | 10 and 0.77 | 0.1 and 1.3 | 10 and 0.77 | 0 |
| 3 | 1.3 and 2.5 | 0.77 and 0.40 | 1.3 | 0.77 | 0 and +0.058 |
| 4 | 1.3 and 2.5 | 0.77 and 0.40 | 1.3 and 2.5 | 0.77 and 0.40 | 0 |
| 5 | 2.5 and 3.7 | 0.40 and 0.25 | 2.5 | 0.40 | 0 and +0.030 |
| 6 | 2.5 and 3.7 | 0.40 and 0.25 | 2.5 and 3.7 | 0.40 and 0.25 | 0 |
Three stimuli were presented sequentially on each trial. The sequence was base–increment–base or increment– base–increment. Two of the presentations contained one corrugation orientation (+10 or −10° from horizontal) and the other contained the opposite orientation (−10 or +10°). Each presentation interval lasted 1.5 s, so the 3-interval sequence lasted 4.5 s. It was followed immediately by a 1-s response interval. The subject’s task was to identify the interval containing the odd orientation; this is a 3-interval, forced-choice oddity task. Auditory feedback was provided at the end of each trial. A subsession contained 219 trials and lasted ~20 min. We varied the spatial frequency of the stimulus corrugations (1, 1.4, and 2 cpd) according to the method of constant stimuli. We recorded percent-correct performance in the oddity task for each corrugation frequency and each experimental condition.
At the end of each subsession, subjects completed a symptom questionnaire. Then, they took a mandatory break lasting at least 30 min; the break was longer if they reported residual symptoms from the first subsession. After the break, subjects participated in the second subsession of the pair. At the end of a pair of subsessions, they also completed a session-comparison questionnaire.
On a subject’s first day in the experiment, he or she was taken through the consent-to-participate procedure, outfitted with a bite bar, and familiarized with the equipment. They also practiced the oddity task with no vergence– accommodation conflict.
Subjects were encouraged to complete the entire experiment but were permitted to stop if they became too uncomfortable; none dropped out early. They were paid for their participation.
Response measure (questionnaires)
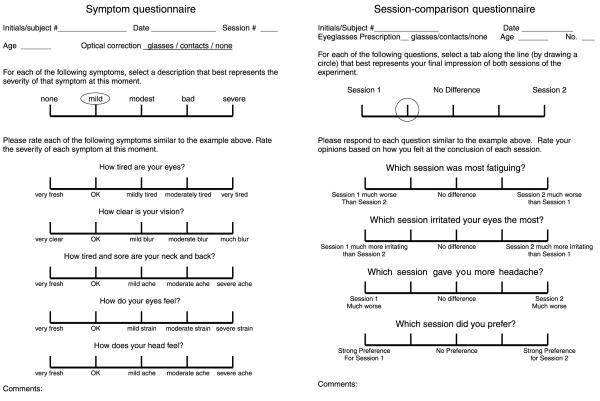
The symptom questionnaire (left side of Figure 7) was based on the one used by Hoffman et al. (2008). Subjects rated their symptoms on a 5-point Likert scale, where 1 indicated no negative symptoms at all and 5 indicated severe symptoms. The questions were:
How tired are your eyes?
How clear is your vision?
How tired and sore are your neck and back?
How do your eyes feel?
How does your head feel?
Figure 7.
The questionnaires. The one on the left is the symptom questionnaire that subjects filled out after each subsession. They circled the part of the 5-point scale that best characterized their current symptom. The one on the right is the session-comparison questionnaire that subjects filled out after each pair of subsessions.
If one experimental subsession caused more visual discomfort than another, we expect subjects to report higher numbers on questions 1, 2, 4, and 5 for that subsession than for the subsession with which it was paired. We included question 3 because differences in the visual experience in one subsession compared to another should not differentially affect the neck and back. That question therefore served as a check that subjects answered questions specific to the queried symptom.
After completing a pair of subsessions, subjects filled out a session-comparison questionnaire that asked them to compare the two subsessions (right side of Figure 7). This was also a 5-point Likert scale. In questions 1, 2, and 3, 1 meant that they much preferred subsession 2, and 5 meant that they much preferred subsession 1; in question 4, it was the other way around. The questions were:
Which session was most fatiguing?
Which session irritated your eyes the most?
Which session gave you more headache?
Which session did you prefer?
Results
Recall that we hoped to avoid order effects by separating the cue-consistent and cue-inconsistent sub-sessions by rest periods and by separating the sessions by 24 h. We found no statistically significant effects of the order in which conditions were presented, so we think the subsessions and sessions were sufficiently separated in time to avoid cross contamination. We were also concerned that our procedure might not produce discomfort. The average discomfort score for the cue-inconsistent subsessions (the ones with vergence–accommodation conflicts) averaged across subjects and viewing distance was 2.83 (where 1 would be no symptoms and 5 would be severe symptoms). Thus, we did indeed produce discomfort.
For an observer’s data to be included, their average performance on the oddity task had to be better than 75% correct across all conditions. Performance in specific conditions by individual subjects ranged from 49% to 98%. Performance in cue-consistent conditions was slightly higher than in cue-inconsistent conditions, but the difference was not statistically significant because performance was close to ceiling (percent correct averaged across subjects was 80–85% in the six conditions).
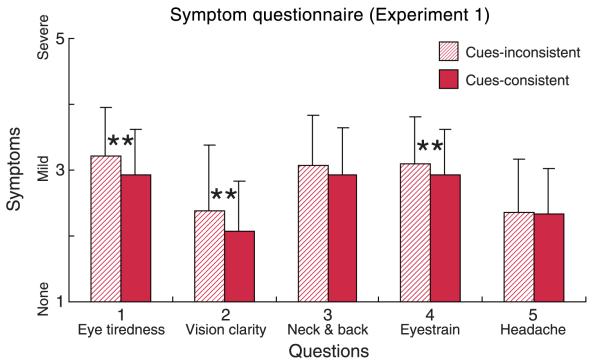
Figure 8 plots the results from the symptom questionnaire averaged across subjects and across distances. The striped and solid bars represent data from the cue-inconsistent and cue-consistent subsessions, respectively. The ordinate represents the reported severity of symptoms from 1 to 5, where 5 is the most severe. The reported symptoms were more severe in the inconsistent than in the consistent subsessions. The differences were statistically significant for question 1 (eye tiredness; Wilcoxon signed-rank test, p < 0.025, one-tailed), question 2 (vision clarity; p < 0.005, one-tailed), and question 4 (eyestrain; p < 0.025). There were no significant differences for questions 3 (neck and back) and 5 (headache). The cue-inconsistent subsessions mimicked the vergence–accommodation conflicts associated with stereo display viewing, and the cue-consistent ones mimicked natural viewing in which the conflict is essentially zero. Because everything else was the same in the two types of subsession (e.g., the task, apparatus), we can safely conclude that vergence– accommodation conflicts associated with viewing stereo displays are a cause of symptoms related to the eyes and vision. These results replicate the previous findings of Hoffman et al. (2008). It is interesting to note that greater motor response (vergence movement and accommodative movement) was required in the cue-consistent than in the cue-inconsistent conditions; yet people experienced more discomfort in the inconsistent conditions.
Figure 8.
Results from symptom questionnaire in Experiment 1. Reported symptoms averaged across subjects and across viewing distance are plotted for each of the five questionnaire items. The striped bars represent the symptoms with cue-inconsistent sessions and the solid bars represent the symptoms with cue-consistent sessions. Error bars represent standard deviations across observers; ** denotes a significance level of p < 0.025 for within-subjects analysis.
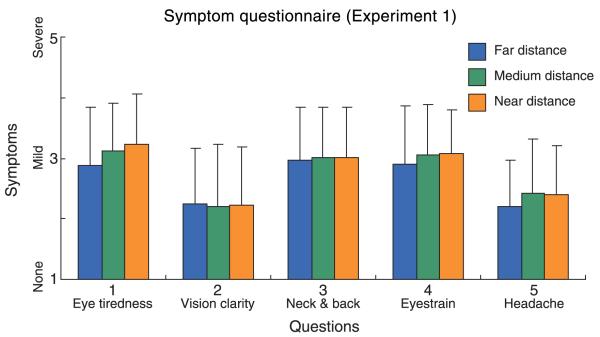
One of the main goals in this experiment was to examine the effects of viewing distance on discomfort. To examine this, we averaged scores from the consistent and inconsistent subsessions at each viewing distance. Those average values are plotted in Figure 9. There was a tendency toward more severe symptoms at nearer distances for questions 1, 4, and 5, but the differences were not statistically significant. That tendency was evident in the cue-consistent and cue-inconsistent data, suggesting that near distance viewing is generally less comfortable than far distance viewing.
Figure 9.
The effect of viewing distance in Experiment 1. The reported symptoms have been averaged across subjects and across consistent and inconsistent subsessions. The blue, green, and orange bars represent the average symptoms for far, medium, and near viewing distances, respectively. Error bars are one standard deviation across observers.
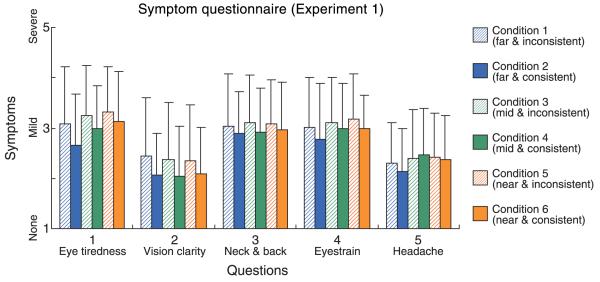
The failure to observe a significant effect of viewing distance on discomfort in Figure 9 does not mean that there was no differential effect of vergence–accommodation conflict across distance. To look for such effects, we plot in Figure 10 symptom severity, averaged across subjects, separately for each of the six conditions. Striped bars represent symptoms from the inconsistent subsessions (conditions 1, 3, and 5), and solid bars represent symptoms from the consistent subsessions (2, 4, and 6). Blue, green, and orange represent far, medium, and near viewing distances, respectively. Eye tiredness (question 1) was significantly worse in the inconsistent than the consistent subsession at the far viewing distance (Wilcoxon signed-rank test, p < 0.025, one-tailed) and was marginally worse at the mid distance (p < 0.10). Blurriness of vision (question 2) was significantly worse at the near, mid, and far distances (p < 0.005 for mid, p < 0.05 for near and far). There were no significant differences for questions 3, 4, and 5. Thus, the presence of vergence–accommodation conflict vs. no conflict had a somewhat greater effect on discomfort at far distance even though near distances were slightly less comfortable overall.
Figure 10.
Results from symptom questionnaire in Experiment 1. The average severity of reported symptoms is plotted for each of the five questionnaire items and for each of the six experimental conditions. The ordinate represents symptom severity, greater values indicating greater severity. Blue, green, and orange represent far, mid, and near distances, respectively. Striped bars represent reported symptoms after inconsistent subsessions (conditions 1, 3, and 5), and solid bars represent symptoms after consistent subsessions (2, 4, and 6). Error bars are one standard deviation computed across observers.
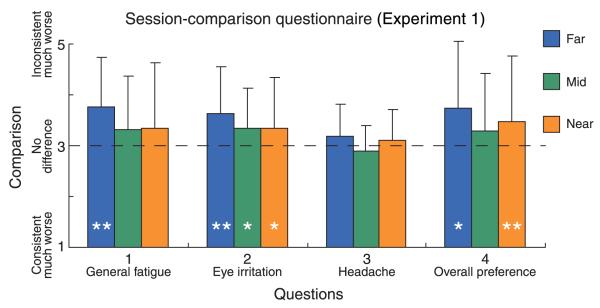
We next look at the results from the session-comparison questionnaire. In this questionnaire, subjects compared symptoms after each pair of subsessions (consistent and inconsistent). Figure 11 shows the comparison score averaged across subjects for each of the four questions and three viewing distances. The dashed horizontal line corresponds to a score of 3 indicating no difference between subsessions. Scores greater than 3 indicate more severe symptoms in or less preference for the inconsistent subsession compared to the consistent subsession. The reports of more fatigue and eye irritation (questions 1 and 2) were statistically significant at the far distance (Wilcoxon signed-rank test, p < 0.005, one-tailed). The reports of eye irritation were also marginally significantly worse at the mid and near distances (p < 0.10). For general display preference, there was a significant difference for the near viewing distance and a marginally significant difference for the far viewing distance (question 4; p < 0.05 for near, p < 0.10 for far). The comparison results were generally consistent with the symptom questionnaire results, which showed that vergence–accommodation conflict caused somewhat more discomfort at far than at near distance.
Figure 11.
Results from the session-comparison questionnaire in Experiment 1. The comparison score (consistent vs. inconsistent) averaged across subjects is plotted for each question and condition. The horizontal dashed line represents a score of 3 indicating no difference between consistent and inconsistent subsessions. Scores greater than 3 indicate more severe symptoms in or less preference for the inconsistent subsession. Error bars represent one standard deviation; * and ** denote significance levels of p < 0.10 and 0.05, respectively. Error bars are one standard deviation computed across observers.
Experiment 2
We next investigated how the sign of the vergence– accommodation conflict affects visual discomfort at different viewing distances.
Methods
Subjects
Fourteen subjects participated in this experiment. Their ages ranged from 20 to 34 years. Many of them had also participated in Experiment 1. Again all were given a stereoacuity test, wore their normal optical correction (9 with contact lenses, 2 with glasses, and 3 with no correction), and were unaware of the experimental hypotheses. One additional subject was excluded from participation because she could not diverge sufficiently to fuse the farthest stimulus (which required divergence beyond parallel). Another subject could fuse all the stimuli but was excluded because she could not do the oddity task consistently.
Equipment and procedure
The same equipment, stimuli, procedure, and response measures were used in Experiment 2 with a few exceptions, which are noted here. There were again two subsessions in each session, but both subsessions contained a fixed focal distance and were therefore cue-inconsistent. In one subsession, the vergence–accommodation conflict was positive (vergence distance greater than focal distance in diopters; crossed disparity; content in front of screen), while in the other, it was negative (vergence distance less than focal distance in diopters; uncrossed disparity; content behind screen). These conditions are depicted in Figure 12. Details are provided in Table 2. The change in vergence distance was always ±0.8 D, while the focal distance remained constant within a subsession. We had to use a smaller conflict than in Experiment 1 (0.8 vs. 1.2 D) because many subjects would not otherwise have been able to fuse the stimuli in condition 1. Note that the divergence required for the far stimulus in condition 1 was 2.53°. Pairs of subsessions were presented on consecutive days at focal distances of 0.1 D (10 m), 1.3 D (77 cm), and 2.5 D (40 cm). As before, the ordering of subsessions and sessions was randomized. Neither the experimenter nor the subject knew if the current subsession contained positive or negative vergence–accommodation conflict. The experimenter did know the base distance because he had inserted the required glass lens to adjust base distance before the session began.
Figure 12.
The vergence and focal stimuli in Experiment 2. Vergence distance in diopters is plotted on the abscissa and focal distance in diopters is plotted on the ordinate. The horizontal arrows represent the stimuli in the six conditions. Three of those conditions (2, 4, and 6) involved positive vergence–accommodation conflicts in which the vergence distance in diopters was greater than the focal distance in diopters (crossed disparity; content in front of screen). The other three conditions (1, 3, and 5) involved negative conflicts (vergence distance in diopters less than focal distance; uncrossed disparity; content behind screen). In all conditions, vergence distance changed, but focal distance remained constant.
Table 2.
Stimulus conditions for Experiment 2.
| Condition | Vergence distances (D) |
Vergence distances (m) |
Focal distances (D) |
Focal distances (m) |
On-screen disparities (m) |
|---|---|---|---|---|---|
| 1 | +0.1 and −0.7 | 10 and >∞ | +0.1 | 10 | 0 and −0.504 |
| 2 | +0.1 and +0.9 | 10 and 1.11 | +0.1 | 10 | 0 and +0.504 |
| 3 | +1.3 and +0.5 | 0.77 and 2.0 | +1.3 | 0.77 | 0 and −0.039 |
| 4 | +1.3 and +2.1 | 0.77 and 0.48 | +1.3 | 0.77 | 0 and +0.039 |
| 5 | +2.5 and +1.7 | 0.40 and 0.59 | +2.5 | 0.40 | 0 and −0.020 |
| 6 | +2.5 and +3.3 | 0.40 and 0.30 | +2.5 | 0.40 | 0 and +0.020 |
We wanted to measure the time course of visual fatigue, so we asked subjects every 2 min to indicate how tired their eyes were at that moment (question 1 from the symptom questionnaire). They responded by pressing 1–5 on the numeric keyboard. If they failed to respond within 5 s, the experiment continued. We taught each subject to perform both tasks in a 3-min training session. None of the 14 subjects had difficulty learning this. After the training session, they took a 10-min break after which they began the main experiment.
Results
Although the distance change (and therefore the magnitude of conflict) was reduced from 1.2 to 0.8 D, all subjects still reported significant symptoms. Toward the end of a subsession, reports of 4 and 5 (recall that 3 is “mild” and 5 is “severe”) were often given for the 2-min assessments of eye tiredness. The average reported discomfort at the end of a subsession was 2.60 (from all sessions averaged across subjects, distances, and questions) compared to 2.83 in Experiment 1. Thus, subjects experienced discomfort in Experiment 2, but it was slightly less than experienced in Experiment 1 presumably because the magnitude of the vergence–accommodation conflict was smaller. We again looked for evidence of an effect of session order and found no statistically signifi-cant effect.
For a subject’s data to be included, their average performance on the oddity task had to be better than 80% correct. Individual performance ranged from 71% to 98% in different conditions. There were no statistically significant differences in performance across conditions mostly because performance was close to ceiling (across-subject averages ranged from 84% to 92%).
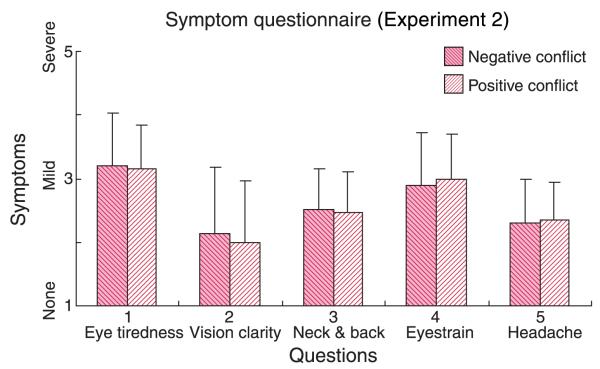
We first asked whether positive vergence–accommodation conflicts (vergence distance in diopters greater than accommodative distance) produced more or less discomfort in general than negative conflicts. Figure 13 plots the severity of reported symptoms averaged across subjects and viewing distances for positive and negative conflicts. There were no overall differences in symptom severity between positive and negative conflicts (p > 0.10 for all comparisons). Thus, 0.8-D conflicts in one direction cause the same amount of discomfort as 0.8-D conflicts in the other direction, at least when averaged across viewing distance.
Figure 13.
The effect of direction of vergence–accommodation conflict in Experiment 2. The reported symptoms have been averaged across subjects and across distances. The red and pink bars represent the average symptoms for negative and positive conflicts, respectively, where negative conflict has a dioptric vergence distance smaller than the accommodative distance (uncrossed disparity; content behind screen) and positive conflict has a vergence distance greater than the accommodative distance (crossed disparity; content in front of screen). Error bars are one standard deviation computed across observers.
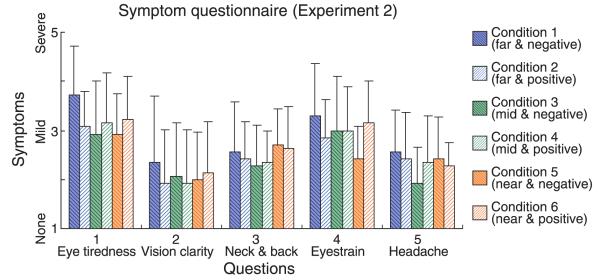
The fact that we observed no more or less discomfort for positive than negative conflicts when averaged across distance does not mean that discomfort does not depend on the sign of the conflict at a given distance. We next examined whether our discomfort data revealed such an interaction with distance. Figure 14 shows the severity of reported symptoms, averaged across subjects, for different distances and for the two conflict directions separately. Blue, green, and orange bars represent the data for far, mid, and near distances, respectively. Darker bars represent data for negative conflicts (uncrossed disparity) and lighter bars represent data for positive conflicts (crossed disparity). More severe symptoms were generally reported at the far distance when the conflict was negative than when it was positive, but the difference was statistically significant for only eye tiredness and eyestrain (questions 1 and 4; Wilcoxon signed-rank test, p < 0.05, two-tailed). At near distance, more severe symptoms were generally reported when the conflict was positive, but the difference was statistically significant for eyestrain only (question 4; p < 0.01). Thus, there was indeed evidence that negative conflicts are more uncomfortable at far viewing distance and positive conflicts are more uncomfortable at near distance. The only other statistically significant difference was that headache was worse at the medium distance with positive than with negative conflict (question 5; p < 0.05).
Figure 14.
Results from symptom questionnaire in Experiment 2. The average severity of reported symptoms is plotted for each of the five questionnaire items and for each of the six conditions. The ordinate represents symptom severity, greater values indicating greater severity. Blue, green, and orange represent far, mid, and near distances, respectively. Dark bars represent symptoms after subsessions with negative conflict (uncrossed disparity; conditions 1, 3, and 5) and light bars represent symptoms after subsessions with positive conflict (crossed disparity; 2, 4, and 6). Error bars are one standard deviation computed across observers.
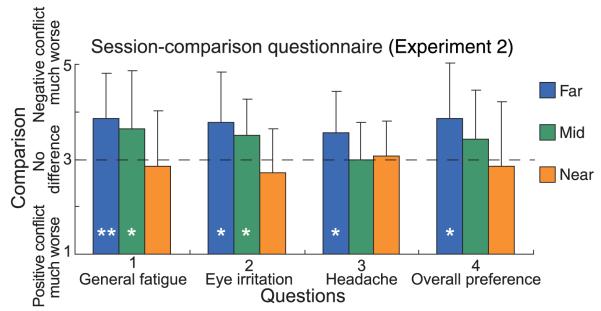
We next look at the results for the session-comparison questionnaire. Figure 15 plots the comparison score (positive vs. negative conflict) averaged across subjects for each of the four questions and three viewing distances. Higher values indicate less favorable ratings for negative conflict (uncrossed disparity; content behind screen). For each question, there is a clear trend for the negative conflict (uncrossed disparity) to produce more symptoms and be less preferred at far distance and to produce fewer symptoms and be more preferred at the near distance. This result is consistent with the data from the symptom questionnaire (Figure 14). Specifically, at the far distance, negative conflict produced more fatigue (question 1, Wilcoxon, signed-rank test, p < 0.05, two-tailed), eye irritation, and headache (p < 0.10) and was less preferred (p < 0.10). At the mid distance, negative conflict produced more fatigue and eye irritation (p < 0.10). The difference in the comparison score between far and near distances was significant for general fatigue and eye irritation (questions 1 and 2; p < 0.05) and marginally significant for overall preference (question 4; p < 0.10).
Figure 15.
Results from session-comparison questionnaire in Experiment 2. The comparison score (negative conflict vs. positive conflict) averaged across subjects is plotted for each question and condition. Higher values on the ordinate indicate less favorable ratings for the negative conflict (uncrossed disparity). The horizontal dashed line represents a score of 3 indicating no difference between negative and positive conflict subsessions. Error bars are one standard deviation of observer responses; * and ** denote significance levels of p < 0.10 and 0.05, respectively.
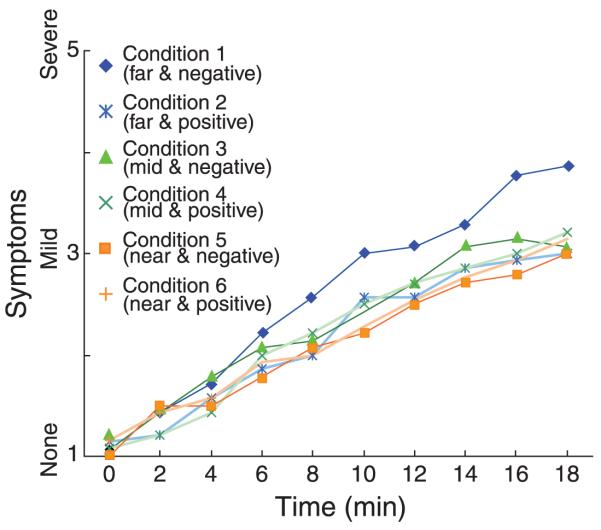
We wondered whether discomfort builds up steadily over time, whether it is present from the beginning and then remains constant, or whether it increases in step-like fashion at some point in time. To find out, one should look at the discomfort of individual subjects as a function of time. Unfortunately, those data were very noisy and hence difficult to interpret. We therefore averaged scores across subjects to produce Figure 16. Clearly, average discomfort grew steadily over time. From this, one can rule out the hypothesis that discomfort started at the beginning of a subsession and remained relatively constant from then on. However, one cannot determine whether discomfort grew steadily in all subjects or whether it grew in step-like fashion with the step occurring at different times for different subjects.
Figure 16.
Time course of discomfort in Experiment 2. We asked subjects every 2 min to indicate from 1 to 5 how tired their eyes were (i.e., question 1 in the symptom questionnaire). Four subjects did not respond at some of the time intervals, so some points represent data from fewer subjects than other points.
Summary of results on comfort zone
We estimated the zone of comfort from the results in Experiment 2. There were two problems in such estimation: questionnaire data like ours are inherently noisy, and we sampled only six points in vergence–focal space. To deal with these limitations, we had to make some assumptions, and as a consequence, the resulting estimate is arguable. Nonetheless, we think it is useful to make the best estimate possible given the data that currently exist.
We used the responses from questions 1, 2, and 4 (the ones pertaining to the eyes and vision) in the symptom questionnaire to estimate the relative widths of the zone at various focal distances. We first calculated an overall score for each distance and sign (s) by averaging the responses to questions 1, 2, and 4 for all observers. The relative width of the zone was then determined from this overall score using the following equation:
| (1) |
where s is the overall discomfort score and w is the estimated relative width of comfort zone for a conflict sign and at a particular distance. smean is the average overall score across all subjects, distances, and signs, and srange is the overall score range averaged across all subjects. Both are constants: smean is 2.73 and srange is 1.17. wmean and wrange are constants representing the average and range of the candidate relative widths. We assumed that the maximum and minimum relative widths of the comfort zone were 0.8 D and 0.3 D, respectively. We chose 0.8 D for the maximum because this was the size of the conflict in Experiment 2 and it created discomfort. We chose 0.3 D for the minimum because it corresponds to the eye’s depth of focus (Campbell, 1957). Therefore, wmean and wrange are 0.55 D and 0.50 D, respectively. With this procedure, we obtained three horizontal offsets from the natural viewing line in the positive direction and three offsets in the negative direction.
We then fit a regression line for the triple of relative widths for each sign and used those lines as the estimate of the boundaries of the zone of comfort plotted in diopters. The equations for the far (negative) and near (positive) boundaries are, respectively:
| (2) |
where Df is focal distance in diopters, Dv is vergence distance in diopters, mfar and mnear are the slopes of the far and near lines, respectively, and Tfar and Tnear are the ordinate intercepts for the far and near lines, respectively.
Figure 17 shows the estimate of the zone of comfort plotted in diopters. Obviously, the discomfort data do not definitively specify the positions and shapes of the boundaries, but some features were evident in the data and are therefore present in the figure as well: The slopes of the upper and lower lines are slightly greater than 1 and the zone is narrower at long distances (small dioptric values) than at short distances (large dioptric values).
Figure 17.
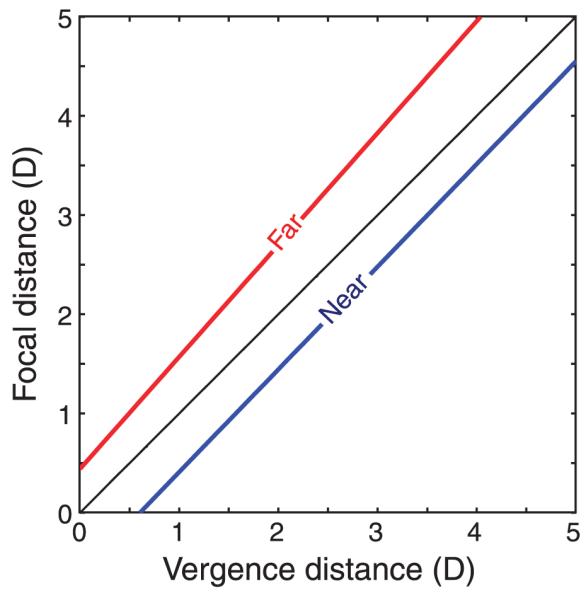
Zone of comfort estimated from data of Experiment 2. The far and near boundaries of the comfort zone are plotted as a function of vergence and focal distances in diopters. The far boundary corresponds to the estimate of the largest comfortable negative conflict (content behind the screen) and the near boundary corresponds to the estimate of the large comfortable positive conflict (content in front of the screen). The far and near boundaries are defined by Equation 2. mnear and Tnear are the slope and y-intercept for near boundary, while mfar and Tfar are the slope and y-intercept for far boundary, and they are mnear = 1.035, Tnear = −0.626, mfar = 1.129, and Tfar = 0.442.
Experiment 3
It is generally recognized that individuals can differ greatly in their susceptibility to visual discomfort and fatigue. There are undoubtedly numerous traits that contribute to the susceptibility, but we chose to examine two—phoria and the zone of clear single binocular vision—because they are logically related to the vergence– accommodation conflict and because they have well-established value in clinical assessments of vision. Phoria is the vergence posture of the eyes (actually vergence relative to the demand line) for different distances of the focal stimulus when there is no binocular stimulus to guide vergence. The zone of clear single binocular vision (ZCSBV) is the set of combinations of vergence and focal distances for which the subject can fuse and focus the stimulus simultaneously.
In the next experiment, we examined whether an individual subject’s phoria and/or ZCSBV predicts their susceptibility to visual discomfort and fatigue when presented certain vergence–accommodation conflicts.
Methods
Subjects
Twenty-four subjects participated. Their ages ranged from 19 to 34 years. Many of them had also participated in Experiment 1 (20) and Experiment 2 (14). Of those who participated in Experiment 1 and/or Experiment 2, 12 participated in all three. Two subjects, one an author, participated in Experiment 3 only. Subjects wore their normal optical corrections during the measurements. All but one subject (one of the authors) were unaware of the experimental hypotheses.
Equipment and procedure
We used a conventional clinical phoropter to measure phoria and the ZCSBV. Phoropters have a Risley prism in front of each eye, which allows the operator to make continuous changes to the stimulus to vergence.
To measure phoria, we followed standard clinical practice. The stimulus was a sharp, high-contrast vertical line. We adjusted the Risley prism for the right eye until it created a vertical offset of 4 prism diopters relative to the left eye; none of the subjects could fuse such a large vertical offset. We covered the left eye and set its Risley prism to an arbitrary horizontal vergence. We then flashed the stimulus to the left eye and the subject reported whether the perceived location of the flashed stimulus was to the left or right of the perceived location of the steady stimulus. Depending on the response, we adjusted the horizontal stimulus position for the left eye and repeated the presentation of the flashed stimulus. We continued this flash-and-adjust procedure until the subject said the two stimuli were vertically aligned. We made these measurements at four focal distances: 3 m (0.33 D), 77 cm (1.3 D), 40 cm (2.5 D), and 25 cm (4 D) in pseudorandom order. Each measurement was done three times.
To measure the ZCSBV, we again followed standard clinical practice. The stimulus was a column of six small, high-contrast letters. As the subject viewed the letters binocularly, we increased the vergence stimulus symmetrically to the two eyes at a rate of ~2 prism diopters per second. The subject indicated when the stimulus first appeared blurry and/or double, and we recorded the prism setting at which that occurred. For each measurement, we began with the prism set to 0. Measurements were done in pairs, first changing the prism setting in the base-in direction (negative relative vergence) until blurriness and/or diplopia occurred, and then changing in the base-out direction (positive relative vergence). This is the standard practice because the measurement of negative vergence produces less adaptation than the measurement of positive vergence. We made measurements for targets at distances of 3 m (0.33 D), 77 cm (1.3 D), 40 cm (2.5 D), and 25 cm (4 D). Each pair of measurements was made at one distance before moving on to another randomly chosen distance. Each measurement was done three times.
Results
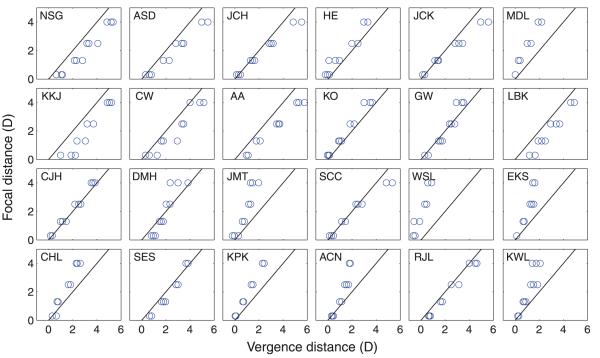
Figure 18 plots the phoria results for every subject. The measurements were very repeatable within subjects, but there were differences between subjects.
Figure 18.
Phorias in Experiment 3. Each panel shows the data from one of the 24 subjects. In each case, the dioptric distance of the focal stimulus is plotted on the ordinate and the corresponding dioptric distance of the vergence response is plotted on the abscissa. Measurements were done three times at each focal distance. Black lines represent the natural viewing line on which vergence and focal distances are the same.
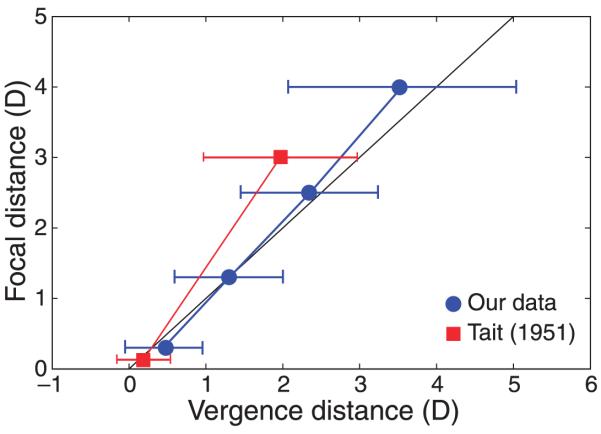
Figure 19 shows the average phorias for each subject at each focal distance. The average phoria is slightly esophoric (over-convergence) at the farthest distance (3 m) and becomes increasingly exophoric (under-convergence) at nearer distances. The standard deviation increases monotonically with increasing focal distance in diopters.
Figure 19.
Average phoria measurements. The dioptric distances of the focal stimulus are plotted on the ordinate and the corresponding dioptric distances of the vergence response are plotted on the abscissa. The black line represents the natural viewing line on which vergence and focal distances are the same. Blue circles represent the vergence responses at each focal distance averaged across subjects. Red squares represent average responses from Tait (1951). Tait’s data were provided with vergence response in prism diopters; we converted them into diopters. Error bars are standard deviations across observers.
We compared our data to measurements in the literature. Most previous studies of phoria had a subject population composed of clinical patients or older people, or they measured phoria at only one distance (e.g., Alvarez, Puell, Sánchez-Ramos, & Villena, 2006; Leone et al., 2010; Morgan, 1944). Our subjects were young adults with normal binocular vision. The study of Tait (1951) was most similar to ours. He measured phoria in 4,880 people between 10 and 70 years of age. He made the measurements at two focal distances: 6 m (0.17 D) and 0.33 m (3 D). His data were presented with vergence response in prism diopters, so we converted them into diopters by using the formula D = P/iod, where P is prism diopters and iod is interocular distance, which we assumed was 6.3 cm (Dodgson, 2004; French, 1921). The red squares in Figure 19 show the means and standard deviations of Tait’s data. His data are similar to ours in that both show little if any phoria at long distance and a tendency toward exophoria with decreasing distance. His data and ours also exhibit greater between-subject variance with decreasing distance. Tait’s data differ from ours in that his data exhibited greater exophoria at near distance. This difference may reflect the greater number of older subjects in his population (Hirsch, Alpern, & Schultz, 1948).
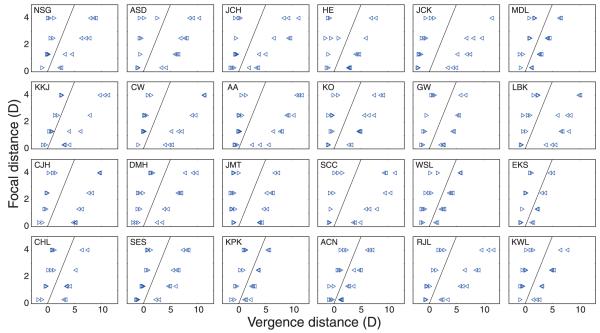
Figure 20 shows the ZCSBV measurements for each individual and Figure 21 shows the averages. The ordinates represent focal distance and the abscissas represent the vergence distances at which subjects first experienced blurred and/or double vision. The ZCSBV is the region between the data points. From the individual data in Figure 20, you can see that measurements were quite repeatable, but there was considerable variation across subjects. From the average data in Figure 21, you can see that the zone generally widened with increasing distance in diopters (decreasing distance in centimeters). These data are similar to previous measurements (Fry, 1939; Saladin & Sheedy, 1978).
Figure 20.
Zones of clear single binocular vision (ZCSBVs) measured in Experiment 3. Each panel shows the data from one of the 24 subjects. The ordinates are focal distance in diopters and the abscissas are vergence distance in diopters where the subject first experienced blurred and/or double vision. The thin black lines are the natural viewing line where vergence and focal stimuli are equal. The rightward-pointing triangles on the left represent the average negative vergences we obtained. The leftward-pointing triangles on the right represent the average positive vergences.
Figure 21.
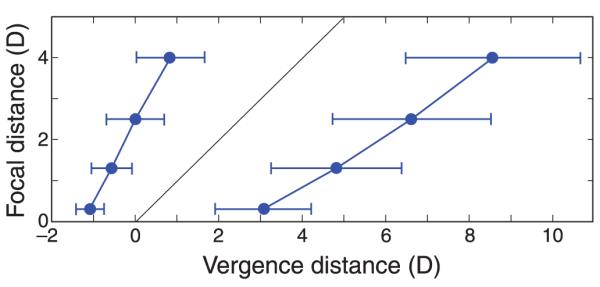
The zone of clear single binocular vision (ZCSBV) measured in Experiment 3. The ordinate is focal distance in diopters and the abscissa is vergence distance in diopters where the subject first experienced blurred and/or double vision. The thin black line is the natural viewing line where vergence and focal stimuli are equal. The circles on the left represent the average negative vergences we obtained. The circles on the right represent the average positive vergences. Error bars are standard deviations across observers.
Figure 22 shows the zone of comfort according to Percival’s and Sheard’s criteria calculated from our phoria and ZCSBV data (Figures 19 and 21, respectively) along with the zone of comfort estimated from Experiment 2. Sheard’s zone is shifted leftward relative to Percival’s zone because Sheard’s zone starts from the phoria line that is shifted leftward relative to the center of the ZCSBV. The width of both zones (in diopters) increases as focal distance (in diopters) increases. This widening is consistent with the results from Experiment 1: For the same magnitude of vergence–accommodation conflict, subjects reported smaller differences in discomfort between the cue-consistent and cue-inconsistent conditions at greater focal distances (in diopters; Figures 10 and 11). It is also consistent with the results from Experiment 2: For the same magnitude of conflict, subjects had more severe symptoms with negative conflicts (uncrossed disparity) at the far distance and with positive conflicts (crossed disparity) at the near distance (Figures 14 and 15). Qualitatively, it appears that any stimulus falling within our estimate of the zone of comfort would be judged comfortable by Sheard’s criterion but not necessarily by Percival’s criterion.
Figure 22.
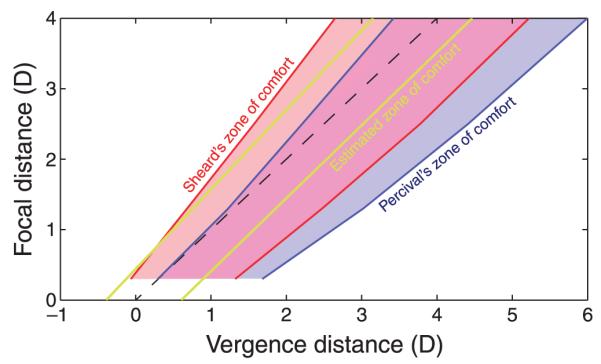
Comparison between optometric zones of comfort and our estimated zone. The ordinate is focal distance in diopters and the abscissa is distance of the vergence response in diopters. The dashed black line is the natural viewing line where vergence and focal stimuli are equal. The zone of comfort according to Percival’s criterion is the middle third of the ZCSBV; it is the blue-shaded region (purple where it overlaps with Sheard’s zone). The zone of comfort according to Sheard’s criterion is 1/3 the distance from the phoria line to the negative and positive relative vergence boundaries. It is the red-shaded region (purple where it overlaps with Percival’s zone). The boundaries of estimated zone of comfort based on our experimental data are drawn with the yellow lines.
Earlier we discussed the possible relationship between Percival’s and Sheard’s zones of comfort, which are based on optometric measurements, and the zone of comfort associated with S3D viewing estimated from Experiments 1 and 2. We argued that these zones are not synonymous but could be related. From Figure 22, you can see that Percival’s and Sheard’s criteria imply larger comfort zones than our data suggest. This difference could, of course, be due to differences in the criteria: We may have used a less tolerant definition of “comfort” than Percival and Sheard. You can also see that Sheard’s criterion is more similar to our estimated zone than Percival’s criterion is; Percival’s zone is shifted more toward near vergence distances than either Sheard’s or our zone.
To look further into the association between the measurements from Experiment 3 and the discomfort measured in Experiments 1 and 2, we calculated a variety of correlations between reported symptoms and predicted discomfort.
We first derived discomfort predictions from three criteria: Percival’s, Sheard’s, and distance from the phoria line. Those predictions were derived from the data of Experiment 3 and then correlated with the data in Experiments 1 and 2. The prediction scores—kPercival, kSheard, and kphoria—were derived from the following equations:
| (3) |
where V is the average of vergence stimulus in a given condition. The focal distances used in the calculations were the averages of the focal stimulus in a given condition. Vp and Vn are the absolute values of positive and negative relative vergences. To obtain them, we fit the boundaries of the ZCSBV in Experiment 3 with regression lines. We then read off Vp and Vn from those lines at the appropriate focal distances. P is the absolute vergence value on the phoria line. To obtain P, we fit the phoria measurements in Experiment 3 with regression lines. We then read off P from those lines at the appropriate focal distances. We correlated those prediction scores (one score for each condition and each subject: 20 subjects × 6 conditions = 120 scores for Experiment 1; 14 subjects × 6 conditions = 84 scores for Experiment 2) with the discomfort scores in Experiments 1 and 2 (20 subjects × 6 conditions × 5 questions = 600 responses in Experiment 1; 14 subjects × 6 conditions × 5 questions = 420 responses in Experiment 2).
Table 3 shows the resulting correlations. The upper, middle, and bottom parts of the table show the correlations between symptoms and kPercival, kSheard, and kphoria, respectively. The rows in each part correspond to the five questions in the symptom questionnaire. The columns correspond to the experiment (Experiment 1 on the left and Experiment 2 on the right) and the viewing distance (from left to right, far, mid, and near).
Table 3.
Correlation between data of Experiment 3 and data of Experiments 1 and 2.
| Experiment 1 |
Experiment 2 |
|||||||
|---|---|---|---|---|---|---|---|---|
| Far | Mid | Near | Overall | Far | Mid | Near | Overall | |
| Correlation between Percival’s criterion and discomfort score | ||||||||
| Q1: Eye tiredness | 0.278 | 0.406 | 0.280 | 0.296 | 0.549 | 0.219 | 0.168 | 0.344 |
| Q2: Vision clarity | −0.045 | −0.102 | −0.124 | −0.083 | 0.181 | −0.075 | −0.184 | 0.006 |
| Q3: Neck and back | 0.063 | 0.323 | 0.300 | 0.222 | 0.172 | −0.039 | 0.128 | 0.076 |
| Q4: Eyestrain | 0.169 | 0.415 | 0.299 | 0.272 | 0.420 | 0.077 | 0.205 | 0.260 |
| Q5: Headache | 0.248 | 0.446 | 0.098 | 0.252 | 0.138 | 0.062 | 0.197 | 0.147 |
| Correlation between Sheard’s criterion and discomfort score | ||||||||
| Q1: Eye tiredness | 0.118 | 0.350 | 0.271 | 0.238 | 0.327 | 0.233 | 0.089 | 0.257 |
| Q2: Vision clarity | 0.210 | 0.273 | 0.334 | 0.271 | 0.207 | −0.052 | 0.052 | 0.092 |
| Q3: Neck and back | −0.134 | 0.033 | 0.289 | 0.053 | 0.152 | −0.129 | 0.227 | 0.078 |
| Q4: Eyestrain | 0.197 | 0.251 | 0.318 | 0.247 | 0.410 | 0.021 | 0.172 | 0.229 |
| Q5: Headache | 0.136 | 0.283 | 0.105 | 0.174 | 0.138 | 0.035 | 0.342 | 0.175 |
| Correlation between the distance to phoria and discomfort score | ||||||||
| Q1: Eye tiredness | 0.169 | 0.318 | 0.276 | 0.275 | −0.092 | 0.308 | 0.220 | 0.118 |
| Q2: Vision clarity | 0.036 | 0.172 | 0.436 | 0.208 | −0.167 | −0.111 | 0.120 | −0.054 |
| Q3: Neck and back | 0.023 | −0.019 | 0.307 | 0.102 | −0.038 | −0.032 | 0.351 | 0.130 |
| Q4: Eyestrain | 0.070 | 0.175 | 0.340 | 0.210 | 0.120 | 0.073 | 0.248 | 0.108 |
| Q5: Headache | 0.050 | 0.272 | 0.244 | 0.215 | −0.107 | 0.133 | 0.518 | 0.153 |
The correlations were generally low because subjective discomfort estimates are inherently noisy. Positive correlations indicate that the discomfort prediction score was associated with reported discomfort and, thus, is a good predictor. The correlations that were statistically significant (p ≤ 0.05, one-tailed) are displayed in red. The correlations that were marginally significant (0.05 < p ≤ 0.10) are displayed in green. The correlations that were not significant are displayed in black. There were 52 significant or marginally significant correlations out of the 120 possibilities, many more than would be expected by chance and all the significant correlations were positive. Thus, despite the noisiness of the subjective questionnaire data, the variation in discomfort experienced in Experiments 1 and 2 can indeed be predicted from the phoria and ZCSBV measurements in Experiment 3.
The predictive values of Percival’s criterion (18 significant or marginally significant correlations), Sheard’s criterion (19), and the phoria (15) were roughly the same. This is not very surprising given the similarities in the nature of the three predictors. In Experiment 1, there were many significant correlations for the near and mid distances and essentially none for the far distance. Thus, the phoria and ZCSBV measurements were quite predictive of discomfort at the near and mid distances but not at the far distance. In Experiment 2, the correlations were generally less significant in part because there were fewer subjects. There were more significant correlations for far than for the other two distances. Questions 1 and 4 (eye tiredness and eyestrain, respectively) had the most significant correlations, and this suggests that phoria and ZCSBV measurements are more predictive of those symptoms.
We conclude that phoria and ZCSBV are related to the discomfort individuals experience in the presence of the vergence–accommodation conflicts associated with S3D viewing.
Discussion
Summary of findings
Our results show that vergence–accommodation conflicts are a cause of visual discomfort associated with viewing stereo displays. In Experiment 1, we found that a 1.2-D crossed disparity conflict is relatively more uncomfortable at far viewing distance than at near but that there is greater overall fatigue when viewing a near display. In Experiment 2, we found at long viewing distance that a 0.8-D conflict behind the screen is more uncomfortable than a 0.8-D conflict in front of the screen, and we found the opposite at short viewing distance: that a 0.8-D conflict in front of the screen is more uncomfortable than a 0.8-D conflict behind the screen. In Experiment 3, we measured individual subjects’ phoria and zone of clear single binocular vision. We found that those measures correlated with many aspects of discomfort measured in Experiments 1 and 2. Those optometric measurements allow one to predict who will be more uncomfortable and in what circumstances. We now consider the implications of our findings including a variety of practical issues.
We have expressed vergence–accommodation conflict in units of diopters because it is a convenient way of considering these conflicts when all distances are clearly established. It is, however, an unusual way to express disparity. Optometrists manipulate vergence (and disparity) using prisms and, therefore, use angular units. Cinematographers are concerned with appropriate framing of the scene and, thus, express disparity as a percentage of the screen width. Display engineers express disparity as on-screen distances. Understanding the relationship between these measures of disparity and vergence–accommodation conflict is crucial to predicting the discomfort that is likely to be associated with a given scene, filmed with a particular camera configuration, and then viewed from some distance on a display of some size. We first discuss the definition of units and then move on to discuss the zone of comfort expressed in a variety of units. We end with a set of guidelines that we hope will be useful to practitioners.
Specifying vergence distance
Different metrics are used to describe the vergence of the eyes. Prism diopter (Δ) describes the rotations of the eyes from parallel gaze; 1Δ displaces one eye’s gaze direction horizontally by 1 cm at a distance of 1 m. Thus,
| (4) |
where P is prism diopters, iod is interocular distance in centimeters, and d is distance in meters from the midpoint of the interocular axis to the stimulus. Practitioners often use the prism diopter because it is the power of the prism used to displace an eye’s image by a desired amount. It is also closely related to on-screen disparity in stereo imagery. A disadvantage of the prism diopter is that it depends on the observer’s interocular distance and is therefore not a direct measure of stimulus distance.
To eliminate the dependency on interocular distance, Nagel (1880) introduced the meter angle (MA):
| (5) |
where d is again distance from the midpoint of the interocular axis to the stimulus in meters. This is of course equivalent to diopters as used to represent focal distance, provided that the origin for the measurement of distance d is the same in both cases.
Thus, meter angle is a measure of stimulus distance, while prism diopter is a measure of the angle an eye must rotate to converge at a particular distance. The conversion from prism diopters to meter angles is
| (6) |
The abscissa of the ZCSBV is often plotted in prism diopters. Unfortunately, such a plot does not clearly convey the natural relationship between vergence and focal stimuli in the real world: Instead of one natural demand line with a slope of 1 as in Figure 17, the line is expressed as a family of demand lines, one for each interocular distance. We prefer to express vergence distance in meter angles or diopters because they facilitate comparison with focal distance. Regardless of one’s opinion, it would be useful to have agreement in the literature about how to express vergence distance.
The zone of comfort in various units
There are a wide variety of ways that one could represent the set of vergence and focal stimuli that are visually comfortable. Vision scientists and eye care professionals have traditionally represented the zone of comfort by plotting the vergence stimulus in prism diopters on the abscissa and the focal stimulus in diopters on the ordinate. For reasons stated above, we prefer to use diopters for both axes. Here, we examine other ways of plotting the zone of comfort. We then discuss the implications of the zone for different viewing situations.
Vergence and viewing distance in diopters
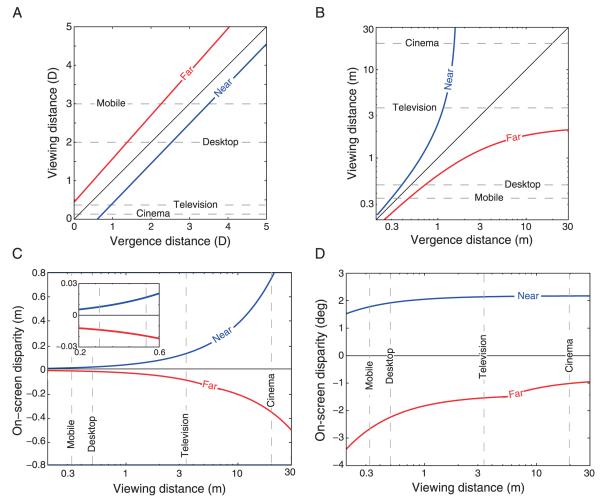
Figure 23A shows the estimate of the zone of comfort plotted in diopters. The equations for the far (negative conflict) and near (positive) boundaries are, respectively:
| (7) |
where Df is viewing distance in diopters, Dv is vergence distance in diopters, mfar and mnear are the slopes of the upper and lower lines, respectively, and Tfar and Tnear are the ordinate intercepts for the upper and lower lines, respectively (see Results section for the description on how the boundaries were estimated). The horizontal lines represent typical viewing distances for cinema (THX Certified Cinema Screen Placement, 2010), television (Ardito, 1994; Lund, 1993), desktop displays (Rempel, Willms, Anshel, Jaschinski, & Sheedy, 2007; Shin & Hedge, 2010), and mobile devices (user manual of LYNX 3D SH-03C, 2010).
Figure 23.
The zone of comfort in different units. (A) Comfort zone plotted in diopters. This is the same as Figure 17. The abscissa is the distance of the vergence stimulus and the ordinate is the viewing distance, which corresponds to the focal stimulus. The black diagonal line represents natural viewing (demand line). The red and blue lines represent estimates from our data of the far and near boundaries of the comfort zone, respectively. The parameters for lines are mnear = 1.035, Tnear = −0.626, mfar = 1.129, and Tfar = 0.442 (Equation 7). The dashed horizontal lines represent typical viewing distances for mobile devices, desktop displays, television, and cinema. (B) Comfort zone plotted in meters. The abscissa and ordinate are the distance of the vergence stimulus and the viewing distance (i.e., the focal stimulus), respectively. The abscissa and ordinate are plotted on log scales. The black diagonal line again represents the natural viewing line. The red and blue lines again represent the boundaries of the comfort zone. The dashed horizontal lines represent typical viewing distances for the same devices as in the previous panel. (C) Comfort zone plotted as on-screen disparity in meters as a function of viewing distance in meters. The abscissa is plotted on a log scale. The horizontal line represents the screen (where the disparity is zero). Positive disparities are crossed, specifying a stimulus nearer than the screen. Negative disparities have been adjusted upward slightly at long distance to reflect the fact that most viewers cannot diverge the eyes more than 1° beyond parallel; specifically, we set the maximum uncrossed disparity so that divergence would not exceed 0.85°. The vertical dashed lines represent distances for the same devices as before. The smaller plot in the upper left of this panel is a magnified view of the results at short distances; the dashed lines represent typical viewing distances for mobile devices and desktop displays. (D) Comfort zone plotted as disparity in degrees as a function of viewing distance in meters. The abscissa is plotted on a log scale. The break in the far boundary is a consequence of the adjustment described in (C). The vertical dashed lines represent distances for the same devices as before.
Vergence and viewing distance in meters
Figure 23B plots the zone with vergence distance and focal distance expressed in meters. The equations for the far and near boundaries are, respectively:
| (8) |
where df and dv are viewing and vergence distance in meters, respectively. This plot reveals that the range of comfortable disparity-specified distances expands greatly with increasing viewing distance. The black line again represents natural viewing. The horizontal lines again represent typical viewing distances for cinema, television, desktops, and mobile devices. It is evident from this figure that the range of simulated distances one can comfortably present is very dependent on viewing distance. In cinema, the range extends from 1.6 m to infinity. With a mobile device, the range extends from only 0.28 to 0.44 m. Thus, one cannot present long simulated distances comfortably on a small device viewed at a short distance.
On-screen disparity as a function of viewing distance
Figure 23C plots the zone in another manner. Here, the disparity on the screen is plotted as a function of viewing distance with both quantities expressed in meters. The equations for the on-screen disparities associated with the far and near boundaries are:
| (9) |
where s is the on-screen disparity in meters and i is the interocular separation in meters (assumed to be 0.063 m; Dodgson, 2004; French, 1921). The screen is represented by the horizontal line. The vertical lines again represent typical viewing distances. The far boundary has been adjusted to reflect the fact that most viewers cannot diverge the eyes more than 1° beyond parallel; specifically, we set the maximum uncrossed disparity so that divergence would not exceed 0.85° (this value is consistent with experience in cinematography; Higashi & Nakamizo, 2003 showed that most people can diverge more than this, but they did not assess discomfort). This method of plotting reveals that larger on-screen disparities can be presented at long than short viewing distances, particularly near (crossed) disparities.
Angular disparity as a function of viewing distance
Figure 23D plots the zone in yet another fashion. Here, disparity is expressed in angular units, while viewing distance is again expressed in meters. The equations for the angular disparities associated with the far and near boundaries are:
| (10) |
The break in the far boundary is due to the restriction for divergence to not exceed 0.85°. The vertical lines again represent typical viewing distances. This figure reveals that the range of angular disparities associated with comfortable viewing shrinks slightly with increasing viewing distance, particularly the range of far (uncrossed) disparities. The reader should recall, however, that a given range of angular disparities specifies a much larger range of distances at long than at short viewing distance.
We next consider some typical scenarios with respect to the zone of comfort.
Fixed display and content
In the first situation, the display size and on-screen disparities are fixed, and the viewer’s distance from the screen is varied. How should this affect visual discomfort? From Figure 23C, we observe that increasing viewing distance yields a progressively larger range of comfortable on-screen disparities, particularly in the near (crossed) direction. Thus, a given range of disparities in the displayed image should become more comfortable as the viewer moves farther from the display screen.
Magnified display and content
In the second situation, the content is created for a display of one size and ported to a display of a different size. For example, content created for cinema could be ported for viewing on a mobile device. The content must be minified (or magnified if ported from a small to large display) to fit the new display. Specifically, the size of the original image contents is multiplied by the ratio of the size of the new display divided by the size of the original display. How should this affect visual discomfort? In answering this question, let us first keep viewing distance constant. Minifying the images (cinema to mobile) decreases the on-screen disparity, so from Figure 23C, we observe that decreasing the size of the displayed image while keeping viewing distance constant should decrease visual discomfort. Similarly, magnifying the images (mobile to cinema) should increase discomfort. However, this situation is not practical because displays of different sizes are viewed from different distances. The viewer is more likely to adjust his/her distance so as to maintain a constant angular field of view. With such adjustments in viewing distance, the angular disparity remains constant as the content is minified or magnified. From Figure 23D, we observe that the range of comfortable angular disparities shrinks somewhat with increasing viewing distance. Thus, we predict that minifying content and viewing at close distance should yield slightly less visual discomfort and that magnifying content and viewing at far distance should yield slightly more discomfort. This effect is largely due to the inability to diverge the eyes comfortably.
The percentage rule in cinematography
Stereo cinematographers use rules for constructing content for comfortable viewing. From conversations with many of them, it is evident that there is no consensus on one quantitative rule. There is, however, a simple rule that is reasonably consistent with their practice: Crossed disparity (nearer than the screen) should not exceed 2–3% of the screen width and uncrossed disparity (farther) should not exceed 1–2% of screen width. We will call this the percentage rule. The rule applies to objects that the viewer might actually fixate and not to objects such as a blurred background that the viewer will not fixate. The percentage rule when applied to cinema takes into account the fact that audience members adopt a wide range of viewing distances. Here, we compare our results to the predictions of this rule. Even though the rule comes from cinema, we will also generalize it to viewing with smaller devices such as televisions and desktop displays. To do so, we will make the reasonable assumption that viewing distance is greater for large than for small display screens. We can quantify this in two ways.
We can assume that viewing distance is a constant proportion of screen width, or said another way, that the field of view is constant. The dashed thin red and blue curves in the left panel of Figure 24 represent the range of comfortable disparities that is consistent with the percentage rule for horizontal fields of view of 30 and 45°. To produce these fields of view, the viewer’s distance would be, respectively, 1.9 and 1.2 times screen width. We chose those fields of view because they are consistent with the guidelines for cinema (Allen, 2000; THX Certified Cinema Screen Placement, 2010).
We can use the data on people’s preferred distance when viewing television. Ardito (1994) and Lund (1993) presented video and still images on television and projection screens of various sizes. Their data are plotted in Figure 25, and they show that preferred viewing distance is mostly determined by screen size. We fit the data with d = 16.5(h0.71) (where d is viewing distance in centimeters and h is screen height in centimeters) and then generated the range of comfortable on-screen disparities as a function of viewing distance. The thick curves in the left and right panels of Figure 24 are the result. They differ from the dashed thin curves because people prefer to sit farther from small screens and closer to large screens than they would if they chose a distance that maintained a constant field of view.
Figure 24.
The percentage rule in stereo cinematography. In both panels, the range of comfortable on-screen disparities (in meters) is plotted as a function of viewing distance (in meters). To generate the thick curves in both panels, we calculated the near disparities that are 2.5% of screen width (the average of 2% and 3%) and the far disparities that are 1.5% of screen width (the average of 1% and 2%). Those curves represent the supposed comfortable range of disparities when the viewing distance is consistent with the data of Ardito (1994) and Lund (1993). The preferred distance in centimeters is given by d = 16.5(h0.71), where h is screen height in centimeters. The dashed thin curves in the left panel represent the largest comfortable disparities according to the percentage rule when the viewing distance is a constant proportion of the screen width. Starting near the black horizontal line, the red and blue curves represent the comfortable range when viewing distance is set by maintaining a horizontal field of view of 30° (distance equals 1.9 times screen width) and 45° (1.2 times screen width). Assuming a width-to-height aspect ratio of 16:9, these correspond, respectively, to viewing distances of 3.3 and 2.2 times screen height, respectively. The thin curves in the right panel represent the largest comfortable disparities according to the data from Experiments 1 and 2 (Figure 23C).
Figure 25.
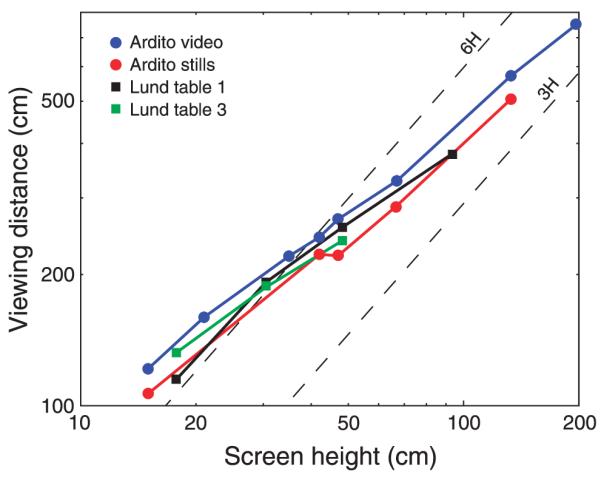
Preferred viewing distance with television. The distance from which people prefer to view television is plotted as a function of the height of the television screen. The data are from Ardito (1994) and Lund (1993). The dashed lines represent predicted preferred distances if viewers positioned themselves at distances of 3 or 6 times screen height. The data are well fitby d = 16.5(h0.71), where d is viewing distance in centimeters and h is screen height in centimeters.
With either assumption (i.e., constant field of view or television-based preferred distance), the ranges of comfortable disparities given by the percentage rule are similar and dissimilar to our discomfort data, which are the thin lines in the right panel of Figure 24 (see also Figure 23C). Our data imply a larger range for comfortable viewing than the percentage rule implies, but this difference is undoubtedly due to criterion differences, i.e., in the magnitude of discomfort that is assumed to be allowable in the two cases. However, our data also imply greater tolerance for near disparities relative to the percentage rule than for far disparities. We suggest that the percentage rule be modified to incorporate this asymmetry, i.e., that 3–4% be allowed for near disparities and 1–2% for far disparities. We conclude that the percentage rule, coupled with reasonable assumptions about viewing distance, is a fairly reasonable guideline for creating comfortable viewing, but it may require some modification.
Tangentially, it is interesting to note that television manufacturers recommend a viewing distance of three times screen height (for example, operation manuals for Panasonic TX-P50VT20B, Sharp LC-52LE925UN and LC-60LE925UN, Toshiba 46WX800U and 55WX800U, and Samsung UN40C7000, UN46C7000, and UN55C7000). If viewers followed that recommendation, the data in Figure 25 would lie on the line labeled 3H. Clearly, they tend to sit farther than that.
Is visual discomfort caused by motor or sensory phenomena?
A useful distinction is often made between motor and sensory aspects of vergence and accommodation. Motor aspects concern the responses themselves. For vergence, these are eye rotations in opposite directions. For accommodation, they are adjustments of the power of the crystalline lens. Sensory aspects concern the stimuli that drive these responses. For vergence, the sensory stimulus is binocular disparity. When a sufficiently large disparity is present, the stimulus looks double and vergence is triggered in an attempt to make it look single. For accommodation, the sensory stimulus is blur. When the eye’s defocus is sufficiently large, blur is noticeable, and accommodation is adjusted in an attempt to minimize the blur. There are also tolerance ranges for the sensory stimuli associated with vergence and accommodation. For vergence, a stimulus may have non-zero disparity but still be seen as single because it falls within Panum’s fusion area. For accommodation, a stimulus might be incorrectly focused but seen as sharp because it falls within the depth of focus of the visual system (Campbell, 1957).
We have assumed in this paper that conflicts in motor responses drive visual discomfort and fatigue. Said another way, we have assumed that if the visual system does not attempt to make a motor response when a vergence–accommodation conflict is present, no discomfort will ensue. This assumption is important for designing stereo displays and content. The producers of motion pictures and television create a region of interest in most scenes and that region is intended to attract the viewers’ fixation. This strategy is sensible if discomfort is caused only by the motor aspects of vergence and accommodation. However, if discomfort can also be caused by sensory conflicts, the strategy should be reconsidered. To our knowledge, the assumption that visual discomfort is caused by motor and not sensory aspects of the vergence– accommodation conflict has not been directly tested, so this is a candidate for future research.
Continuous zone of comfort
Previous descriptions of the zone of comfort are dichotomous: They describe one region of vergence– accommodation space as “comfortable” and everything outside of that region as “uncomfortable.” Such a description is certainly an over-simplification. Vergence– accommodation conflicts that are just outside the nominal comfort zone are surely less troublesome than conflicts that are way outside the zone. Furthermore, some conflicts within the nominal zone are surely less comfortable than others. To reflect those properties, it makes more sense to describe the zone of comfort as continuous.
We used the data from Experiments 1 and 2 to derive estimates of the amount of discomfort throughout the vergence–accommodation space. Admittedly, we had far too few data to estimate the average discomfort associated with all points in that space, but our crude approximation is nevertheless useful because it reveals some properties that are not manifest in conventional representations of the comfort zone. Figure 26 plots the zone of comfort in three dimensions, where the x, y, and z axes are, respectively, vergence distance, focal distance, and comfort. The method by which we derived this plot is described in the figure caption.
Figure 26.
Continuous zone of comfort. The variation in viewing comfort is plotted for different vergence and focal distances expressed in diopters. Grayscale values represent visual comfort with brighter values indicating more comfortable combinations of vergence and focal distance. We derived this figure from the across-subject average data of Experiments 1 and 2. We first assumed that the natural viewing line is the most comfortable, so the peak of comfort (maximum brightness) was on that line. Moving outward from the natural viewing line, we set the comfort value to half the maximum on the regression lines determined from the data of Experiments 1 and 2 (Figure 17). Therefore, the comfort value was the same along those two regression lines. The regression line is denoted by two thick white lines in the figure. The parameters for lines are mnear = 1.0352, Tnear = −0.6257, mfar = 1.1286, and Tfar = 0.4420 (Equation 7). The comfort value for other points in the space was determined from the horizontal distance from the natural viewing line. We assumed that comfort decreases linearly with distance from the demand line until reaching an asymptote. The thin white lines represent isocomfort contours.
The figure exhibits the main properties of the earlier dichotomous plots of the comfort zone (e.g., Figure 17): (1) The continuous zone is shifted toward positive conflicts (crossed disparity) at long distances and toward negative conflicts (uncrossed disparity) at short distances; (2) the continuous zone is narrower at long than at short distance; (3) the continuous zone is rotated slightly counterclockwise from the natural viewing or demand line of slope 1. Importantly, the figure adds information from our data that could not be represented in a dichotomous plot. (1) It shows that large conflicts are less comfortable than small ones, which was observed when we compared responses to 1.2-D conflicts in Experiment 1 to 0.8-D conflicts in Experiment 2; (2) it shows that viewing no-conflict stimuli is less comfortable at short than at long distance, a fact that is evident in Figure 9.
We should state some caveats. First, we had far too few data to actually determine the level of comfort for each position in this space. Brightness is monotonically related to the presumed level of comfort but is not necessarily proportional to it. Second, the visualization does not represent important differences between subjects. In our experiments, different subjects exhibited different levels of discomfort for given conflicts. Some of the between-subject variation is due to variation in phoria (Table 3) and there is good reason to believe that the phoria variation is partially determined by refractive error. Furthermore, there is good reason to believe that the comfort zone would vary with age (Yang et al., in press), but we only tested young adults so we did not demonstrate that in our experiments.
As more data are collected on what determines viewing comfort with stereo displays, we hope that this continuous representation of the zone of comfort can be better defined and used to express how comfort varies from one situation to another and from one group of people to another.
Guidelines for minimizing discomfort
Stereo display images can appear blurred or double because of the difference between the vergence and accommodative distances of the depicted objects. In attempting to resolve the vergence–accommodation conflict, the viewer can experience symptoms including eyestrain, blurry vision, eye tiredness, and headache. The display engineer and stereo content producer should understand the parameters of the conflict and then determine how best to minimize it and thereby increase viewing comfort.
Our data can be used to determine the likely discomfort associated with a given on-screen disparity for a young adult viewer at a particular distance. For example, near imagery is more comfortable than far imagery at long viewing distance, and far imagery is more comfortable than near imagery at short viewing distance. Such observations should be useful for display and content design.
The vergence–accommodation conflicts associated with viewing stereo displays occur in different fashion than the conflicts that occur in optometric/ophthalmic optical correction. Nonetheless, the two phenomena seem to be related, so some of the clinical literature is applicable to understanding visual discomfort with stereo displays.
Further work related to vergence–accommodation conflicts is required to establish guidelines for comfortable viewing as a function of the temporal properties of the conflict and the viewer’s age. In addition, other potential causes of discomfort such as flicker, motion judder, visual–vestibular conflicts, vertical vergence, and more need to be investigated.
Acknowledgments
This research was supported by a research grant from NIH (R01-EY12851), Grant-in-Aid for JSPS Fellows (08J09022), and Samsung SAIT. We thank Cliff Schor for help in setting up Experiment 3 and for discussions along the way; Jim Larimer and Simon Watt for very helpful comments on an earlier draft; and Bob Whitehill, Mark Vande Wettering, Kommer Kleijn, Phil McNally, Ethan Schur, and Bernard Mendiburu for advising us about practices in stereo cinematography.
Footnotes
Commercial relationships: none.
Contributor Information
Takashi Shibata, Vision Science Program, University of California, Berkeley, CA, USA, & Waseda University, Tokyo, Japan.
Joohwan Kim, Vision Science Program, University of California, Berkeley, CA, USA.
David M. Hoffman, Vision Science Program, University of California, Berkeley, CA, USA, & Media Tek, San Jose, CA, USA
Martin S. Banks, Vision Science Program, University of California, Berkeley, CA, USA
References
- Akeley K, Watt SJ, Girshick AR, Banks MS. A stereo display prototype with multiple focal distances. ACM Transactions on Graphics. 2004;23:804–813. [Google Scholar]
- Allen I. Screen size: The impact on picture and sound. Technical Report, Dolby Laboratories; 2000. [Google Scholar]
- Alvarez CP, Puell MC, Sánchez-Ramos C, Villena C. Normal values of distance heterophoria and fusional vergence ranges and effects of age. Graefe’s Archive for Clinical and Experimental Ophthalmology. 2006;244:821–824. doi: 10.1007/s00417-005-0166-5. [DOI] [PubMed] [Google Scholar]
- Ardito M. Studies of the influence of display size and picture brightness on the preferred viewing distance for HDTV programs. SMPTE Journal. 1994;103:517–522. [Google Scholar]
- Bereby-Meyer Y, Leiser D, Meyer J. Perception of artificial stereoscopic stimuli from an incorrect viewing point. Perception & Psychophysics. 1999;61:1555–1563. doi: 10.3758/bf03213117. [DOI] [PubMed] [Google Scholar]
- Berezin O. Digital cinema in Russia: Is 3D still a driver for the development of the cinema market?; Paper presented at the 3D Media 2010; 2010. statistic from kinopoisk.ru. [Google Scholar]
- Blavier A, Gaudissart Q, Cadiere GB, Nyssen AS. Impact of 2D and 3D vision on performance of novice subjects using Da Vinci robotic system. Acta Chirugica Belgica. 2006;106:662–664. doi: 10.1080/00015458.2006.11679976. [DOI] [PubMed] [Google Scholar]
- Campbell FW. The depth of field of the human eye. Journal of Modern Optics. 1957;4:157–164. [Google Scholar]
- Chan HM, Chung ACS, Yu SCH, Wells WM., III 2D–3D vascular registration between digital subtraction angiographic (DSA) and magnetic resonance angiographic (MRA) images. IEEE Biomedical Imaging: Nano to Macro. 2004;1:708–711. [Google Scholar]
- Cumming BG, Judge SJ. Disparity-induced and blur-induced convergence eye movement and accommodation in the monkey. Journal of Neuro-physiology. 1986;55:896–914. doi: 10.1152/jn.1986.55.5.896. [DOI] [PubMed] [Google Scholar]
- Dodgson NA. Variation and extrema of human interpupillary distance. SPIE: Stereoscopic Displays and Applications. 2004;5291:36–46. [Google Scholar]
- Donders FC. On the anomalies of accommodation and refraction. New Sydenham Society; London: 1864. p. 344. [Google Scholar]
- Edwards PJ, Johnson LG, Hawkes DJ, Fenlon MR, Strong AJ, Gleeson MJ. Clinical experience and perception in stereo augmented reality surgical navigation. Lecture Notes in Computer Science. 2004;3150:369–376. [Google Scholar]
- Emoto M, Niida T, Okano F. Repeated vergence adaptation causes the decline of visual functions in watching stereoscopic television. Journal of Display Technology. 2005;1:328–340. [Google Scholar]
- Fincham EF, Walton J. The reciprocal actions of accommodation and convergence. The Journal of Physiology. 1957;137:488–508. doi: 10.1113/jphysiol.1957.sp005829. [DOI] [PMC free article] [PubMed] [Google Scholar]
- French JW. The interocular distance. Transactions of the Optical Society. 1921;23:44–55. [Google Scholar]
- Fröhlich B, Barrass S, Zehner B, Plate J, Gobel M. Exploring geo-scientific data in virtual environments. Proceedings of IEEE: Visualization. 1999;99:169–173. [Google Scholar]
- Fry G. Further experiments on the accommodative convergence relationship. American Journal of Optometry. 1939;16:325–334. [Google Scholar]
- Getty DJ, D’Orsi CJ, Pickett RM. Stereoscopic digital mammography: Improved accuracy of lesion detection in breast cancer screening. Lecture Notes in Computer Science. 2008;5116:74–79. [Google Scholar]
- Häkkinen J, Pölönen M, Takatalo J, Nyman G. Simulator sickness in virtual display gaming: A comparison of stereoscopic and non-stereoscopic situations. Proceedings of the 8th Conference on Human-Computer Interaction with Mobile Devices and Services.2006. pp. 227–230. [Google Scholar]
- Halbfinger DM. [Retrieved March 13];With theaters barely digital, studios push 3-D. New York Times. 2008 [Google Scholar]
- Higashi T, Nakamizo S. Perceived depth and direction as a function of ocular vergence. Japanese Journal of Psychonomic Science. 2003;21:103–111. [Google Scholar]
- Hillis JM, Banks MS. Are corresponding points fixed? Vision Research. 2001;41:2457–2473. doi: 10.1016/s0042-6989(01)00137-7. [DOI] [PubMed] [Google Scholar]
- Hirsch MJ, Alpern M, Schultz HL. The variation of phoria with age. American Journal of Optometry. 1948;25:535–541. doi: 10.1097/00006324-194811000-00010. [DOI] [PubMed] [Google Scholar]
- Hoffman DM, Girshick AR, Akeley K, Banks MS. Vergence–accommodation conflicts hinder visual performance and cause visual fatigue. Journal of Vision. 2008;8(3):33, 1–30. doi: 10.1167/8.3.33. http://www.journalofvision.org/content/8/3/33, doi:10.1167/8.3.33. [PubMed] [Article] [DOI] [PMC free article] [PubMed] [Google Scholar]
- Hofstetter HW. The zone of clear single binocular vision. American Journal of Optometry and Physiological Optics. 1945;22:301–333. 361–384. doi: 10.1097/00006324-198112000-00021. [DOI] [PubMed] [Google Scholar]
- Howard IP, Rogers BJ. Seeing in depth. University of Toronto Press; Toronto, ON, Canada: 2002. [Google Scholar]
- Howarth PA. Potential hazards of viewing 3-D stereoscopic television, cinema, and computer games: A review. Ophthalmic and Physiological Optics. 2011;31:111–122. doi: 10.1111/j.1475-1313.2011.00822.x. [DOI] [PubMed] [Google Scholar]
- Howarth PA, Costello PJ. The occurrence of virtual simulation sickness symptoms when an HMD was used as a personal viewing system. Displays. 1997;18:107–116. [Google Scholar]
- Jin ZX, Zhang YJ, Wang X, Plocher T. Evaluating the usability of an auto-stereoscopic display. Lecture Notes in Computer Science. 2007;4551:605. [Google Scholar]
- Kooi FL, Toet A. Visual comfort of binocular and 3D displays. Displays. 2004;25:99–108. [Google Scholar]
- Krishnan VV, Shirachi D, Stark L. Dynamic measures of vergence accommodation. American Journal of Optometry and Physiological Optics. 1977;54:470–473. doi: 10.1097/00006324-197707000-00007. [DOI] [PubMed] [Google Scholar]
- Lambooij M, IJsselsteijn W, Fortuin M, Heynderickx I. Visual discomfort and visual fatigue of stereoscopic displays: A review. Journal of Imaging Science and Technology. 2009;53:1–14. [Google Scholar]
- Leone JF, Cornell E, Morgan IG, Mitchell P, Kifley A, Wang JJ, et al. Prevalence of heterophoria and associations with refractive error, heterotropia and ethnicity in Australian school children. British Journal of Ophthalmology. 2010;94:542–546. doi: 10.1136/bjo.2009.163709. [DOI] [PubMed] [Google Scholar]
- Love GD, Hoffman DM, Hands PJW, Gao J, Kirby AK, Banks MS. High-speed switchable lens enables the development of a volu-metric stereoscopic display. Optics Express. 2009;17:15716–15725. doi: 10.1364/OE.17.015716. [DOI] [PMC free article] [PubMed] [Google Scholar]
- Lund AM. The influence of video image size and resolution on viewing-distance preferences. SMPTE Journal. 1993;102:406–415. [Google Scholar]
- Martens TG, Ogle KN. Observations on accommodative convergence—Especially its nonlinear relationships. American Journal of Ophthalmology. 1959;47:455–463. [PubMed] [Google Scholar]
- Mendiburu B. 3D movie making: Stereoscopic digital cinema from script to screen. Focal Press, Elsevier; Oxford, UK: 2009. [Google Scholar]
- Menozzi M. Visual ergonomics of head-mounted displays. Japanese Psychological Research. 2000;42:213–221. [Google Scholar]
- Morgan MW. The clinical aspects of accommodation and convergence. American Journal of Optometry & Archives of American Academy of Optometry. 1944;21:301–314. [Google Scholar]
- Nagel A. Die Anomalien der Refraktion und Akkommodation. Gräfe-Sämisch Handbuch der Gesamten Augenheilkunde. 1880;6:257–503. [Google Scholar]
- Percival AS. The relation of convergence to accommodation and its practical bearing. Ophthalmo-logical Review. 1892;11:313–328. [Google Scholar]
- Rempel D, Willms K, Anshel J, Jaschinski W, Sheedy J. The effects of visual display distance on eye accommodation, head posture, and vision and neck symptoms. Human Factors. 2007;49:830–838. doi: 10.1518/001872007X230208. [DOI] [PubMed] [Google Scholar]
- Saladin JJ, Sheedy JE. Population study of fixation disparity, heterophoria, and vergence. American Journal of Optometry & Physiological Optics. 1978;55:744–750. doi: 10.1097/00006324-197811000-00002. [DOI] [PubMed] [Google Scholar]
- Scheiman M, Wick B. Clinical management of binocular vision: Heterophoric, accommodative, and eye movement disorders. J. B. Lippincott; Philadelphia: 1994. [Google Scholar]
- Semmlow J, Wetzel P. Dynamic contributions of the components of binocular vergence. Journal of the Optical Society of America. 1979;69:639–645. doi: 10.1364/josa.69.000639. [DOI] [PubMed] [Google Scholar]
- Sheard C. The prescription of prisms. American Journal of Optometry. 1934;11:364–378. [Google Scholar]
- Sheedy JE, Saladin JJ. Phoria, vergence, and fixation disparity in oculomotor problems. American Journal of Optometry and Physiological Optics. 1977;54:474–478. doi: 10.1097/00006324-197707000-00008. [DOI] [PubMed] [Google Scholar]
- Shin G, Hedge S. User-preferred position of computer displays: Effects of display size. Human Factors. 2010;52:1–12. doi: 10.1177/0018720810380405. [DOI] [PubMed] [Google Scholar]
- Tait EF. Accommodative convergence. American Journal of Ophthalmology. 1951;34:1093–1107. doi: 10.1016/0002-9394(51)90683-6. [DOI] [PubMed] [Google Scholar]
- THX Certified Cinema Screen Placement 2010 http://www.thx.com/professional/cinema-certification/thx-certified-cinema-screen-placement/
- Ukai K. Visual fatigue caused by viewing stereoscopic images and mechanism of accommodation. Proceedings of the First International Symposium on University Communication.2007. pp. 176–179. [Google Scholar]
- Ukai K, Howarth PA. Visual fatigue caused by viewing stereoscopic motion images: Background, theories, and observations. Displays. 2008;29:106–116. [Google Scholar]
- Vishwanath D, Girshick AR, Banks MS. Why pictures look right when viewed from the wrong place. Nature Neuroscience. 2005;8:1401–1410. doi: 10.1038/nn1553. [DOI] [PMC free article] [PubMed] [Google Scholar]
- Wann JP, Mon-Williams M. Health issues with virtual reality displays: What we do know and what we don’t. ACM SIGGRAPH Computer Graphics. 1997;31:53–57. [Google Scholar]
- Wann JP, Mon-Williams M. Measurement of visual aftereffects following virtual environment exposure. In: Stanney KM, editor. Handbook of virtual environments: Design, implementation, and applications. Lawrence Erlbaum Associates; London, UK: 2002. [Google Scholar]
- Ware C, Franck G. Evaluating stereo and motion cues for visualizing information nets in three dimensions. ACM Transactions on Graphics. 1996;15:121–139. [Google Scholar]
- Yamazaki T, Kamijo K, Fukuzumi S. Quantitative evaluation of visual fatigue encountered in viewing stereoscopic 3 D displays: Near-point distance and visual evoked potential study. Proceedings of the Society for Information Display. 1990;31:245–247. [Google Scholar]
- Yang S, Schlieski T, Selmins B, Cooper S, Doherty R, Corriveau PJ, et al. Individual differences and seating position affect immersion and symptoms in stereoscopic 3D viewing. Optometry and Vision Science. doi: 10.1097/OPX.0b013e31825da430. (in press) [DOI] [PubMed] [Google Scholar]
- Yano S, Emoto M, Mitsuhashi T. Two factors in visual fatigue caused by stereoscopic HDTV images. Displays. 2004;25:141–150. [Google Scholar]
- Yano S, Ide S, Mitsuhashi T, Thwaites H. A study of visual fatigue and visual comfort for 3D HDTV/HDTV images. Displays. 2002;23:191–201. [Google Scholar]


