Abstract
The dose for image-based motion monitoring of prostate tumours during radiotherapy delivery has not been established. This study aimed to provide quantitative analysis and optimisation of the fluoroscopic patient imaging dose during radiotherapy for IMRT and VMAT treatments using standard and hypofractionated treatment schedules.
Twenty-two patients with type T1c N0/M0 prostate cancer and three implanted fiducial markers were considered. Minimum field sizes encompassing all fiducial markers plus a 7.5mm motion margin were determined for each treatment beam, each patient and the complete cohort. Imaging doses were measured for different field sizes and depths in a phantom at 75kV and 120kV. Based on these measurements, the patient imaging doses were then estimated according to beam-on time for clinical settings.
The population minimum field size was 5.3 × 6.1cm2, yielding doses of 406mGy and 185mGy over the course of an IMRT treatment for 75kV (10 mAs) and 120kV (1.04 mAs) imaging, respectively at 1Hz. The imaging dose was reduced by an average of 28% and 32% by adopting patient specific and treatment-beam specific field sizes respectively. Standard fractionation VMAT imaging doses were 37% lower than IMRT doses over a complete treatment. Hypofractionated IMRT SBRT and VMAT SBRT imaging doses were 58% and 76% lower than IMRT doses respectively.
The patient dose for kilovoltage intrafraction monitoring of the prostate was quantified. Tailoring imaging field sizes to specific patients yielded a significant reduction in the imaging dose, as did adoption of faster treatment modalities such as VMAT.
Keywords: kilovoltage dose, intrafraction motion, prostate motion
1. Introduction
Intrafraction prostate motion during radiotherapy can be considerable (Kupelian et al., 2007; Langen et al., 2008) and can compromise treatment accuracy (Kupelian et al., 2007; de Crevoisier et al., 2005). Other studies have demonstrated negligible reduction to the prostate dose from intrafraction motion (Adamson et al., 2011), however it is hard to ignore the large random and unpredicted intrafraction motion reported particularly in the era of five fraction SBRT. The treatment accuracy can be improved using intrafraction monitoring, which involves monitoring the position of the tumour (or tumour surrogate) using modalities, such as frequent planar x-ray snapshots (Poulsen et al., 2009; Shimizu et al., 2000), radiofrequency reflecting fiducials (Langen et al., 2008), gamma emitting fiducials (Shchory et al., 2010) or ultrasound detection (Langen et al., 2003). Intrafraction motion can then be managed by tracking of the tumour or an appropriate surrogate with a dynamic multileaf collimator (dMLC) (Poulsen et al., 2010), continuous couch corrections (D’Souza et al., 2005) or gating the beam when some tolerance is exceeded (Zhang et al., 2011). Other methods, like daily insertion of endorectal balloons have shown large reductions to the magnitude of prostate intrafraction motion (Smeenk RJ, 2011) without adding imaging dose but are invasive and could be time consuming.
The clinical scenario investigated here is using the gantry-mounted x-ray system to perform prostate position monitoring during treatment. Though promising geometric and dosimetric accuracy results have been found using this method (Poulsen et al., 2010), the imaging dose required to monitor the tumour position has not been quantified and may be considerable due to the required frequency of imaging. In this study, we estimated the imaging dose for kV x-ray intrafraction tumour position monitoring during radiotherapy delivery with varying parameters of beam quality, imaging frequency and field size for two delivery types: (1) IMRT and (2) VMAT; and two treatment schedules: (1) conventional fractionation and (2) stereotactic body radiotherapy (SBRT).
2. Method
A framework for determining and optimising patient imaging dose based on phantom measurements linked to patient cases was established. Dose measurements for fluoroscopic planar x-ray imaging were carried out in a tissue equivalent pelvic phantom using a Varian (Palo Alto, CA) Trilogy and On-Board Imager (OBI v1.5). The measured doses were used to estimate imaging dose during standard fractionation IMRT, standard fractionation VMAT, hypofractionated IMRT and hypofractionated VMAT SBRT to a cohort of patients previously treated at the Northern Sydney Cancer Centre.
2.1 Patient Selection and Imaging Field Size Determination
Patients commencing treatment between 8/12/2009 and 5/1/2011 were selected. All patients had type T1c N0/M0 prostate cancer, approved IMRT 7- or 9-field treatment plans and three implanted prostatic fiducial markers. For each patient, the dimensions and volume of the prostate, co-ordinates of the fiducial markers, and focus to skin distance (FSD) for each imaging field perpendicular to the corresponding treatment beam were established from patient data on the Varian Eclipse™ treatment planning system (v8.9.14).
From the locations of the fiducial markers and orientation of the treatment beams, the minimum imaging field size to encompass all fiducials in each field projection, including a 7.5mm margin based on possible magnitude of intrafraction prostate motion (Shah et al., 2011), was calculated for three different scenarios: (1) a population minimum field size: the smallest field dimension encompassing all fiducials for all patients (including the margin) for any beam projection; (2) a per-patient minimum field size: the smallest field dimension encompassing all fiducials for any beam projection for each patient; and (3) a per-beam minimum field size: the smallest field dimension encompassing all fiducials for each imaging field perpendicular to its corresponding treatment beam.
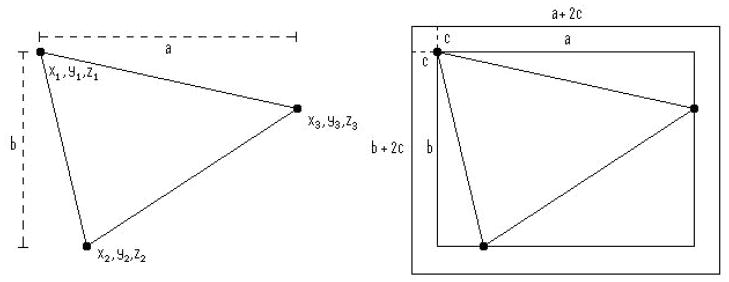
To convert the fiducial coordinates from room coordinates to their 2D projection onto the imaging plate, we considered the three fiducial markers of each patient, with Cartesian room coordinates Fn = xn, yn, zn where x, y, and z were the coordinates of fiducial marker n in the Eclipse™ software, corresponding to lateral (left-right), coronal (anterior-posterior) and axial (up-down) locations respectively. The smallest rectangular field containing all 3 fiducials for each of the three scenarios was a field I = (a, b) where a and b were the horizontal and vertical dimensions of the imaging field projected onto the imaging plate respectively. In order to accommodate intrafraction motion, a margin c (=7.5 mm) was added to each dimension of the field in each case. This is indicated in figure 1.
Figure 1.
2-dimensional diagrammatic representation of imaging parameters a, b, c in relation to fiducial coordinates.
For each patient p, the dimensions of the patient minimum field size Ip = (ap+ 2c, bp + 2c) are:
| (1) |
ap is the maximum horizontal separation of the fiducials on the imaging plate for any gantry angle, dependant on both x and y.
| (2) |
For each field f, the dimensions of the beam minimum field size If = (af+ 2c, bf + 2c) are:
| (3) |
where (xn, yn) is the projection of (xn, yn) onto the imaging field for a given gantry angle, and
| (4) |
The vertical dimension of the b imaging field is orthogonal to and independent of gantry angle, and therefore constant for all beam minimum imaging fields for each patient.
The dimensions of the population minimum field size Ig = (ag+ 2c, bg + 2c) are
| (5) |
| (6) |
2.2 Field Size and Absolute Dose Calibration
An absolute dose calibration was carried out according to the IPEMB protocol (Klevenhagen et al., 1996; Aukett et al., 2005) for kilovoltage dosimetry for beam energies of 75kV and 120kV. These kV settings represented likely minimum and maximum values for prostate fiducial registration based on preset imaging parameters for AP pelvis and large lateral pelvis with the Varian OBI software. The kV field size was verified for 2×2cm2, 5×5cm2, and 10×10cm2 with a field size template.
2.3 CIRS Phantom Measurements
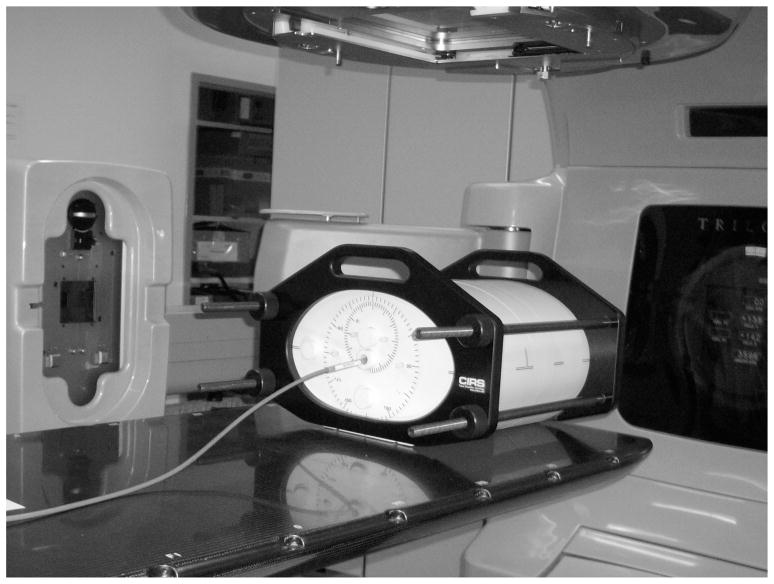
Dose to phantom was measured at different depths, field sizes and beam qualities to establish generic relationships for depth dose and field size for use in patient dose estimation. A homogeneous CIRS (CIRS Inc, Norfolk, VA) phantom (Model 002H9K) was employed as shown in figure 2.
Figure 2.
Lateral irradiation setup of the CIRS phantom, with the ion chamber in phantom.
Measurements in phantom were carried out at 75kV with 10mAs and 120kV with 12.6mAs using an IBA (Schwarzenbruck Germany) FC23-C 0.2cc ion chamber using Nk transferred from the local reference chamber. The centre of the collection volume of the ion chamber was aligned to isocentre through kV orthogonal imaging. Dose per frame was determined through a series of measurements at different depths between 7cm and 15cm (for AP and lateral orientations to check for differences) and for square fields of 2×2cm2 to 10×10cm2, simulating different locations of the prostate and different imaging fields.
2.4 Patient Dose Calculation
The dose per imaging frame for the calculated imaging field sizes was estimated for each patient based on the generic relationships for depth and field size derived from the CIRS phantom data. An equivalent square approximation was employed to simplify the dose calculation of the rectangular imaging fields to square fields of side length . Note that measurements were taken with 120kV/12.6 mAs to improve the detector signal to noise ratio, however the reported patient results are scaled by 1.04/12.6 to match the clinical acquisition settings.
The dose per frame at depth was calculated according to equation (7);
| (7) |
where Dw,z=0 is the absolute dose at the surface (based on the IPEMB protocol), FS(σ) is the field size factor at equivalent square field side length σ, and DD(FSD) is the depth dose factor for the beam FSD for a 10×10cm2 field size. All patients were planned isocentrically, with isocentre placed at the approximate centre of mass of the 3 fiducials.
The imaging doses for IMRT were calculated by multiplication of dose from a single imaging frame by the frequency of imaging and the duration of the beam-on time for each treatment field, with an additional 20 second pre-treatment arc at the start of the treatment (required to establish an initial probability distribution function (PDF) (Poulsen et al., 2009)) and multiplied by the number of fractions for an IMRT treatment as per table 1. The imaging doses for standard VMAT and VMAT SBRT (38Gy in 5 fractions (King, 2011)) treatments were calculated by averaging the doses from each of the IMRT treatment fields and multiplying them by the duration of treatment (also with an additional 20 seconds pre-treatment imaging time) and multiplying by the relevant number of fractions (table 1). Treatment time per fraction is taken from the literature (Oliver et al., 2009) and includes an additional 20 second pre-treatment arc. This method is based upon the assumption that, as the treatment fields for IMRT are approximately evenly spaced around the patient, their average represents a good approximation of the dose from a constantly rotating gantry.
Table 1.
Treatment times and number of fractions for IMRT, VMAT, IMRT SBRT, and VMAT SBRT.
| Treatment Modality | Treatment Time per Fraction (s) | Number of Fractions | Total Treatment Time (min) |
|---|---|---|---|
| IMRT | 320 | 40 | 213.3 |
| VMAT | 200 | 40 | 133.3 |
| IMRT SBRT | 920 | 5 | 76.7 |
| VMAT SBRT | 620 | 5 | 51.7 |
3. Results
3.1 Patient Cohort Data
A total of 22 patients fulfilled the selection criteria. The patients selected had a median prostate volume of 49.3cm3, range (23.4cm3–224.5cm3), and median prostate dimensions 4.4cm × 5.0cm × 4.1cm. The median FSDs of the imaging fields were 84.7cm, corresponding to a median PTV depth of 15.3cm.
Based on the calculations of a and b in each of the three scenarios of imaging field size, the required minimum imaging fields Ig, If, and Ip were calculated for patient specific and treatment beam specific fields.
The calculated field sizes for each scenario are summarised in table 2 (based upon equivalent squares).
Table 2.
Field sizes for each scenario: population minimum field size, patient minimum field size, and beam minimum field size. A 15mm margin has been added to all dimensions to allow for up to 7.5mm of intrafraction motion in any one direction.
| FS type | Median (cm2) | Min (cm2) | Max (cm2) |
|---|---|---|---|
| Population (Ig) | 5.3 × 6.1 | ||
| Per Patient (Ip) | 3.7 × 3.2 | 4.7 × 1.6 | 5.3 × 6.1 |
| Per Beam (Ib) | 3.5 × 2.7 | 2.2 × 1.8 | 5.3 × 6.1 |
3.2 CIRS Phantom Measurements
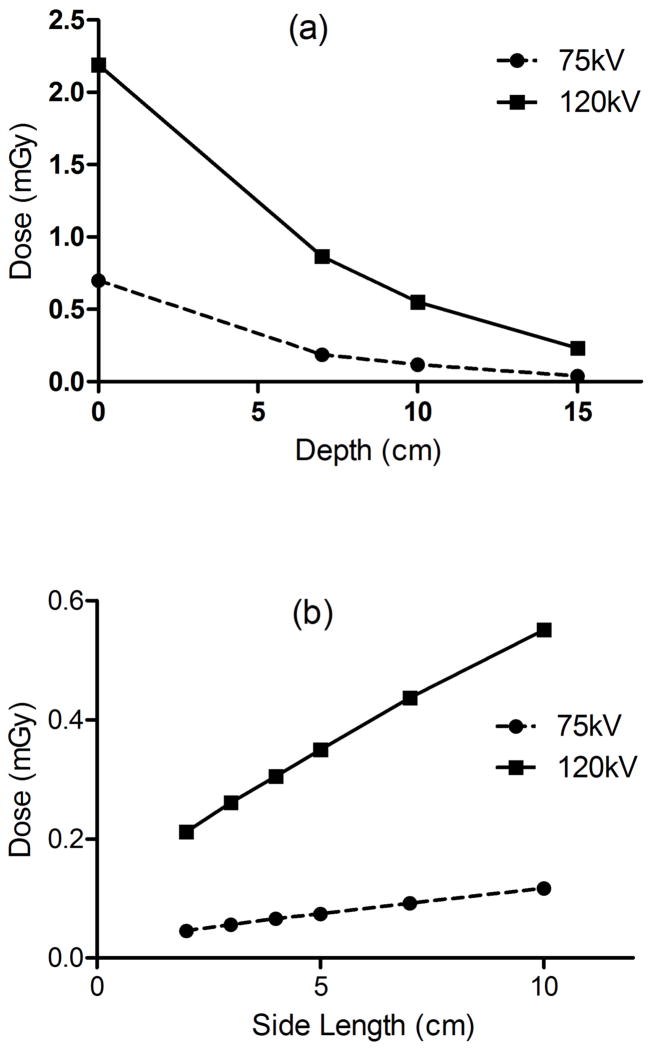
The depth dose curves for 10×10cm2 field size at 75kV and 120kV, and 100cm FSD are shown in figure 3.
Figure 3.
(a) Depth dose relationship as compared to absolute surface dose calibration for 10×10cm2. (b) Field size dependence, for 10cm and 15cm depth at 120kV/12.6mAs and 75kV/10mAs for a single projection.
Measurements were identical when conducted under lateral phantom geometry as opposed to AP orientation.
3.3 Patient Dose Estimation
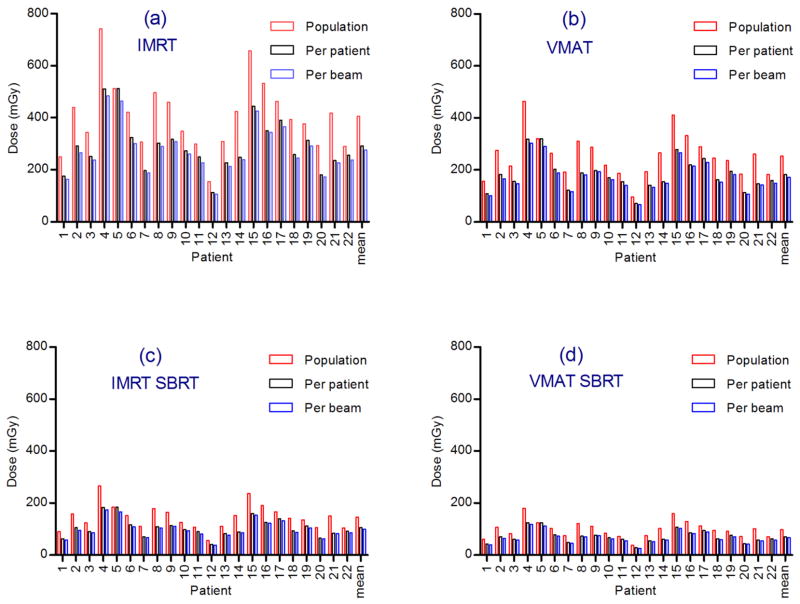
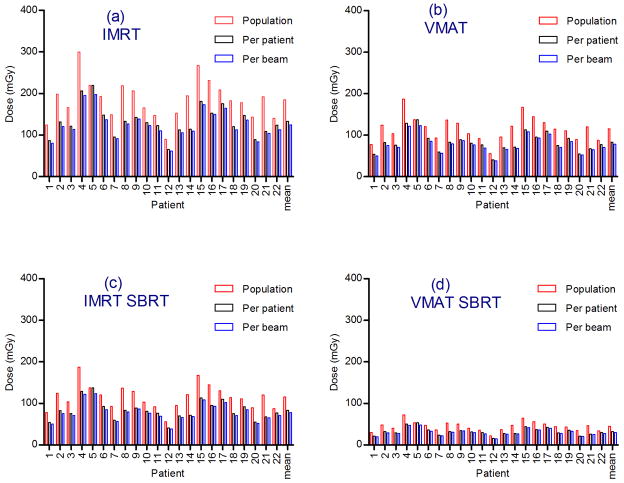
The dose per frame was calculated for each patient and each imaging field size scenario: population minimum field size, per-patient minimum field size and per-beam minimum field size, based on equation (7). The total imaging dose over a treatment schedule was then calculated for each patient based on the treatment times outlined in table 1. The frequency of image acquisition in all cases was 1 per second. The resulting imaging doses for 75kV and 10 mAs are plotted in figure 4 and for 120kV and 1.04 mAs in figure 5.
Figure 4.
One Hz imaging doses at 75kV at 10mAs for each patient and mean dose. Total dose for course of treatment for (a) IMRT (b) VMAT (c) IMRT SBRT and (d) VMAT SBRT.
Figure 5.
One Hz imaging doses at 120kV at 1.04mAs for each patient and mean dose. Total dose for course of treatment for (a) IMRT (b) VMAT (c) IMRT SBRT and (d) VMAT SBRT.
VMAT imaging doses were on average 37% lower than IMRT imaging doses due to the shorter treatment time per fraction. SBRT imaging doses were on average 70% lower than standard fractionation doses.
On average, the adoption of a per-patient minimum field size reduced the imaging dose by 28%, compared to a uniform population minimum field size. The adoption of a per-beam field size yielded a 7% reduction over the per-patient field size approach, or a 32% reduction over the population minimum field size, for both 75kV and 120kV imaging.
Calculations for an increased margin demonstrated that the impact of increasing the margin from 7.5mm to 15mm is an average increase in imaging dose of approximately 19.9%.
As an indication of imaging dose magnitude relative to total treatment dose (80Gy for standard fractionation IMRT and VMAT and 38Gy for SBRT), the overall imaging doses were 0.5% of the treatment doses for 75kV/10mAs and 0.1–0.25% for 120kV/1.04mAs for the range of situations considered.
The impact of imaging frame rate throughout each fraction on imaging dose was a simple linear increase, as doses were proportional to the number of imaging frames.
4. Discussion
Imaging doses for kV x-ray intrafraction tumour position monitoring of the prostate during delivery of standard fractionation IMRT and VMAT, as well as hypofractionated IMRT and VMAT SBRT treatments were investigated.
Per-patient field sizes were on average significantly reduced from the population minimum field size of 5.3×6.1cm2 to a median of 3.7×3.2cm2. This significantly reduced the imaging dose to the PTV by a mean of 28.0%. The effect on dose from adopting a per-beam field size was not as significant, with a 32.5% reduction in imaging dose from the population minimum field size (7% reduction from per-patient field sizes). Per-patient field sizes could be easily adopted in a practical setting by evaluation during the treatment planning phase. Per-beam field sizes could be practically applicable to VMAT cases, despite the constantly rotating gantry due to the development of dynamic kV collimators for use in real-time motion tracking during radiation therapy (Wiersma et al., 2009). Due to the small size of the fields in question, doses were confined to the region of the PTV, with minimal primary beam imaging dose deposition to OARs surrounding the prostate.
The applied margin of 7.5mm was based on the likelihood of prostate motion being large enough to move the fiducial markers out of detection range, requiring action by the operator eg ‘gating’ the beam. Previously, a margin of 15mm has been employed as the largest possible magnitude of motion over the course of a single treatment (Kupelian et al., 2007). However, recent findings suggest that the magnitude of prostate displacement is greater than 5mm only 2.9% of the time in the supine position (Shah et al., 2011). Therefore, a ‘safe’ value of 7.5mm was employed, since doubling the margin to 15mm was calculated resulting in an average 19.9% increase in imaging dose.
The population minimum field size with an applied 7.5mm margin (5.3×6.1cm2) was substantially smaller than the large field planar x-ray images commonly used in standard pre-treatment setup verification and diagnostic imaging. Reducing the imaging field size limits the dose coverage to the PTV, and therefore limits dose to surrounding OARs.
The skin dose from monitoring intrafraction motion with kV imaging was not expected to be large, based on the quantity of individual treatment beams in IMRT and constantly rotating gantry in VMAT treatments, allowing a constantly changing area of irradiation.
Monte Carlo studies (Ding et al., 2008) reveal CBCT dose to be fairly evenly distributed for scans of the pelvis, suggesting that the point dose measured in the CIRS phantom is indicative of patient prostate dose. The imaging dose distribution is expected to possess uniform dose localised in the PTV with fairly sharp falloff outside. The diameter of such a ‘cylindrical’ dose volume is determined by the field size chosen. Peripherally to the prostate, the imaging dose to OAR from kV intrafraction motion monitoring can be estimated, by the proportion of the imaging arc projecting through the point of interest, to be approximately 1/8th of the central imaging dose. Considering the range of imaging in this study is 0.1–0.5% of the prescription dose, the OAR doses would be 0.02–0.1% of the prescription.
The imaging doses reported in this study demonstrate that kV intrafraction motion monitoring can be performed at low cost and suggest that large geometric misses can be avoided and, given its high accuracy, small magnitudes of motion might be corrected.
It might be desirable to include the imaging dose over the course of a treatment in treatment planning. The issue is complex, however, since the quality of x-rays has an impact on their effect on different tissues in the human body and commercial treatment planning dose algorithms might not be accurate at these energies. Traditionally, a radiobiological weighting factor of 1 has been applied to x-rays of all energies for protection purposes. For very low energy x-rays, such as those used in mammography (29kVp), α/β ratios substantially higher than unity (~2+/−0.6) have been quoted as compared to 220kV (Goggelmann et al., 2003). Energies in the range of those used in this study were quoted as 1.13 and 1.19 for 100kV and 70kV respectively, as compared to 60Co at 1.25MeV (Winzel et al., 1987; Bistrovic et al., 1986). More accurate studies of relative biological effectiveness will allow legitimate inclusion of kV imaging dose in treatment planning.
Due to the small range of the generated electrons at the low beam energies used, non-local changes in the irradiation geometry did not significantly affect the dose, as illustrated by the identical results for AP and lateral CIRS phantom measurements under identical conditions. The inhomogeneity of patients has an impact on the dose deposition characteristics of the beam. For instance, the presence of bony anatomy in the path of the beam (such as the head of the femur) results in a reduction in dose to structures behind the bone. This dose reduction effect was not taken into account, and the calculated values represent the maximum likely dose to the irradiated area.
The VMAT doses were assumed to be the average of the individual doses of the IMRT fields multiplied by the treatment duration. The imaging dose for any modality over the course of a treatment schedule for a given kV/mAs/field size setting was proportional to the frame rate of imaging and the total treatment time. The decreased treatment time for standard fractionation VMAT treatments ensured a reduced imaging dose as compared to IMRT (37%) under identical settings. Due to the reduced total dose delivered (and consequent reduced total treatment time) for hypofractionated IMRT and VMAT SBRT treatments as compared to standard fractionation schedules, there were further considerable reductions in imaging dose over the course of a treatment, as compared to standard fractionation IMRT (64% and 76% for IMRT SBRT and VMAT SBRT respectively).
One Hertz has been established as sufficient imaging frequency for an adequate RMS error (0.2mm) with the kV x-ray intrafraction tumour position monitoring method (Poulsen et al., 2009). The imaging doses reported have been defined for specific mAs, frequency and treatment duration. The dose per frame scaled linearly with each of these parameters. Therefore, the dose for arbitrary mAs settings, frame rates and treatment times may be calculated by modifying these results.
Comparison of imaging dose as a fraction of total treatment dose revealed a maximum fraction of 0.5% (75kV, IMRT, population minimum field size). This fraction was reduced by restricting the field size, kV and mAs settings; and reducing the duration of treatment by altering the treatment modality as outlined above.
Stereoscopic imaging methods such as the BrainLAB ExacTrac system have quoted a 0.5mSv dose per image taken (Linthout et al., 2007). This method has been reported predominantly for pre-treatment imaging to align the patient for treatment. If used fluoroscopically, stereoscopic imaging will generally have an increased dose as compared to monoscopic techniques. Another method might involve use of a kV imager coupled with a portal MV imager. This technique would be expected to deliver identical dose to single kV imager tracking, however the MLC motion may obscure the fiducials in some circumstances, reducing the tracking reliability. The frame rate of the MV imager is also limited, restricting the accuracy of the tracking procedure (Liu et al., 2008).
According to CBCT dose calculations for the Varian OBI (Hyer et al., 2009), prostate dose for a pelvic CBCT scan was 27.3mGy. If one were performed before every fraction for an IMRT treatment, this would correspond to 1093mGy, as compared to the measured mean dose per fraction of 406mGy for 75kV, 10mAs imaging for IMRT, conducted in this study.
This method of imaging dose calculation for kV x-ray intrafraction tumour position monitoring should be applicable to generic cine-kV tracking procedures, such as kV/kV imaging, and for any tumour location in the body for which an adequate surrogate (or anatomical landmarks) can be established.
Reducing the imaging frame rate, as well as minimising the beam quality while maintaining adequate fiducial registration may reduce imaging dose and should be investigated.
5. Conclusion
Kilovoltage fluoroscopic imaging dose in the context of real-time fiducial tracking in prostate radiotherapy was investigated through the construction of an imaging dose framework based on an imaging field size minimisation procedure. The imaging dose was demonstrated to be a small proportion of the total treatment dose, for both IMRT and VMAT for standard fractionation and SBRT treatments. By limiting the field size to the region of the fiducial markers, the imaging dose to the prostate and OARs surrounding the prostate can be minimised. Further imaging dose reduction can be achieved by tailoring the imaging field sizes to each patient, or to each treatment beam.
Acknowledgments
The authors wish to thank Julie Baz for carefully reviewing the manuscript and improving the clarity. PK gratefully acknowledges the financial support of the NHMRC Australia Fellowship scheme and US NIH/NCI R01 CA93626.
References
- ICRP publication 60. Pergamon Press; Oxford: 1991. Recommendations of Radiation Protection. 60 I. [Google Scholar]
- Pollack ATL, Buyyounouski M, Horwitz E, Price R, Feigenberg S, Konski A, Greenberg R, Uzzo R, Ma C. Hypofractionation for Prostate Cancer: Interim Results of a Randomized Trial. Int J Radiation Oncology Biol Phys. 2009;75:S82. [Google Scholar]
- Adamson J, Wu Q, Yan D. Dosimetric effect of intrafraction motion and residual setup error for hypofractionated prostate intensity-modulated radiotherapy with online cone beam computed tomography image guidance. International Journal of Radiation Oncology, Biology, Physics. 2011;80:453–61. doi: 10.1016/j.ijrobp.2010.02.033. [DOI] [PMC free article] [PubMed] [Google Scholar]
- Aukett RJ, Burns JE, Greener AG, Harrison RM, Moretti C, Nahum AE, Rosser KE. Addendum to the IPEMB code of practice for the determination of absorbed dose for x-rays below 300 kV generating potential (0.035 mm Al–4 mm Cu HVL) Phys Med Biol. 2005;50:2739–48. doi: 10.1088/0031-9155/50/12/001. [DOI] [PubMed] [Google Scholar]
- Bistrovic M, Biscan M, Viculin T. RBE of 20 kV and 70 k VX-rays determined for survival of V 79 cells. Radiotherapy and Oncology. 1986;7:175–80. doi: 10.1016/s0167-8140(86)80097-4. [DOI] [PubMed] [Google Scholar]
- D’Souza WD, Naqvi SA, Yu CX. Real-time intra-fraction-motion tracking using the treatment couch: a feasibility study. Phys Med Biol. 2005;50:4021–33. doi: 10.1088/0031-9155/50/17/007. [DOI] [PubMed] [Google Scholar]
- de Crevoisier R, Tucker SL, Dong L, Mohan R, Cheung R, Cox JD, Kuban DA. Increased risk of biochemical and local failure in patients with distended rectum on the planning CT for prostate cancer radiotherapy. Int J Radiat Oncol Biol Phys. 2005;62:965–73. doi: 10.1016/j.ijrobp.2004.11.032. [DOI] [PubMed] [Google Scholar]
- Ding GX, Duggan DM, Coffey CW. Accurate patient dosimetry of kilovoltage cone-beam CT in radiation therapy. Med Phys. 2008;35:1135. doi: 10.1118/1.2839096. [DOI] [PubMed] [Google Scholar]
- Goggelmann W, Jacobsen C, Panzer W, Walsh L, Roos H, Schmid E. Re-evaluation of the RBE of 29kV x-rays (mammography x-rays) relative to 220kV x-rays using neoplastic transformation of human CGL1-hybrid cells. Radiation and Environmental Biophysics. 2003;42:175–82. doi: 10.1007/s00411-003-0210-y. [DOI] [PubMed] [Google Scholar]
- Hyer D, Serago C, Kim S, Li J, Hintenlang D. An organ and effective dose study of XVI and OBI cone-beam CT systems. J Applied Clin Med Phys. 2009;11:181–97. doi: 10.1120/jacmp.v11i2.3183. [DOI] [PMC free article] [PubMed] [Google Scholar]
- King C. In: IMRT, IGRT, SBRT - Advances in the Treatment Planning and Delivery of Radiotherapy. Meyer JL, et al., editors. Basel: Karger; 2011. pp. 428–37. [Google Scholar]
- Klevenhagen SC, Aukett RJ, Harrison RM, Moretti C, Nahum AE, Rosser KE. The IPEMB code of practice for the determination of absorbed dose for x-rays below 300 kV generating potential (0.035 mm Al - 4 mm Cu HVL; 10 – 300 kV generating potential) Phys Med Biol. 1996;41:2605–25. doi: 10.1088/0031-9155/50/12/001. [DOI] [PubMed] [Google Scholar]
- Kupelian P, Willoughby T, Mahadevan A, Djemil T, Weinstein G, Jani S, Enke C, Solberg T, Flores N, Liu D. Multi-institutional clinical experience with the Calypso System in localization and continuous, real-time monitoring of the prostate gland during external radiotherapy. Int J Radiat Oncol Biol Phys. 2007;67:1088–98. doi: 10.1016/j.ijrobp.2006.10.026. [DOI] [PubMed] [Google Scholar]
- Langen K, Pouliot J, Anezinos C, Aubin M, Gottschalk A, Hsu I, Lowther D, Liu Y, Shinohara K, Verhey L. Evaluation of ultrasound-based prostate localization for image-guided radiotherapy. Int J Radiat Oncol Biol Phys. 2003;57:635–44. doi: 10.1016/s0360-3016(03)00633-3. [DOI] [PubMed] [Google Scholar]
- Langen K, Willoughby T, Meeks S, Santhanam A, Cunningham A, Levine L, Kupelian P. Observations on Real-Time Prostate Gland Motion Using Electromagnetic Tracking. Int J Radiat Oncol Biol Phys. 2008;71:1084–90. doi: 10.1016/j.ijrobp.2007.11.054. [DOI] [PubMed] [Google Scholar]
- Linthout N, Verellen D, Tournel K, Reynders T, Duchateau M, Storme G. Assessment of secondary patient motion induced by automated couch movement during on-line 6 dimensional repositioning in prostate cancer treatment. Radiotherapy and Oncology. 2007;83:7. doi: 10.1016/j.radonc.2007.04.015. [DOI] [PubMed] [Google Scholar]
- Liu W, Wiersma RD, Mao W, Luxton G, Xing L. Real-time 3D internal marker tracking during arc radiotherapy by the use of combined MV–kV imaging. Phys Med Biol. 2008;53:7197–213. doi: 10.1088/0031-9155/53/24/013. [DOI] [PMC free article] [PubMed] [Google Scholar]
- Oliver M, Ansbacher W, Beckham WA. Comparing planning time, delivery time and plan quality for IMRT. RapidArc and Tomotherapy. 2009;10 doi: 10.1120/jacmp.v10i4.3068. [DOI] [PMC free article] [PubMed] [Google Scholar]
- Poulsen PR, Cho B, Keall PJ. Real-time prostate trajectory estimation with a single imager in arc radiotherapy: a simulation study. Phys Med Biol. 2009;54:4019–35. doi: 10.1088/0031-9155/54/13/005. [DOI] [PubMed] [Google Scholar]
- Poulsen PR, Cho B, Sawant A, Keall PJ. Implementation of a New Method for Dynamic Multileaf Collimator Tracking of Prostate Motion in Arc Radiotherapy Using a Single kV Imager. Int J Radiat Oncol Biol Phys. 2010;76:914–23. doi: 10.1016/j.ijrobp.2009.06.073. [DOI] [PubMed] [Google Scholar]
- Shah AP, Kupelian PA, Willoughby TR, Langen KM, Meeks SL. An evaluation of intrafraction motion of the prostate in the prone and supine positions using electromagnetic tracking. Radiotherapy and Oncology. 2011;99:37–43. doi: 10.1016/j.radonc.2011.02.012. [DOI] [PubMed] [Google Scholar]
- Shchory T, Schifter D, Lichtman R, Neustadter D, Corn BW. Tracking Accuracy of a Real-Time Fiducial Tracking System for Patient Positioning and Monitoring in Radiation Therapy. Int J Radiat Oncol Biol Phys. 2010;78:1227–34. doi: 10.1016/j.ijrobp.2010.01.067. [DOI] [PubMed] [Google Scholar]
- Shimizu S, Shirato H, Kitamura K, Shinohara N, Harabayashi T, Tsukamoto T, Koyanagi T, Miyasaka K. Use of an Implanted Marker and Real-Time Tracking of the Marker for the Positioning of Prostate and Bladder Cancers. Int J Radiat Oncol Biol Phys. 2000;48:1591–7. doi: 10.1016/s0360-3016(00)00809-9. [DOI] [PubMed] [Google Scholar]
- Smeenk RJLR, Langen KM, Shah AP, Kupelian PA, van Lin EN, Kaanders JH. An Endorectal Balloon Reduces Intrafraction Prostate Motion During Radiotherapy. International Journal of Radiation Oncology, Biology, Physics. 2011 doi: 10.1016/j.ijrobp.2011.07.028. [DOI] [PubMed] [Google Scholar]
- Wiersma R, Pearson E, Pellizarri C. Development of a Dynamic kV Collimator for Low Diagnostic Dose Real-Time 3D Motion Tracking during Radiation Therapy by Combined MV-kV Imaging. Int J Radiat Oncol Biol Phys. 2009:75. [Google Scholar]
- Winzel E, van der Merwe E, Groenewald W, Pistorius S, Slabbert J, Robinson L, Böhm L. The relative biological effectiveness of 100 kV X-rays determined by the V-79 cell colony assay. South African Med J. 1987;71:693–5. [PubMed] [Google Scholar]
- Zhang P, Mah D, Happersett L, Cox B, Hunt M, Mageras G. Determination of action thresholds for electromagnetic tracking system-guided hypofractionated prostate radiotherapy using volumetric modulated arc therapy. Med Phys. 2011;38:4001. doi: 10.1118/1.3596776. [DOI] [PMC free article] [PubMed] [Google Scholar]


