Abstract
The Ensatina eschscholtzii complex of plethodontid salamanders, a well-known “ring species,” is thought to illustrate stages in the speciation process. Early research, based on morphology and coloration, has been extended by the incorporation of studies of protein variation and mitochondrial DNA sequences. The new data show that the complex includes a number of geographically and genetically distinct components that are at or near the species level. The complex is old and apparently has undergone instances of range contraction, isolation, differentiation, and then expansion and secondary contact. While the hypothesis that speciation is retarded by gene flow around the ring is not supported by molecular data, the general biogeographical hypothesis is supported. There is evidence of a north to south range expansion along two axes, with secondary contact and completion of the ring in southern California. Current research targets regions once thought to show primary intergradation, but which molecular markers reveal to be zones of secondary contact. Here emphasis is on the subspecies E. e. xanthoptica, which is involved in four distinct secondary contacts in central California. There is evidence of renewed genetic interactions upon recontact, with greater genetic differentiation within xanthoptica than between it and some of the interacting populations. The complex presents a full array of intermediate conditions between well-marked species and geographically variable populations. Geographically differentiated segments represent a diversity of depths of time of isolation and admixture, reflecting the complicated geomorphological history of California. Ensatina illustrates the continuing difficulty in making taxonomic assignments in complexes studied during species formation.
The famous books by Dobzhansky (1) and Mayr (2) initiated a long period of general agreement on species concepts and speciation, but in recent years controversy has again developed. Once ignited (3), the debate raged for years, and only now do I sense a developing consensus (4, 5). New methods and techniques have changed the criteria by which species concepts are made manifest in taxonomies. My focus here is a celebrated ring species, the plethodontid salamander Ensatina, once touted by Dobzhansky (6) as an example of incipient, but incomplete, speciation.
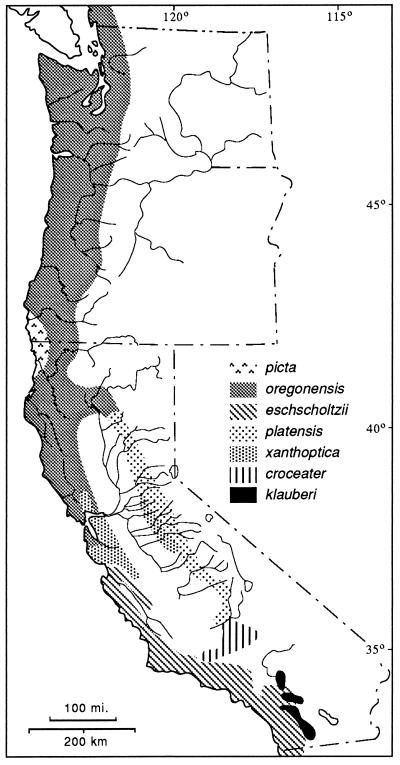
Ensatina are fully terrestrial salamanders distributed in coniferous forests and oak woodland along the Pacific Coast from southern British Columbia to northern Baja, CA, extending inland to the western slopes of the Cascades, the Sierra Nevada, and the Peninsular Ranges. At one time four species were recognized, but at the height of popularity of the Evolutionary Synthesis, a detailed analysis of coloration and morphology led Stebbins (7) to the conclusion that they were parts of a polytypic species arranged in the form of a ring around the Central Valley of California. Stebbins recognized seven subspecies of Ensatina eschscholtzii (Fig. 1). What makes this study so interesting is a historical biogeographic hypothesis and its implications: the species originated in present-day northwestern California and southwestern Oregon and spread southward. Along the coast the species developed a Mullerian mimicry relationship with newts (the model) and evolved a uniform reddish brown dorsal coloration and a light pink to orange ventral coloration. In the inland mountains the species evolved a cryptic, spotted, or blotched color pattern. As the two arms of the expanding distribution moved southward, they came into sympatry in the southern Peninsular Ranges. In Dobzhansky’s view, while the ring showed terminal overlap and demonstrated nearly all stages in a speciation process (primary intergradation with adaptive divergence, secondary contact with hybridization, and finally sympatry), speciation was thwarted by on-going gene flow via intermediates around the ring (6). The demonstration (8–10) of some hybridization in the southern California zone of sympatry added credence to this interpretation.
Figure 1.
The Ensatina complex, showing distribution of taxa recognized by Stebbins (7), but with borders based on molecular markers rather than morphological traits.
A survey of protein variation in 19 populations throughout the complex disclosed great differentiation and showed that gene flow cannot be holding this far-flung complex together (11, 12). The analysis revealed values of Fst > 0.7, thus refuting the hypothesis of continuous gene flow. While these data do not affect the biogeographic hypothesis (7), they raise the possibility of a group of closely related species whose borders remain to be identified.
The hypothesis of a northern origin and a southern spread along two fronts was based on the presence in the north of high levels of variation in color pattern in the subspecies E. e. picta, and to a lesser degree in the surrounding form, E. e. oregonensis. Increasing genetic divergence from north to south was inferred from the progressive divergence in morphology (basically, color pattern) between coastal and interior forms south of the area of continuous distribution at the north end of the Central Valley (7). Free interbreeding was thought to occur in the north, a region of morphological intergradation. To the south hybridization occurs where E. e. xanthoptica from the coast has established populations in the foothills of the central Sierra Nevada, where it meets E. e. platensis (Fig. 1). Sympatry with little hybridization occurs between the southernmost forms, the coastal E. e. eschscholtzii and the inland E. e. klauberi. Subsequent research has shown that xanthoptica and platensis hybridize wherever they meet, but in very narrow hybrid zones (on the order of several home range diameters in width, or a few hundred meters). While klauberi and eschscholtzii hybridize, they do so less frequently and in even narrower hybrid zones (10, 13). At the southernmost area of contact, the two forms are sympatric with no evidence of past or present hybridization (13, 14).
I have tested Stebbins’ biogeographic hypothesis. Polymorphism and heterozygosity, estimated from allozymes, are extraordinarily high in northwestern California, among the highest recorded for any vertebrate, whereas more southern populations have less variation (the least occurs in the postulated colonists, the Sierran xanthoptica) (11, 12). The total number of presumptive alleles in the northern populations is also high (e.g., in one population, 59 alleles for 28 allozymes, n = 10), as expected for old, large populations relative to newer, smaller ones. Genetic distance generally increases between paired comparative populations on either side of the valley from north to south, also as expected (12).
A phylogenetic analysis of sequence variation in the mitochondrial gene cytochrome b also shows substantial variation within Ensatina (15). The greatest variation occurs in the north. Within the subspecies oregonensis, picta, and intergrades are several distinct, distantly related haplotypes. There are two monophyletic clades in the complex with respect to this gene. The first includes xanthoptica and eschscholtzii as sister groups; these are the southern subspecies of the coastal arm. The second clade includes klauberi, E. e. croceater, and southern populations of platensis; these are the southernmost parts of the inland arm. These data support Stebbins’ biogeographic scenario.
The protein and DNA studies were not conducted at a sufficiently fine scale to determine whether or not species formation has already occurred. Questions arose concerning taxonomy; for example, some considered klauberi to be a separate species (ref. 16; but see ref. 17). A second allozymic survey of 49 populations from picta through oregonensis to the blotched forms along the inland arm disclosed a complicated pattern of isolation by distance in the south, relative genetic uniformity in one large northern area, and two distributional and genetic gaps (17). Periods of separation and differentiation were hypothesized to have been followed by secondary contacts, with resumption of gene flow. While evidence of past separation persists in molecular markers, allozymes and mitochondrial haplotypes show transitions in different areas and morphological uniformity prevails across old borders. No taxonomic changes were proposed, pending completion of other studies. One critic has focused attention not on the contact zones but on the areas of relative uniformity, and argued that many, perhaps 11 or more, species constitute the Ensatina complex (18). The controversy, in part, involves what occurs upon the recontact of previously separated units (D.B.W. and C.J. Schneider, unpublished data). As Dobzhansky (ref. 20, p. 205) identified the problem: “how much gene exchange between diverging populations is possible without arresting and reversing the divergence?” Here I present new information bearing on this question. My conclusion is that incipient species formation is occurring in the nearly continuous “ring,” but that species borders remain unclear.
MATERIALS AND METHODS
This paper summarizes previously unpublished data regarding interactions of the taxa oregonensis, xanthoptica, and eschscholtzii in central coastal California, mainly from populations ranging along the Pacific Coast from northern Mendocino County to central Monterey County and in the hills east of San Francisco Bay. Although this region encompasses large zones of intergradation (based on morphological studies, ref. 7), for purposes of clarity populations are assigned to taxa. Results are derived from three separate kinds of data: morphological, allozymic, and mitochondrial sequences. Morphological data follow earlier analyses (7, 10), but include a much larger data set. A complex-wide study of proteins (19 populations, 5 of which are relevant to this study, using 26 allozymic loci) laid the foundation for subsequent work (12). A first stage examined 25 loci in 20 populations (n per population = 8–22; mean, 13.6) from regions east (East Bay) and north (North Bay) of San Francisco Bay; a second studied 27 loci in 20 East and South Bay populations (n = 2–20; mean, 8.6), and a third used 22 of the most relevant loci in 34 populations (n = 2–19; mean, 7.0) from the North and South Bay. These will be reported as first, second, and third studies in this paper. It is not possible to directly combine these studies, which were done at different times and used some different buffers, in part because of the large number of alleles detected. This complex data set will be published elsewhere, and only the main results are presented here. Nei (21) genetic distances (D) are reported. Sequences of the cytochrome b gene (664–775 bp) constitute the third kind of data. This is a growing data set (presently including data for over 80 populations), representing an expansion of the initial study (12), and research is actively in progress. Results are based on preliminary analyses of the data.
RESULTS
Populations identified as xanthoptica, unblotched salamanders with large amounts of orange pigmentation (especially ventrally) and a bright yellow upper iris, occur in the North, South and East Bay regions and in the west-central Sierra Nevada. This taxon occupies a key position in the ring complex. A zone of morphological intergradation between xanthoptica and eschscholtzii extends from Atascadero northward in the Coast Range to the Monterey Bay region (7). Morphological intergradation of xanthoptica with oregonensis occurs from near Monterey Bay north to the vicinity of Ft. Ross (7). In the Sierra Nevada xanthoptica hybridizes with platensis (14). While acknowledging the validity of the analysis of coloration (7), there is little evidence of the intergradation described above using molecular markers.
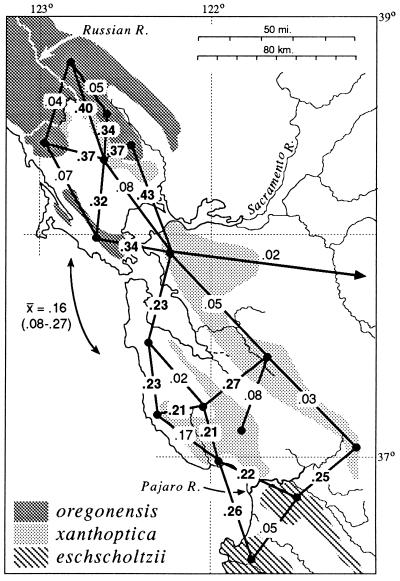
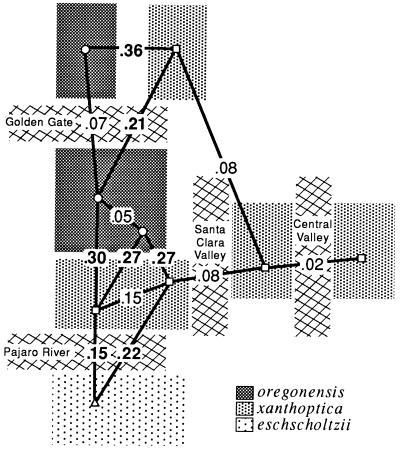
General results are summarized in Fig. 2. Although the distribution of xanthoptica is interrupted by major present-day barriers, the taxon maintains some integrity as a unit, especially with respect to coloration and the monophyly of DNA sequences. Minimal D is 0.08 between North Bay and East Bay localities, and 0.05 between East Bay and South Bay localities. However, between South Bay and North Bay localities there is relatively great and varying divergence (D = 0.15–0.47). The genetic connection between the North Bay and South Bay appears to be via the East Bay; San Francisco Bay and associated Carquinez Straits (north) and Santa Clara Valley (south), which currently interrupt the range, are apparently recent barriers. There are some relatively high D values (to 0.19) between the East Bay and the South Bay (populations likely to be even more divergent have not been included in the same study as yet). There is variation within each of these three areas. D within the North Bay reaches 0.15 (n, number of populations compared = 5), within the East Bay, 0.09 (n = 4), and within the South Bay, 0.31 (n = 6 in each of two studies using different populations). In the eastern part of the South Bay distances are below 0.15, but some western populations are highly divergent from everything studied (these also are the populations with the greatest divergence to North Bay xanthoptica). Several populations contain both xanthoptica and oregonensis alleles; these introgressed populations were not classified.
Figure 2.
Distribution of taxa of Ensatina in the San Francisco Bay region, showing D (21) based on allozyme data between selected neighboring populations. Bold face type, D between taxa; normal type, D within taxa. The mean and range of D between North Bay and South Bay oregonensis is shown.
There is a finger-like projection of xanthoptica into oregonensis in the North Bay, and this small range is divided by inhospitable (now agricultural and urban) lowlands to the west of Santa Rosa. To the west, north, and east, populations are genetically oregonensis. D values between the two taxa exceed 0.3. Based on allozymes, populations identified by coloration (7) as xanthoptica are correctly assigned, but populations identified as morphological intergrades are assigned to oregonensis (with exceptions discussed below).
On the southern San Francisco Peninsula in the Santa Cruz Mountains oregonensis and xanthoptica meet with a genetic gap of D = 0.16–0.32. Further south, the genetic distance between xanthoptica and eschscholtzii across the Pajaro River is somewhat less (D = 0.15–0.2). There is little evidence as yet for gene flow between nearby populations of oregonensis and xanthoptica in this region, although two local populations appear to be admixed. There remain small local geographic gaps in our sampling. However, as we have shortened the geographic distance between xanthoptica and eschscholtzii in the vicinity of Monterey Bay, D has dropped from 0.32 (12) to 0.15, and there remains a zone about 30 km in width which is largely unsampled (habitat along the Pajaro River has been disrupted by agricultural activities and urbanization). These data suggest that D will drop further as additional populations are discovered in the intervening area.
We sampled only a small portion of the distribution of oregonensis (it ranges to southern Canada), but uncovered surprisingly great local differentiation. The first study included 18 populations extending from northern Mendocino down to southern Marin counties. D ranged as high as 0.26, and 31% of population comparisons exceeded D = 0.15 (the approximate level at which species borders typically occur in the closely related genus Plethodon; ref. 22). Detailed analysis of this variation is beyond the scope of the present paper, but I observe that variation is great and no areas of high uniformity or of potential species borders were uncovered; furthermore, borders determined from haplotypes do not coincide with those determined from allozymes (D.B.W. and C.J. Schneider, unpublished data). The highest values of D within oregonensis involved comparisons across the range, between populations along the Pacific Coast and those relatively far inland. For no nearest neighbor comparison is D = 0, and many are in the range D = 0.02–0.07. The third study included 12 populations (a few repeats from the earlier study but mainly different) of oregonensis extending from the Russian River area through the Coast Range to southern Marin County, with a few populations in eastern Sonoma County. Even in this relatively small region genetic diversification is great, with D reaching a high of 0.23 (across the breadth of the range) and 36% of the comparisons exceeding D = 0.15. Near neighbors always have the lowest values, but rarely less than D = 0.04. Genetic distances across the Russian River range from 0.08 to 0.15, suggesting that it has restricted gene flow to some extent.
Populations of oregonensis occur in the South Bay, mainly on the northern part of the San Francisco Peninsula, but extending southeast to near Loma Prieta. Within this small peninsular area diversification is great. A maximum D = 0.16 is present in study three (n = 4), with only one comparison D < 0.1. In study two (n = 3) the highest value is D = 0.08.
The mean D between oregonensis north and south of the Golden Gate is 0.16 (range, 0.08–0.27; 15 populations). There are three comparisons in the range of 0.08–0.09, showing that the Golden Gate has not been a major distributional barrier.
There is a genetic gap between oregonensis and xanthoptica in the North Bay. D ranges from 0.28 to more than 0.5, but in the areas where populations of the two approach most closely D = 0.3–0.4. There are five to eight potentially useful loci for constructing hybrid indices (14), but none are fixed and there is so much variation, especially in oregonensis, that indices would only be useful locally. Some populations appear to be introgressed or admixed (see below). There is no evidence of hybridization per se (i.e., no clear F1 hybrids or backcrosses).
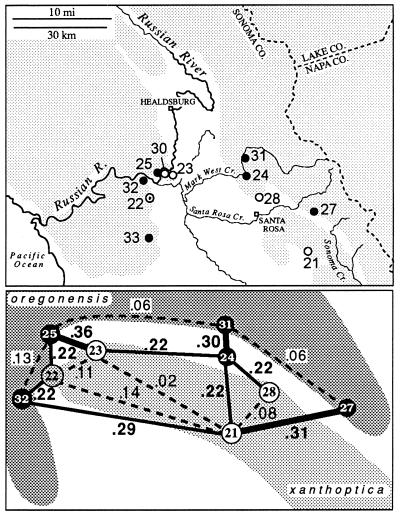
In two areas near Santa Rosa there is evidence of gene flow between oregonensis and xanthoptica (Fig. 3), in the form of admixture. This is at the extreme northwestern limit of the range of xanthoptica, in the hills immediately north of Santa Rosa and on the west side of the valley that separates these hills from the main Coast Range near Forestville. In the first area three populations were sampled from nearly continuous habitat near Mark West Creek. One of these populations (no. 28, n = 19) is similar to xanthoptica in coloration, and another (no. 31, n = 10) is similar to oregonensis. These populations are separated by less than 10 km, but D = 0.34. Both are highly variable (no. 28 has 36 alleles; no. 31 has 34 alleles at 22 loci), but only no. 28 shows signs of limited gene flow from the other taxon (alleles characteristic of oregonensis are present at low frequency for four loci). A third population (no. 24, n = 5), 5 km south of population no. 31, displays coloration somewhat intermediate between oregonensis and xanthoptica, but genetic distances are high to both neighboring populations (0.22 to no. 28; 0.30 to no. 31). There are 32 alleles in the relatively small sample, but no evidence of F1 hybrids. However, the sample is fixed for an otherwise rare allele for malate dehydrogenase (Mdh; EC 1.1.1.37) (found at a frequency of 0.06 in population 31; absent in population 28), fixed for an allele for Acon 1 (EC 4.2.1.3) that is relatively common in population 31 and absent in no. 28, and fixed for an allele for proline depeptidase (Pep-d; EC 3.4.13.9) which is in high frequency in population 28 (0.91) but absent in population 31. Acon 2 has an allele found only in population 24 and an admixed population across the valley to the west. Population 24 lacks an allele for glutamic-oxaloacetic transaminase (Got; EC 2.6.1.1) that is fixed in population 31 but absent in no. 28, and it has two of the three alleles that appear in population 28. Evidently gene flow as well as some sorting of variants has occurred. This suggests that there is no intrinsic barrier (e.g., specific mate recognition systems, or postmating isolating mechanisms) to genetic exchange (there is no evidence of such barriers anywhere in the complex). The region of admixture is narrow, in relation to the range of the taxa, but probably not with respect to the relatively narrow home ranges known to be characteristic of this complex (23, 24). Some additional populations in this area are introgressed as well and these are not assigned to any taxon.
Figure 3.
The xanthoptica–oregonensis contact zone north of San Francisco Bay in the Santa Rosa–Russian River area. Populations 22 and 24 are intermediate in nature. D values between selected populations are indicated. Shading in upper part of figure indicates wooded land.
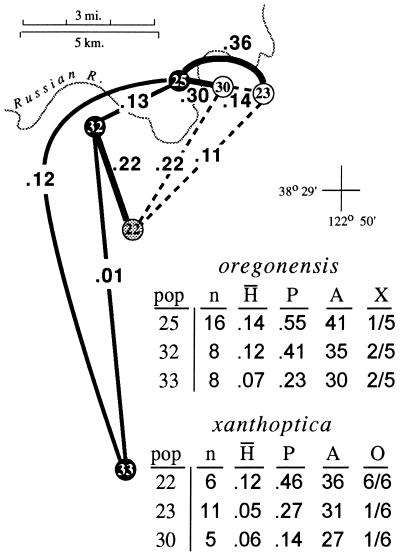
The second area is even narrower (Fig. 4). Across the Russian River at the northwestern limit of the range of xanthoptica there is a genetic gap D = 0.3 in less than 1 km. As much as 0.15 occurs within oregonensis just to the west of the contact zone, but the intertaxon distance is substantially greater and implies secondary contact of well differentiated groups. There is also evident change in color pattern on either side of the Russian River; on the east and south salamanders have extensive orange pigmentation and a bright yellow dorsal iris, whereas on the west and north orange pigmentation is greatly reduced, especially ventrally, and the upper iris is much paler. Two relatively large samples separated by less than 5 km have a D = 0.36. The oregonensis population (no. 25, n = 16) contains 41 alleles, and the xanthoptica population (no. 23, n = 11) contains 31 alleles, but only one locus (different in each population) is potentially introgressed from the other taxon in either population. The population of xanthoptica (no. 30) closest to oregonensis (no. 25) is small (n = 5) and has oregonensis alleles at only one locus. One population (no. 22, n = 6) has high genetic distance to all neighboring populations, even those less than 10 km distant (D = 0.11 to one xanthoptica; 0.22 to two oregonensis), including the other admixed population (D = 0.31 to no. 24). This sample is of mixed origin, but its heterozygosity (mean direct count 0.12) is about the same as populations 25 and 23 and there are no clear hybrid genotypes. Specimens have the coloration of xanthoptica, but alleles characteristic of oregonensis are present in all six potential marker loci and it has a high total number of alleles for a small sample (population 36), further indicating its composite nature.
Figure 4.
Expansion of Fig. 3, showing the Russian River contact zone. Populations are sorted by taxon, but population 22 is intermediate in most respects. pop, Population number in study three; n, sample size; H̄, mean heterozygosity (direct count); P, proportion of loci polymorphic; A, number of alleles in 22 allozymic loci; X, fraction of xanthoptica marker alleles present in populations assigned to oregonensis; O, fraction of oregonensis marker alleles in populations assigned to xanthoptica.
In the South Bay the genetic gap between xanthoptica and oregonensis is generally less than in the North Bay (Fig. 5). In the second study, D ranges from 0.16–0.32 (mean, 0.23) between South Bay oregonensis and all South Bay and East Bay xanthoptica, with the largest and smallest values both representing South Bay comparisons. The mean is identical for South Bay and East Bay comparisons. Two populations (one small sample from the east slopes of the Santa Cruz Mountains and the other from the Pacific coastal zone of the mid-peninsula) appear to be admixed, although it is more difficult to detect possibly diagnostic loci than in the North Bay. The coastal population (n = 7) is genetically equidistant between the two taxa (D = 0.11–0.29, mean 0.20 to xanthoptica; 0.21–0.24 to oregonensis). In the third study, D between South Bay oregonensis and xanthoptica ranges from 0.22 to 0.35 (mean, 0.28). One population appears to be admixed (D = 0.17–0.34 to South Bay xanthoptica; D = 0.17–0.22 to South Bay oregonensis, some only ≈5 km distant), but it is a small sample (n = 3) and distances are high because of sampling effects. Distances in the third study would be expected to be greater than in the second, because only more variable, potentially diagnostic loci were selected for study. The values in Fig. 5 reflect the likely upward bias.
Figure 5.
Modern barriers to dispersal in the San Francisco Bay area for taxa discussed in this paper. Genetic distances between selected populations indicated on lines connecting them. Bold D values are between taxa.
Distances between xanthoptica and eschscholtzii are slightly less than between xanthoptica and oregonensis: D = 0.21–0.37 between East Bay xanthoptica and eschscholtzii, and 0.14–0.32 between South Bay xanthoptica and eschscholtzii. In the third study D = 0.15–0.39, mean 0.23 for South Bay xanthoptica and eschscholtzii; D = 0.24–0.38, mean 0.29 for eschscholtzii to oregonensis. Populations of xanthoptica and eschscholtzii that are closest geographically have the lowest values.
More than 80 populations have been sampled for sequence variation in the cytochrome b gene (ref. 15 and unpublished data). Corrected sequence divergence between the three taxa considered here is 0.05–0.07 for xanthoptica to eschscholtzii, in excess of 0.09 for eschscholtzii to oregonensis, and in excess of 0.11 for xanthoptica to oregonensis. There is substantial variation within all taxa, but especially oregonensis (which is paraphyletic with respect to this gene). A phylogenetic analysis of sequence data indicates that xanthoptica and eschscholtzii are sister taxa and form a monophyletic group (15), but their closest relative is unclear and recent analysis of a much larger sample has failed to find a closest relative. The base of the cytochrome b gene tree for the Ensatina complex is unstable. The contact zones detected with allozymes described herein are also detectable with mitochondrial DNA; a detailed study by D. Parks in this laboratory is in progress.
DISCUSSION
While the main features of the historical biogeographic hypothesis (7) for the Ensatina complex are generally supported by recent work, we now can see that the original scenario was too simple. Differentiation is greater than originally envisioned, and there is evidence throughout the ring of subdivision, differentiation, and several recontacts. Nevertheless, the complex displays features of a ring-like series of interacting units. In the north boundaries between apparently old units have been obscured by recurrent gene flow and different character sets do not coincide geographically; as one moves south the units become more distinct and data sets are more coordinated. In regions of secondary contact in the Sierra Nevada and southern California, clear hybridization occurs; although hybrids and backcrosses are healthy and fertile, there is apparently selection against them (14). Elsewhere in the ring there is no unambiguous evidence of hybridization, by which I mean sympatry and production of offspring from mating of unlike forms, but there is evidence of genetic admixture and introgression between geographically adjacent units, usually with more genetic differentiation within units than between them along their borders.
The intergradation zones based on morphology (7) are far too broad when compared with data derived from molecular markers. Do the molecular markers identify species borders? If one treats Ensatina eschscholtzii as a simple species, it is more differentiated genetically than most species of vertebrates (25). While several suggestions have been made for taxonomic reclassification (16, 18, 26), all proposed solutions are problematic (D.B.W. and C. J. Schneider, unpublished data). Morphological DNA and allozyme criteria exist for making taxonomic decisions, but in this complex they frequently do not coincide geographically (D.B.W. and C. J. Schneider, unpublished data). One of the most distinctive taxa in the complex is xanthoptica. A case might be made for recognizing it as a separate species. However, as shown here, there are leaky borders with neighboring taxa and it remains unclear if the taxa are merging or continuing to diverge. Furthermore, there is a broad overlap in comparison of within and between taxon genetic distances, so that genetic distances are much greater within xanthoptica than they are between taxa in the zones of secondary contact. Accordingly, xanthoptica lacks integrity as an historical unit.
The other taxa treated here offer contrasts with xanthoptica. For example, eschscholtzii is much less differentiated genetically, suggesting that its southward spread has been recent. On the other hand, oregonensis (including picta) is more deeply differentiated and may represent an ancient, persistent ancestral stock of the complex as a whole. However, we have found no places in northern California where borders identified by one data set are matched by those found with other data sets, so past differentiates have apparently merged as a result of on-going genetic interactions across geography. Even if one recognized eschscholtzii and xanthoptica as separate taxa on phylogenetic grounds (e.g., mtDNA sequences), one would be left with a plesiomorphic oregonensis–picta agglomeration. Proposals that this agglomeration be separated into several species (18) are unsatisfactory (D.B.W. and C. J. Schneider, unpublished data), and if one started down the path of naming as species all identifiable pieces of the phylogenetic nexus there would be far more species than anyone has proposed to date (e.g., in unpublished and incomplete research we have identified many haplotype clades). Accordingly, I recommend maintaining the current taxonomy while research continues.
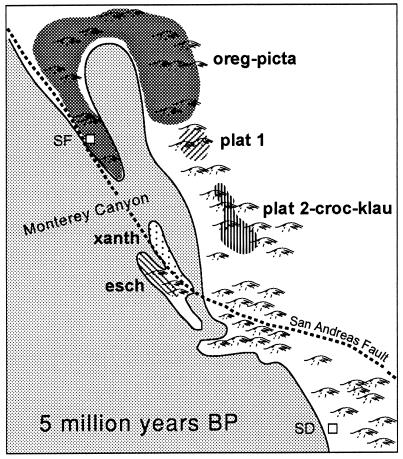
Sequence data suggest that eschscholtzii and xanthoptica are sister taxa (ref. 15 and unpublished data). I propose that a common ancestor of these two was isolated to the south of the main range of what became present-day oregonensis. Secondary contacts among these taxa are a consequence of major geomorphological reorganizations of coastal California associated with the complicated tectonic history of the region. One possible reconstruction is inspired by the historical biogeographic hypothesis for the plethodontid salamander genus Batrachoseps (ref. 27, see also ref. 28) and assumption of a general (but as yet uncalibrated) molecular clock. For various periods during the Tertiary, precursor drainages of the present-day Central Valley entered the Pacific Ocean in the vicinity of present-day Monterey Bay, where the largest marine canyon (of Grand Canyon scale) on the Pacific Coast of North America is found (29). I suggest that the proposed common ancestor of the xanthoptica–eschscholtzii clade may have been isolated south of this region on the order of 5 million years ago, and that differentiation proceeded during this period of isolation. Precursors to xanthoptica and eschscholtzii may have been isolated on either side of the San Andreas Fault (Fig. 6). Land in this area has been extremely unstable over a long period of time, and has been moving at a rate of ≈35 mm/year over the last 4–5 million years (30). I postulate that land connections were made and broken repeatedly, and that movement of primordial xanthoptica into the present-day South Bay region occurred relatively early, based on the high degree of genetic differentiation that has taken place. Subsequently xanthoptica moved into the East Bay and North Bay, as well as across the Central Valley. Very recently the Central Valley has established a new drainage to the ocean, at the Golden Gate, as a result of the Inner Coast Range becoming continuous. The northward expansion of xanthoptica brought it into secondary contact with oregonensis, in the South Bay and independently in the North Bay. The expansion of xanthoptica into the foothills of the Sierra Nevada led to contacts with both northern and southern platensis (14, 17). That all of these contacts are recent is suggested by the low minimal D values (0.05–0.08 between geographic areas within xanthoptica). Secondary contact between xanthoptica and eschscholtzii probably occurred from the north, for apparently xanthoptica had more dispersal access from the Santa Cruz Mountains than did eschscholtzii, which was isolated to the south by a flat, sandy (and thus relatively inhospitable) area east of Monterey Bay, as well as two major rivers (Pajaro, Salinas). The region of the Pajaro River is a major biogeographic border (27), as it marks the southern boundary of many amphibians: Ambystoma macrodactylum, Aneides flavipunctatus, Batrachoseps attenuatus, Dicamptodon ensatus, Taricha granulosa and E. e. xanthoptica. It is the northern boundary of Batrachoseps pacificus and E. e. eschscholtzii.
Figure 6.
Hypothetical distribution of the Ensatina complex ≈5 million years before present. Based on reconstruction of California paleogeography by Yanev (27). Approximate location of precursors to genetically defined units within the Ensatina complex are indicated. oreg-picta, oregonensis and picta; plat 1, northern platensis (15, 17); plat 2-croc-klau, southern platensis plus croceater plus klauberi (15, 17); xanth, xanthoptica; esch, eschscholtzii; SF, approximate position of present day San Francisco; SD, approximate position of present-day San Diego. The approximate positions of the San Andreas Fault and Monterey Canyon (the latter at the outflow of the Pajaro and Salinas Rivers) are indicated.
Against the hypothesis laid out above is the fact that in both the North Bay and the South Bay, xanthoptica is relatively differentiated genetically, more so than would be predicted by the lowest genetic distances measured between North and South Bay to East Bay populations. Perhaps the initial recontact between xanthoptica and oregonensis is old; the lowest genetic distances between regions might reflect relatively recent genetic exchange between particular populations.
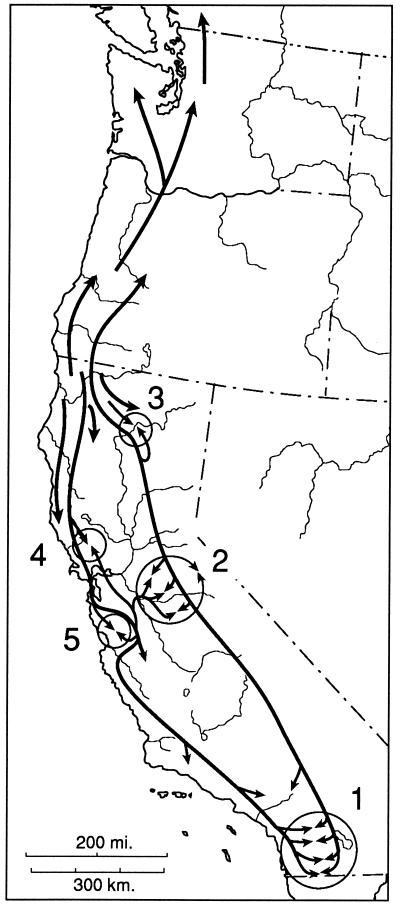
In related taxa in eastern North America, many nearly cryptic species have been recognized (19, 22, 31). I suggest that there are historical reasons for the differences in pattern in eastern and western North America. In eastern North America there may have been far greater effects of Pleistocene glaciation than in the west, and this may have led to more local range restriction as well as extinction. This may have sharpened borders between groups of populations and heightened the genetic cohesion of units. In contrast, in California glaciation effects were more limited, although they have been postulated to have played a role in contributing to the differentiation of some taxa and to have sharpened boundaries in the Sierra Nevada (17). Instead, in California there has been a history of extensive geomorphological evolution coinciding with the history of the Ensatina complex. The time and space dimensions of the diversification are interconnected. The history of this complex has probably featured substantial isolation, differentiation, and multiple recontacts (Fig. 7). In effect, there are rings within rings in this complex, resulting from many levels of history being manifest in a single complicated pattern of variation, expressed somewhat differently at the three levels investigated to date—DNA sequences, allozymes, and color pattern. While the complex appears to be in a state of incipient species formation, which makes taxonomy problematic, it provides an instructive evolutionary example.
Figure 7.
Historical biogeographic interpretation for the Ensatina complex. Five zones of secondary interaction are shown. 1, Interaction of klauberi and eschscholtzii. 2, Complex interaction between northern and southern platensis and of these interactors with xanthoptica in the central Sierra Nevada. 3, Interaction of oregonensis and northern platensis in the Lassen Peak area. 4, North Bay interaction of oregonensis and xanthoptica. 5, South Bay interaction of oregonensis and xanthoptica and of xanthoptica and eschscholtzii.
Acknowledgments
I thank M. Frelow, T. Jackman, D. Nguyen, C. Schneider, and K. P. Yanev for their extensive laboratory assistance, and C. Brown and many other individuals who have helped me in field work. Illustrations are by K. Klitz. I have benefited from discussions, comments on the manuscript, or both, with R. Bello, C. Brown, M. Garcia Paris, C. Haddad, R. Highton, T. Jackman, S. Kuchta, M. Mahoney, D. Parks, C. Schneider, R. Stebbins, M. Wake, K. Yanev, and K. Zamudio. The manuscript was improved by comments from two anonymous reviewers. This work was supported by grants from the National Science Foundation and the Gompertz Professorship.
References
- 1.Dobzhansky T. Genetics and the Origin of Species. New York: Columbia Univ. Press; 1937. [Google Scholar]
- 2.Mayr E. Systematics and the Origin of Species. New York: Columbia Univ. Press; 1942. [Google Scholar]
- 3.Ghiselin M. Syst Zool. 1974;23:536–544. [Google Scholar]
- 4.Avise J C, Wollenberg K. Proc Natl Acad Sci USA. 1997;94:7748–7755. doi: 10.1073/pnas.94.15.7748. [DOI] [PMC free article] [PubMed] [Google Scholar]
- 5.deQueiroz K. In: Endless Forms: Species and Speciation. Berlocher S, Howard D, editors. Oxford: Oxford Univ. Press; 1997. , in press. [Google Scholar]
- 6.Dobzhansky T. In: A Century of Darwin. Barnett S A, editor. Cambridge, MA: Harvard Univ. Press; 1958. pp. 19–55. [Google Scholar]
- 7.Stebbins R C. Univ Calif Publ Zool. 1949;48:377–526. [Google Scholar]
- 8.Stebbins R C. Evolution. 1957;11:265–270. [Google Scholar]
- 9.Brown C W, Stebbins R C. Evolution. 1965;18:706–707. [Google Scholar]
- 10.Brown C W. Univ Calif Publ Zool. 1974;98:1–64. [Google Scholar]
- 11.Larson A, Wake D B, Yanev K P. Genetics. 1984;106:293–308. doi: 10.1093/genetics/106.2.293. [DOI] [PMC free article] [PubMed] [Google Scholar]
- 12.Wake D B, Yanev K P. Evolution. 1986;40:702–715. doi: 10.1111/j.1558-5646.1986.tb00532.x. [DOI] [PubMed] [Google Scholar]
- 13.Wake D B, Yanev K P, Brown C W. Evolution. 1986;40:866–868. doi: 10.1111/j.1558-5646.1986.tb00548.x. [DOI] [PubMed] [Google Scholar]
- 14.Wake D B, Yanev K P, Frelow M M. In: Speciation and its Consequences. Otte D, Endler J A, editors. Sunderland, MA: Sinauer; 1989. pp. 134–157. [Google Scholar]
- 15.Moritz C, Schneider C J, Wake D B. Syst Biol. 1992;41:273–291. [Google Scholar]
- 16.Frost D, Hillis D. Herpetologica. 1990;46:87–104. [Google Scholar]
- 17.Jackman T, Wake D B. Evolution. 1994;48:876–897. doi: 10.1111/j.1558-5646.1994.tb01369.x. [DOI] [PubMed] [Google Scholar]
- 18.Highton, R. (1997) Herpetologica, in press.
- 19.Tilley S C, Mahoney M J. Herpetol Monogr. 1996;10:1–42. [Google Scholar]
- 20.Dobzhansky T. Genetics and the Origin of Species. 3rd Ed. New York: Columbia Univ. Press; 1951. [Google Scholar]
- 21.Nei M. Am Nat. 1972;106:283–292. [Google Scholar]
- 22.Highton R. Annu Rev Ecol Syst. 1995;26:579–600. [Google Scholar]
- 23.Stebbins R C. Univ Calif Publ Zool. 1954;54:47–124. [Google Scholar]
- 24.Staub N L, Brown C W, Wake D B. J Herpetol. 1995;29:593–599. [Google Scholar]
- 25.Avise J. Molecular Markers, Natural History and Evolution. New York: Chapman & Hall; 1994. [Google Scholar]
- 26.Graybeal A. Syst Biol. 1995;44:237–250. [Google Scholar]
- 27.Yanev K P. In: The California Islands: Proceedings of a Multidisciplinary Symposium. Power D M, editor. Santa Barbara, CA: Santa Barbara Museum of Natural History; 1980. [Google Scholar]
- 28.Tan A-M, Wake D B. Mol Phyl Evol. 1995;4:383–394. doi: 10.1006/mpev.1995.1036. [DOI] [PubMed] [Google Scholar]
- 29.Martin B D, Emery K O. Am Assoc Pet Geol Bull. 1967;51:2281–2304. [Google Scholar]
- 30.Powell R E, Weldon II R J. Annu Rev Earth Planet Sci. 1992;20:431–468. [Google Scholar]
- 31.Highton R. Ill Biol Monogr. 1989;57:1–78. [Google Scholar]


