

Abstract
While item response theory (IRT) research shows a latent severity trait underlying response patterns of substance abuse and dependence symptoms, little is known about IRT‐based severity estimates in relation to clinically relevant measures. In response to increased prevalences of marijuana‐related treatment admissions, an elevated level of marijuana potency, and the debate on medical marijuana use, we applied dimensional approaches to understand IRT‐based severity estimates for marijuana use disorders (MUDs) and their correlates while simultaneously considering gender‐ and race/ethnicity‐related differential item functioning (DIF). Using adult data from the 2008 National Survey on Drug Use and Health (N = 37,897), Diagnostic and Statistical Manual of Mental Disorders, Fourth Edition (DSM‐IV) criteria for MUDs among past‐year marijuana users were examined by IRT, logistic regression, and multiple indicators–multiple causes (MIMIC) approaches. Among 6917 marijuana users, 15% met criteria for a MUD; another 24% exhibited subthreshold dependence. Abuse criteria were highly correlated with dependence criteria (correlation = 0.90), indicating unidimensionality; item information curves revealed redundancy in multiple criteria. MIMIC analyses showed that MUD criteria were positively associated with weekly marijuana use, early marijuana use, other substance use disorders, substance abuse treatment, and serious psychological distress. African Americans and Hispanics showed higher levels of MUDs than Whites, even after adjusting for race/ethnicity‐related DIF. The redundancy in multiple criteria suggests an opportunity to improve efficiency in measuring symptom‐level manifestations by removing low‐informative criteria. Elevated rates of MUDs among African Americans and Hispanics require research to elucidate risk factors and improve assessments of MUDs for different racial/ethnic groups. Copyright © 2012 John Wiley & Sons, Ltd.
Keywords: differential item functioning, item response theory, multiple indicators–multiple causes model, marijuana use disorders
Introduction
There is a need to improve understanding of the demographic and health‐related profiles for marijuana use disorders (MUDs) as the debate regarding medical marijuana use has intensified (http://medicalmarijuana.procon.org/) and evidence has shown increased levels of marijuana potency and MUDs among minority groups (Compton et al., 2004; National Center on Addiction and Substance Abuse [NCASA], 2008). Here, we apply dimensional approaches to elucidate the changing demographic profiles of MUDs and to inform assessment and classification of MUDs for the Diagnostic and Statistical Manual of Mental Disorders‐5 (DSM‐5), focusing on dimensionality, redundancy in criteria, and item‐response bias in self‐reports of MUD symptoms. To be consistent with reports of medical marijuana and the data source for this study, the term marijuana is used to refer to marijuana/hashish.
The DSM‐5 is scheduled to be published in 2013 (Schatzberg, 2010). Owing to a growing body of studies suggesting that substance abuse and dependence are not categorical conditions, dimensional item response theory (IRT) modeling has become an important tool in informing the classification of substance use disorders (SUDs) for DSM‐5 (Gillespie et al., 2007; Saha et al., 2006). The IRT assumes that a single latent construct underlying item responses describes a continuous trait. The two‐parameter IRT model is most often used because it considers item‐level variations in severity/difficulty and discrimination for a given set of diagnostic questions (Gillespie et al., 2007; Lynskey and Agrawal, 2007; Saha et al., 2006; Wu et al., 2009c; Wu et al., 2010b). A severity parameter indicates an item's location along the latent SUD continuum, with higher values indicating higher severity or risk. A discrimination parameter measures the degree of precision with which an item discriminates among individuals with different risks along the SUD trait, with higher values indicating more relevance to the underlying construct. This approach suggests that abuse and dependence criteria for MUDs will form a dimensional condition and that the severity level of the latent trait will increase as greater numbers of symptoms are present, implying that individuals who endorse severe items will be likely to experience other items.
Recently, IRT has been applied to examine psychometric properties of the DSM‐IV checklist used to assess substance dependences among patients participating in national addiction treatment trials, which supports the construct of a dependence syndrome with varying levels of severity for both marijuana and alcohol dependences (Wu et al., 2009b). Moreover, the IRT approach is useful for evaluating categorical classification of SUDs (abuse and dependence) as defined in DSM‐IV (American Psychiatric Association [APA], 2010). An abuse diagnosis requires the presence of ≥ 1 abuse criteria plus an absence of having dependence; a dependence diagnosis requires the presence of ≥ 3 dependence criteria. This hierarchical distinction implies that abuse is less severe than dependence and possibly more common. However, evidence shows that dependence symptoms are generally more prevalent than abuse symptoms, and that about one‐fifth of adults with a history of drug dependence report no abuse symptoms (Hasin et al., 2005; Wu et al., 2009c; Wu et al., 2008). IRT analyses of symptom data of alcohol and various drug use disorders also have shown that abuse and dependence symptoms form a unidimensional trait (Gillespie et al., 2007; Lynskey and Agrawal, 2007; Saha et al., 2006; Wu et al., 2009c). These findings have contributed to discussions about merging abuse and dependence into one diagnosis with varying levels of severity for DSM‐5 (APA, 2010).
However, several areas of the IRT approach warrant further investigation to improve understanding of IRT‐based estimates. While IRT studies have found that abuse and dependence symptoms (items) form one dimensionality on the IRT‐defined latent trait (Gillespie et al., 2007; Lynskey and Agrawal, 2007), item‐level information curves (IICs) using full information from both severity and discrimination parameters of each item are infrequently reported, making it difficult to evaluate the reliability of IRT results. Of note, IICs reveal crucial evidence for selecting “core items” for an assessment tool (Edelen and Reeve, 2007); when such information is overlooked, conclusions can be limited or biased. For example, one IRT analysis has shown that withdrawal was the most severe item among all cocaine dependence criteria, but additional analyses of IICs revealed its very low level of precision, indicating that it is an unreliable item for measuring cocaine dependence; However, time spent was revealed by IICs as the most reliable, informative item, implying that time spent is a useful screener for identifying cocaine users with cocaine dependence problems (Wu et al., 2009a). Given the scarcity of IIC data to inform item‐level reliability or redundancy in assessing MUDs, the first aim addresses item‐level redundancy for MUD criteria.
Another factor that impedes fuller use of IRT to inform addiction research is that some clinicians and researchers have difficulty understanding the meaning of IRT‐based estimates, as diagnostic items with a low prevalence frequently indicate severe (difficult) items for a SUD. If this assumption is feasible, one would expect to find a significant association between a difficult item and severity indicators of a MUD (e.g. a greater number of MUD symptoms, frequent marijuana use, or substance abuse treatment). This issue warrants research, as a diagnostic assessment must demonstrate its clinical utility in identifying problematic substance users exhibiting a need for intervention or treatment. Given the lack of research in this area, our second aim is to examine associations of MUD criteria with other clinically relevant health‐related indicators (e.g. substance abuse treatment use, serious psychological distress, poor self‐rated health, major depression). Because IRT conceptualizes the level of MUD problems (measured by abuse/dependence criteria) as a continuous condition, one would expect to find a significant association between diagnostic criteria of MUDs and severity‐related health indicators, and the level of MUD severity (the factor score of the MUD criteria) is expected to correlate positively with a variety of severity indicators.
Further, one critically important but understudied area of research involves a general lack of attention to accounting for differential item functioning (DIF) or item‐response measurement errors in self‐reports of SUDs while determining demographic and health‐related correlates for SUDs. Recent evidence has shown gender‐ and race/ethnicity‐related measurement bias in self‐reports of abuse/dependence symptoms, as individuals with an equivalent level of a given SUD respond differentially to diagnostic questions as a function of their gender or racial/ethnic backgrounds (Blanco et al., 2007; Carle, 2010; Wu et al., 2010a; Wu et al., 2010b). For example, Carle (2010) examined diagnostic questions for alcohol abuse in the National Epidemiologic Survey on Alcohol and Related Conditions (NESARC) and found indication of DIF across multiple items. When ignoring DIF, African Americans and Hispanics appeared to have more alcohol abuse problems than Whites; however, after adjusting for identified DIF, Whites and Hispanics demonstrated comparable levels of abuse, and African Americans had lower levels of abuse than Whites (Carle, 2010). The presence of DIF suggests that diagnostic questions for SUDs may be less accurate for various groups, and the observed racial/ethnic differences in rates of SUDs could be biased by measurement errors. These possibilities pose a concern for generating national estimates to inform disparities in SUDs.
One solution to mitigate the influence of such measurement errors is to include statistical adjustment for identified DIF in the analysis of diagnostic data via a multiple indicators–multiple causes (MIMIC) approach (Carle, 2010; Wu et al., 2009b; Wu et al., 2010b; Wu et al., 2009c). MIMIC modeling provides a means for determining the estimated size of DIF, and simultaneously allows statistical adjustment for identified DIF when generating associations between a SUD and covariates through a regression framework (Wu et al., 2009b; Wu et al., 2010b; Wu et al., 2009c). MIMIC modeling integrates the measurement part of the diagnostic criteria with a regression analysis of covariates on a latent factor score measured by all the included symptom variables (Wu et al., 2009b; Wu et al., 2010b; Wu et al., 2009c). As such, multiple symptom variables (all available MUD criteria) are transformed into a continuous factor score and regressed on covariates; the identified DIF by background variables are incorporated as direct effects on the items of concern.
Taken together, given the critical role of a dimensional IRT approach to DSM classification (APA, 2010), we explored the clinical meaning of IRT‐based severity estimates and investigated demographic and health‐related correlates of MUDs while considering DIF. MUDs are the most prevalent illicit drug use disorders (Substance Abuse and Mental Health Services Administration [SAMHSA], 2009a), with close to one in 10 (9%) adult Americans reporting a history of MUD (Compton et al., 2004). The widespread use of marijuana and marijuana‐related problems (e.g. addiction, dropping out of school, delinquency, crimes, reduced productivity, psychiatric problems, suicidal behaviors, cognitive impairment, medical illnesses) have made marijuana use a major public health concern (e.g. Baker et al., 2010; Compton et al., 2004; Gfroerer et al., 2002b; Green et al., 2010; Kuepper et al., 2011; Lynskey et al., 2004; McGrath et al., 2010; NCASA, 2008; Shapiro and Buckley‐Hunter, 2010).
Regrettably, the potency of marijuana is reported to have increased by about 175% over the past decade, and treatment admissions for MUDs have likewise increased (NCASA, 2008; SAMHSA, 2009a). Data from national US surveys of adults in the early 1990s and early 2000s also suggest that prevalences of marijuana use and MUDs are increasing among African Americans and Hispanics (Compton et al., 2004); however, the potential changes in demographic and health‐related correlates for MUDs have not been investigated in a recent and representative sample of American adults. Given the debate about medical marijuana in the United States, updated demographic and health correlates on individuals with MUDs derived from a large nationally representative sample are needed to inform research and intervention efforts.
We address these issues by: first, determining how criterion items of MUDs perform (item‐level severity, discrimination, and information/redundancy) along the latent liability in a large national sample of adult marijuana users; second, examining associations between IRT‐based MUD severity estimates with weekly marijuana use, early onset of marijuana use, and other clinically relevant health‐related indicators (substance abuse treatment, other substance use disorders, serious psychological distress, poor self‐rated health, major depression); and, third, exploring demographic and severity correlates for the latent MUD trait via the MIMIC method to provide less‐biased estimates by adjusting for DIF according to marijuana users' gender and racial/ethnic backgrounds. Weekly and early use of marijuana are included as severity‐related correlates for the latent MUD trait due to their association with elevated odds of MUDs; similarly, the selection of other health‐related indicators is based on their clinical relevance to MUD and treatment use (Anthony and Petronis, 1995; Baker et al., 2010; Blazer and Wu, 2009; Gfroerer and Epstein, 1999; Gfroerer et al., 2002b; SAMHSA, 2008). The goals are to improve understanding of model‐defined severity results by linking the latent factor score of all available MUD criteria with regression analyses (MIMIC), and to provide more accurate correlates for MUDs by adjusting for self‐report‐related DIF to better inform prevention and intervention, especially among Hispanics and African Americans (Compton et al., 2004).
Methods
Data source
Data for this study were from the public‐use data file of the 2008 National Survey on Drug Use and Health (NSDUH), the only survey designed to provide ongoing national estimates of substance use and disorders in the United States, which includes the largest sample of adult marijuana users of any survey that has been completed (SAMHSA, 2009a). The target population includes residents of households from the 50 states plus the District of Columbia (including shelters, rooming houses, and group homes) and civilians residing on military bases. Participants are selected by multistage area probability methods to ensure that each independent cross‐sectional sample is representative of persons aged ≥12 years. Prospective respondents are assured that their names will not be recorded and their responses will be kept strictly confidential, and all study procedures and protections are carefully explained. In 2008, a total of 68,736 respondents aged ≥12 years completed the interview (weighted interviewing response rate = 74%). The study focused on adults aged ≥18 years (N = 37,897), of whom 10% (n = 6917) reported marijuana use in the past 12 months. Of the 6917 users, 60% were male, 64% were 18–34 years of age, 31% were non‐White (15.7% African‐American, 10.7% Hispanic, 4.9% other), 49% had not attended a college, and 45% had an annual family income under US$40,000.
Data collection
Since 1999, the interview has been carried out with computer‐assisted interviewing methodology, using a combination of computer‐assisted personal interviewing conducted by the interviewer for demographic questions and audio computer‐assisted self‐interviewing (ACASI) for questions related to substance use, SUDs, treatment, and health status. ACASI provides respondents with a highly confidential means of responding to questions to increase honest reporting of sensitive behaviors. Respondents read questions on the computer screen or questions are read to them through headphones, and they enter responses directly into a computer provided by the interviewer. The use of ACASI, anonymous data collection to enhance privacy, and detailed probes have reduced reporting bias and improved the quality of data (Gfroerer et al., 2002a; SAMHSA, 2009a).
Measures
Marijuana use
Each category of substance use in NSDUH was assessed by discrete questions in separate sections; each section also included a detailed description of the substance class and a list of substances belonging to that class. These questions were implemented and administered by ACASI. Marijuana use was defined as any self‐reported use of marijuana and hashish. Respondents were read the following: “Marijuana is also called pot or grass. Marijuana is usually smoked—either in cigarettes called joints or in a pipe. It is sometimes cooked in food. Hashish is a form of marijuana that is also called hash. It is usually smoked in a pipe. Another form of hashish is hash oil.” The survey then employed discrete questions to assess respondents' past‐year frequency of use and age of first use. Both were coded categorically and examined as severity‐related correlates for MUDs (Gfroerer and Epstein, 1999; Gfroerer et al., 2002b).
MUDs
Assessments for MUDs and other SUDs were adopted from questions used in the National Comorbidity Survey. As part of an ongoing process for improvement, diagnostic questions were modified and cognitively tested to determine how well they were understood by respondents, evaluated by experts to determine how well the questions captured the DSM‐IV criteria, and administered by ACASI (APA, 2000; Epstein, 2002; SAMHSA, 2009a). Marijuana users who reported using on 6+ days in the past 12 months were assessed for abuse and dependence; very infrequent users are considered unlikely to develop a MUD given the drug's relatively low abuse/dependence liability compared with other illicit drugs. For other illicit drugs, all past‐year users were assessed for abuse and dependence.
The four abuse criteria include: (A1) serious problems at home, work, or school; (A2) regular consumption that put the user in physical danger; (A3) repeated use that led to trouble with the law; and (A4) problems with family or friends caused by continued use. The six dependence criteria are: (D1) tolerance; (D2) more frequent use than intended or inability to maintain limits on use; (D3) inability to reduce or stop use; (D4) spending a great deal of time over a period of a month using the drugs or getting over the effects of use; (D5) reduced involvement or participation in important activities because of use; and (D6) continued use despite related problems with emotions, nerves, or mental or physical health. Marijuana withdrawal is not identified in DSM‐IV and thus not a criterion used for diagnosing dependence (APA, 2000). Past‐year marijuana users endorsing ≥3 dependence criteria in the past year were classified as dependent; those reporting ≥1 abuse criteria but not meeting criteria for dependence were classified as having abuse (APA, 2000); marijuana users who met 1–2 dependence criteria but did not qualify for dependence or abuse were classified as subthreshold dependence (Degenhardt et al., 2002).
Several studies have demonstrated support for NSDUH measures (SAMHSA, 2009a). A large reliability study found substantial (for abuse/dependence questions) to nearly perfect (for cigarette, alcohol, and marijuana use questions) response agreement for NSDUH measures (Chromy et al., 2009); another NSDUH validity study revealed high agreement between self‐reported use and urine drug test results (tobacco, 85%; marijuana, 90%; cocaine, 95%) (Harrison et al., 2007). NSDUH‐defined past‐year prevalence of SUDs (alcohol or drug) among adults in 2000 (6.7%) resembled the prevalence of SUDs (7.4%) among adults in the National Longitudinal Alcohol Epidemiologic Survey (Epstein, 2002).
Demographic and severity‐related variables for MUDs
We examined age, gender, race/ethnicity, educational level, and annual family income to identify marijuana users' demographic profiles. Weekly marijuana use (≥ 52 days/yearly), early onset of marijuana use (≤ 15 years), other SUDs, substance abuse treatment, serious psychological distress, poor self‐rated health, and major depression were explored as severity‐related indicators for MUDs (Anthony and Petronis, 1995; Baker et al., 2010; Blazer and Wu, 2009; Gfroerer and Epstein, 1999; Gfroerer et al., 2002b; SAMHSA, 2008). These variables were dichotomously coded (presence versus no). Other SUDs included past‐year DSM‐IV alcohol or other drug use disorders (cocaine/crack, heroin, hallucinogens, inhalants, analgesic opioids, stimulants, tranquilizers, sedatives); past‐year tobacco dependence was not available. Substance abuse treatment use was defined as any receipt of treatment services specifically related to alcohol or drug use in the prior year (Wu and Ringwalt, 2004). Assessments of past‐year major depression were based on DSM‐IV criteria and adapted from the National Comorbidity Survey Replication (Kessler et al., 2005). Other mental disorders were not assessed. Serious psychological distress was measured by the K6 (Kessler et al., 2003), which assesses symptoms of psychological distress during the one month in the past 12 months when respondents were at their worst emotionally. It has strong psychometric properties and has demonstrated adequate sensitivity and specificity in discriminating DSM‐IV cases from non‐cases (Andrews and Slade, 2001; Kessler et al., 2002).
Data analysis
Owing to the complex survey design of the NSDUH, data were weighted to adjust for non‐response, post‐stratified to known population control totals (estimates of age, gender, race/ethnicity from the 2000 US census), and controlled for extreme weights when necessary (SAMHSA, 2009a). SUDAAN (Research Triangle Institute, 2006) was used to examine distributions of study variables (chi‐square test). Consistent with IRT studies on SUDs (Gillespie et al., 2007; Lynskey and Agrawal, 2007; Wu et al., 2009c), discrete factor, IRT, and MIMIC analyses were based on past‐year marijuana users (N = 6917). Mplus (version 5.1) with complex survey procedures was used for these analyses (Muthén and Muthén, 2007). Discrete factor analysis of the 10 binary abuse/dependence criteria was conducted using a weighted least‐squares estimation procedure to examine IRT's assumption of unidimensionality (Embretson and Reise, 2000). The scree plot of eigenvalues (Cattell, 1996) and the ratio of the first to the second eigenvalue were used to assess support of unidimensionality for IRT modeling (Wu et al., 2009c).
A two‐parameter IRT model examined the relationship between marijuana users' response to each item and their level on the latent trait of MUD severity, which is described by a monotonically increasing S‐shaped item characteristic curve (ICC) (Embretson and Reise, 2000). The ICC indicates the association between levels of MUD trait and the likelihood of exhibiting the 10 criteria. The latent MUD trait falls on a continuum typically scaled from −3 to +3 in standardized units (mean = 0; standard deviation = 1) (Embretson and Reise, 2000). Individuals with high levels of MUD trait will have a higher likelihood for having MUD. IICs (Baker, 2001) were created to evaluate where along the latent severity continuum each criterion provided a greater amount of information; the more information a criterion provides at a given location, the smaller the standard errors that exist in that range (greater precision).
Finally, the continuous factor score of the 10 criteria (the one‐factor dimensional mode) was regressed on each categorical covariate through MIMIC modeling to determine their associations with MUD trait (Wu et al., 2009c; Wu et al., 2010b). The MIMIC model includes: (a) the measurement of the 10 MUD criteria (the latent MUD score/severity), (b) the regression part of latent MUD severity on covariates, and (c) direct effects of covariates on a specific item (DIF). The later part involved sequential tests of direct effects by marijuana users' gender and race/ethnicity variables to elucidate the presence of DIF (Wu et al., 2009c; Wu et al., 2010b). We report unadjusted regression coefficients (β) and adjusted β with versus without controlling for identified DIF to understand the extent of DIF on associations with MUD (Wu et al., 2009c).
Tucker–Lewis Index (TLI), comparative fit index (CFI), and root mean square error of approximation (RMSEA) were used to assess fit of factor, IRT, and MIMIC models. Values of TLI and CFI ≥ 0.95 (1 = perfect fit) and values of RMSEA ≤ 0.06 (lower value, better fit) indicate an excellent fit to the data (Browne and Cudeck, 1993; Hu and Bentler, 1999). All results reported are weighted estimates taking into account complex survey designs (weighting and clustering); only sample sizes are unweighted.
Results
Marijuana use disorders (MUDs)
Of the 6917 past‐year marijuana users, 15% met DSM‐IV criteria for marijuana abuse (5.3%) or dependence (9.6%), and another 24% had subthreshold dependence (endorsing 1–2 dependence criteria but no abuse) (Table 1).
Table 1.
Prevalence of MUDs among past‐year marijuana users aged ≥ 18 years (N = 6917)
| Selected variables, % (SE) | Marijuana dependence | Marijuana abuse | Marijuana subthresholddependence | Marijuana use without symptoms | χ 2 (df) p‐Value |
|---|---|---|---|---|---|
| Sample size | n = 853 | n = 419 | n = 1909 | n = 3736 | |
| Overall | 9.6 (0.52) | 5.3 (0.37) | 24.2 (0.93) | 60.9 (1.08) | |
| Gender | |||||
| Male | 10.0 (0.61) | 6.3 (0.54) | 28.1 (1.39) | 55.7 (1.42) | 47.3 (3) |
| Female | 9.1 (0.69) | 3.8 (0.52) | 18.6 (1.21) | 68.5 (1.48) | <0.01 |
| Age in years | |||||
| 18–25 | 13.6 (0.73) | 6.6 (0.40) | 29.0 (0.80) | 50.8 (1.07) | 90.5 (6) |
| 26–35 | 10.6 (1.44) | 5.0 (1.14) | 25.1 (1.58) | 59.4 (2.21) | <0.01 |
| 35 or older | 4.5 (0.90) | 3.9 (0.88) | 18.3 (2.26) | 73.3 (2.36) | |
| Race/ethnicity | |||||
| White | 8.5 (0.54) | 5.1 (0.50) | 24.0 (1.01) | 62.4 (1.30) | 32.4 (9) |
| African‐American | 12.3 (1.71) | 5.0 (1.15) | 29.9 (3.09) | 52.8 (2.81) | <0.01 |
| Hispanic | 13.4 (2.01) | 7.6 (1.39) | 19.8 (1.80) | 59.3 (2.59) | |
| Other | 8.1 (2.30) | 3.2 (0.84) | 19.5 (3.96) | 69.3 (4.49) | |
| Education | |||||
| < High school | 12.1 (1.52) | 9.6 (1.44) | 29.3 (1.68) | 49.0 (2.70) | 53.5 (6) |
| High school | 11.8 (1.14) | 5.8 (0.73) | 26.3 (1.65) | 56.1 (1.82) | <0.01 |
| ≥ College | 7.5 (0.58) | 3.6 (0.44) | 21.4 (1.35) | 67.5 (1.58) | |
| Family income | |||||
| < $40,000 | 10.9 (0.80) | 6.0 (0.59) | 27.2 (1.02) | 55.9 (1.37) | 15.5 (6) |
| $40,000–$74,999 | 9.2 (1.20) | 4.7 (0.80) | 23.8 (1.56) | 62.3 (1.97) | <0.05 |
| ≥ $75,000 | 7.8 (0.96) | 4.7 (0.78) | 19.5 (2.22) | 68.0 (2.83) |
Note: Sample sizes are unweighted; all other results are weighted figures. Df, degrees of freedom; SE, standard error.
An elevated rate of abuse was noted among men (6%), young adults aged 18–25 years (7%), and adults who did not complete high school (10%); an elevated rate of dependence was found among young adults aged 18–34 years (11 − 14%), African‐Americans (12%), Hispanics (13%), and adults who did not attend college (12%). Subthreshold dependence was likely to be found among men (28%), young adults aged 18–25 years (29%), African Americans (30%), adults who did not complete high school (29%), and those with a family income < US$40,000 (27%).
Patterns of MUD symptoms
Among all marijuana users, dependence criteria (5.3 – 30.2%) were more commonly endorsed than abuse criteria (2.1 – 4.7%). The abuse group was more likely to report A2 (hazardous use: 48.9% versus 21.5%) and A3 (problems with the law: 18.3% versus 11.8%) than the dependence group; the latter was more likely to endorse all individual dependence criteria (43.0 – 93.8%) than the abuse group (1.5 – 59.9%). However, a high proportion of the abuse group also endorsed D1 (tolerance, 34.1%) and D4 (time spent using, 59.9%) (Table 2).
Table 2.
Prevalence of DSM‐IV marijuana abuse and dependence symptoms among past‐year marijuana users aged ≥ 18 years (N = 6917)
| DSM − IV criteria for marijuana abuse and dependence symptoms | All users | Marijuana dependence | Marijuana abuse | Marijuana use without a disorder | χ 2 (df) p‐Value |
|---|---|---|---|---|---|
| Sample size | n = 6917 | n = 853 | n = 419 | n = 5645 | |
| Proportion, column % (SE) | |||||
| A1: Role interference | 4.6 (0.40) | 32.1 (2.40) | 28.0 (3.77) | 0 | NS |
| A2: Hazardous use | 4.7 (0.35) | 21.5 (1.79) | 48.9 (4.36) | 0 | 197.7(1) <0.01 |
| A3: Problems with the law | 2.1 (0.25) | 11.8 (1.49) | 18.3 (3.33) | 0 | NS |
| A4: Relationship problems | 3.4 (0.28) | 23.0 (2.10) | 22.7 (2.84) | 0 | NS |
| D1: Tolerance | 19.7 (0.89) | 80.6 (2.88) | 34.1 (3.78) | 11.9 (0.71) | 224.9(2) <0.01 |
| D2: Taking larger amounts or longer | 5.4 (0.44) | 45.6 (3.17) | 1.5 (0.88) | 1.0 (0.20) | 149.1(2) <0.01 |
| D3: Inability to cut down | 5.3 (0.44) | 43.0 (2.53) | 3.7 (1.88) | 1.1 (0.25) | 170.5(2) <0.01 |
| D4: Time spent using | 30.2 (0.87) | 93.8 (1.61) | 59.9 (3.84) | 21.2 (0.90) | 399.2(2) <0.01 |
| D5: Giving up activities | 8.1 (0.51) | 61.2 (2.57) | 15.6 (3.16) | 1.7 (0.28) | 264.0(2) <0.01 |
| D6: Continued use despite resulting medical or psychological problems | 6.8 (0.45) | 54.1 (2.98) | 9.9 (2.32) | 1.3 (0.19) | 160.7(2) <0.01 |
Note: Sample sizes are unweighted; all other results are weighted figures. Df, degrees of freedom; SE, standard error; NS, not significant (p > 0.05).
Factor and IRT analyses of MUD criteria
Both the scree plot and the ratio of the first eigenvalue to the second (6.32/1.10 = 5.7) from discrete factor analysis indicated a dominant single factor underlying the 10 criteria (factor loadings were freely estimated). The one‐factor model of the 10 criteria showed an excellent fit to the data (CFI = 0.976, TLI = 0.970, RMSEA = 0.013), as did the two‐factor model (CFI = 0.975, TLI = 0.973, RMSEA = 0.012). The two‐factor model indicated that the abuse factor (the four abuse criteria) and the dependence factor (the six dependence criteria) were highly correlated (correlation = 0.90). These results provided support for unidimensionality of the 10 criteria to allow for IRT modeling (Table 3).
Table 3.
IRT analysis of DSM‐IV criteria for marijuana abuse and dependence among past‐year marijuana users aged ≥ 18 years (N = 6917)
| Marijuana abuse and dependence criteria | Prevalence of each criteriona | Factor loadings | Item discrimination parametersb | Item severity parametersb | Mean number of the 10 criteria endorsedc |
|---|---|---|---|---|---|
| % (95% CI) | Estimate (95% CI) | Estimate (95% CI) | Estimate (95% CI) | Mean (95% CI) | |
| A3: Problems with the law | 2.1 (1.65–2.68) | 0.7 (0.66–0.79) | 1.1 (0.86–1.25) | 2.8 (2.51–3.08) | 5.2 (4.61–5.68) |
| A2: Hazardous use | 4.7 (3.99–5.41) | 0.7 (0.60–0.73) | 0.9 (0.74–1.04) | 2.5 (2.29–2.76) | 4.2 (3.73–4.58) |
| A4: Relationship problems | 3.4 (2.90–4.01) | 0.8 (0.74–0.83) | 1.3 (1.07–1.44) | 2.3 (2.16–2.50) | 5.2 (4.88–5.49) |
| D3: Inability to cut down | 5.3 (4.48–6.25) | 0.8 (0.76–0.84) | 1.3 (1.12–1.53) | 2.0 (1.87–2.18) | 4.4 (4.09–4.72) |
| D2: Taking larger amounts/longer | 5.4 (4.54–6.30) | 0.8 (0.76–0.85) | 1.3 (1.13–1.56) | 2.0 (1.85–2.17) | 4.5 (4.16–4.81) |
| A1: Role interference | 4.6 (3.83–5.44) | 0.9 (0.84–0.91) | 1.8 (1.51–2.12) | 1.9 (1.81–2.05) | 5.2 (4.83–5.51) |
| D6: Continued use despite problems | 6.8 (5.98–7.77) | 0.8 (0.75–0.85) | 1.3 (1.11–1.54) | 1.9 (1.72–2.02) | 4.4 (4.15–4.69) |
| D5: Giving up activities | 8.1 (7.15–9.21) | 0.9 (0.84–0.90) | 1.8 (1.51–2.04) | 1.6 (1.51–1.70) | 4.4 (4.12–4.64) |
| D1: Tolerance | 19.7 (17.96–21.52) | 0.8 (0.71–0.79) | 1.1 (0.99–1.28) | 1.1 (1.03–1.24) | 3.0 (2.88–3.16) |
| D4: Time spent using | 30.2 (28.49–31.97) | 0.8 (0.75–0.84) | 1.3 (1.12–1.52) | 0.6 (0.59–0.71) | 2.5 (2.41–2.67) |
Note: Sample sizes are unweighted; all other results are weighted figures. CI, confidence interval.
Prevalence of endorsement of each criterion among the 6,917 marijuana users.
The IRT model included the 10 abuse and dependence criteria; CFI = 0.97; TLI = 0.97; RMSEA = 0.01.
Mean number of the 10 criteria endorsed among those who reported “yes” to the criterion in that row.
As represented by ICCs in Figure 1, the 10 criteria had a moderately good‐to‐high discrimination (0.9 − 1.8) for differentiating among marijuana users along the middle‐to‐high severity levels for MUD risk (0.6 − 2.8). A2 − A3 (hazardous use; problems with the law) represented the most severe levels on the IRT‐defined continuum (shifted to right end in Figure 1), followed by A4 (relationship problems), D2 − D3 (taking larger amounts; inability to cut down), A1 (role interference), and D5 − D6 (giving up activities; medical/psychological problems). D1, D4 (tolerance, time spent) were endorsed at the lowest severe level. Marijuana users who endorsed D4 or D5 also endorsed significantly fewer mean numbers of the 10 criteria than marijuana users who endorsed other criteria (Table 3).
Figure 1.
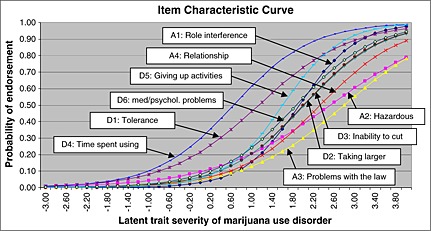
Item characteristic curves for marijuana abuse and dependence criteria (N = 6917).
IICs added valuable information about item‐level reliability (measurement error) in assessing the latent MUD trait (Figure 2) and clarified the presence of three sub‐clusters of symptoms ranging from low‐to‐middle (D1, D4), middle‐to‐high, (A1, A4, D2 − D3, D5 − D6, A4), to high (A2 − A3) severity. A1 (role interference) and D5 (giving up activities) were the most reliable indicators for middle‐to‐high levels of MUD. Both A2 and A3 (hazardous use; problems with the law) provided information for differentiating among marijuana users at high levels of MUD.
Figure 2.
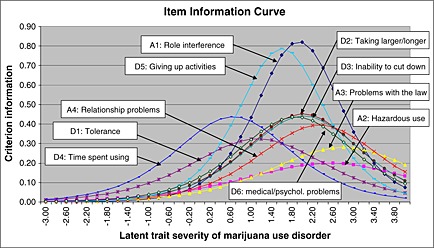
Item information curves for marijuana abuse and dependence criteria (N = 6917).
Item‐level associations with severity‐related characteristics
Logistic regression analyses were performed to examine associations of each (observed) criterion with each severity‐related variable (Table 4). All individual criteria were associated with increased odds of weekly marijuana use, early use (onset <16 years), use of substance abuse treatment, other SUDs, and serious psychological distress, while some criteria were associated with increased odds of poor self‐rated health (three abuse and two dependence criteria) and major depression (three abuse and three dependence criteria).
Table 4.
The association of each abuse/dependence indicator with other severity‐related marijuana use and health measures among past‐year marijuana users aged ≥ 18 years (N = 6917)
| Logistic regression of each indicator as a dependent variable | Weekly marijuana use | First marijuana use ≤15 years | Substance abuse treatment use | Other substance use disorders | Serious psychological distress | Poor/fair self‐rated health | Major depression |
|---|---|---|---|---|---|---|---|
| Crude OR | OR (95% CI) | OR (95% CI) | OR (95% CI) | OR (95% CI) | OR (95% CI) | OR (95% CI) | OR (95% CI) |
| A1: Role interference | 8.5 (5.10–14.16)* | 2.1 (1.43–2.96)* | 3.9 (2.60–5.91)* | 3.0 (2.08–4.30)* | 2.6 (1.87–3.57)* | 1.8 (1.09–3.03)* | 1.7 (1.10–2.51)* |
| A2: Hazardous use | 4.2 (3.10–5.79)* | 2.0 (1.39–2.99)* | 2.5 (1.58–3.97)* | 4.9 (3.29–7.17)* | 2.4 (1.65–3.39)* | 2.2 (1.31–3.80)* | 1.6 (1.01–2.66)* |
| A3: Problems with the law | 7.0 (4.05–12.26)* | 2.9 (1.62–5.30)* | 8.9 (5.14–15.29)* | 4.0 (2.38–6.78)* | 1.6 (1.07–2.45)* | 2.5 (1.20–5.21)* | 1.1 (0.46–2.86) |
| A4: Relationship problems | 6.3 (4.26–9.37)* | 1.9 (1.23–2.85)* | 3.8 (2.41–6.16)* | 2.7 (1.97–3.64)* | 2.9 (2.17–3.92)* | 1.8 (0.98–3.15) | 2.5 (1.67–3.73)* |
| D1: Tolerance | 7.5 (5.99–9.47)* | 2.3 (1.95–2.78)* | 2.2 (1.58–3.07)* | 1.9 (1.57–2.29)* | 1.8 (1.51–2.26)* | 1.7 (1.32–2.28)* | 1.6 (1.24–1.97)* |
| D2: Taking larger amount/longer | 13.6 (6.95–26.54)* | 2.0 (1.42–2.86)* | 2.5 (1.53–4.14)* | 1.7 (1.31–2.33)* | 2.0 (1.39–2.83)* | 1.3 (0.78–2.27) | 1.3 (0.86–1.96) |
| D3: Inability to cut down | 9.0 (5.51–14.79)* | 1.5 (1.08–2.20)* | 1.8 (1.02–3.19)* | 1.6 (1.09–2.32)* | 1.6 (1.09–2.25)* | 1.4 (0.82–2.39) | 1.2 (0.84–1.82) |
| D4: Time spent using | 13.2 (10.63–16.31)* | 2.3 (1.92–2.76)* | 1.7 (1.22–2.51)* | 1.6 (1.29–1.99)* | 1.78(1.43–2.16)* | 1.3 (1.01–1.78)* | 1.4 (1.11–1.70)* |
| D5: Giving up activities | 9.1 (6.33–13.22)* | 1.8 (1.39–2.31)* | 2.4 (1.62–3.59)* | 1.9 (1.50–2.51)* | 1.8 (1.38–2.36)* | 1.4 (0.88–2.13) | 1.4 (0.98–1.92) |
| D6: Continued use despite problems | 5.4 (3.84–7.70)* | 1.4 (1.05–1.96)* | 2.0 (1.32–3.05)* | 1.9 (1.46–2.57)* | 2.8 (2.16–3.53)* | 1.4 (0.94–2.21) | 1.9 (1.36–2.78)* |
Note: Sample sizes are unweighted; all other results are weighted figures. OR, odds ratio; CI, confidence interval.
p < 0.05.
The latent factor score of the 10 criteria and severity‐related characteristics
MIMIC modeling considered all 10 criteria of MUD simultaneously by providing a means by which the continuous factor score of the 10 criteria was regressed on demographic and severity‐related variables (Table 5). Weekly marijuana use, early marijuana use, substance abuse treatment, other SUDs, and serious psychological distress were positively associated with the factor score of MUD criteria even after controlling for age, gender, race/ethnicity, education, and family income.
Table 5.
The MIMIC modeling of the latent factor score of the 10 marijuana abuse and dependence criteria and its association with demographic characteristics and other severity‐related marijuana use and health measures among past‐year marijuana users aged ≥ 18 years (N = 6917)
| The MIMIC model of the latent factor score of the 10 criteria | Crude regression coefficient (SE)a | Adjusted regression coefficient (SE)b | Adjusted regression coefficient (SE): without DIFc | Adjusted regression coefficient (SE): with DIFd |
|---|---|---|---|---|
| Gender | ||||
| Female versus male | −0.22 (0.04)*** | — | −0.17 (0.06)** | −0.20 (0.06)*** |
| Age in years | ||||
| 18–25 versus ≥ 35 years | 0.50 (0.06)*** | — | 0.53 (0.07)*** | 0.53 (0.07)*** |
| 26–34 versus ≥ 35 years | 0.37 (0.08)*** | — | 0.37 (0.09)*** | 0.38 (0.09)*** |
| Race/ethnicity | ||||
| African‐American versus White | 0.19 (0.06)*** | — | 0.16 (0.07)* | 0.16 (0.08)* |
| Hispanic versus White | 0.21 (0.07)*** | — | 0.15 (0.07)* | 0.24 (0.08)** |
| Other versus White | −0.09 (0.11) | — | −0.01 (0.11) | 0.03 (0.12) |
| Education | ||||
| < High school versus ≥ college | 0.37 (0.06)*** | — | 0.01 (0.06) | 0.01 (0.06) |
| High school versus ≥ college | 0.28 (0.05)*** | — | 0.12 (0.05)* | 0.12 (0.05)* |
| Family income | ||||
| < $40 K versus ≥ $75 K | 0.24 (0.07)*** | — | 0.02 (0.08) | 0.02 (0.08) |
| $40 K–$74,999 versus ≥ $75 K | 0.11 (0.07) | — | −0.02 (0.07) | −0.02 (0.07) |
| Weekly marijuana use | ||||
| Yes versus no | 1.17 (0.05)*** | 1.15 (0.05)*** | 0.14 (0.05)** | 0.14 (0.05)** |
| First marijuana use ≤ 15 years | ||||
| Yes versus no | 0.39 (0.04)*** | 0.37 (0.04)*** | 1.18 (0.06)*** | 1.19 (0.06)*** |
| Substance abuse treatment | ||||
| Yes versus no | 0.56 (0.08)*** | 0.55 (0.07)*** | 0.44 (0.06)*** | 0.45 (0.06)*** |
| Serious psychological distress | ||||
| Yes versus no | 0.41 (0.04)*** | 0.46 (0.05)*** | 0.37 (0.07)*** | 0.37 (0.07)*** |
| Poor/fair self‐rated health | ||||
| Yes versus no | 0.26 (0.08)*** | 0.29 (0.08)** | 0.15 (0.09) | 0.16 (0.09) |
| Major depression, past year | ||||
| Yes versus no | 0.24 (0.05)*** | 0.30 (0.05)*** | 0.03 (0.07) | 0.03 (0.07) |
| Other substance use disorders, past year | ||||
| Yes versus no | 0.41 (0.04)*** | 0.37 (0.04)*** | 0.24 (0.04)*** | 0.24 (0.04)*** |
Note: Sample sizes are unweighted; all other results are weighted figures. DIF, differential item functioning; SE, standard error.
The unadjusted MIMIC model included one variable listed in that row.
The adjusted model included one variable listed in that row, adjusting for gender, age, race/ethnicity, education, and family income.
The adjusted model included all variables listed in the first column.
The adjusted model included all variables listed in the first column and DIF variables (Figure 3).
p < 0.05;
p < 0.01;
p < 0.001.
MIMIC modeling also expanded to include analyses of DIF by gender and racial/ethnic status. There was indication of DIF in self‐reports of MUD symptoms (Figure 3). At the equivalent MUD level, women were more likely than men to endorse D2 (taking larger amounts/longer, regression coefficient = 0.17) and D6 (medical/psychological problems, regression coefficient = 0.19); African‐Americans were less likely than Whites to endorse A3 (problems with the law, regression coefficient = −0.33); and Hispanics were less likely than Whites to endorse D1 (tolerance, regression coefficient = −0.27) and D4 (time spent, regression coefficient = −0.28).
Figure 3.
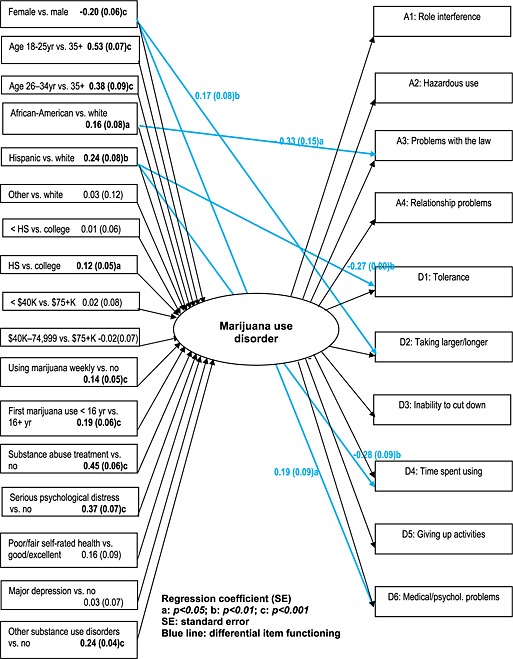
The MIMIC model of marijuana abuse and dependence (N = 6917).
In the model incorporating identified DIF (Figure 3), younger ages (18–25 versus ≥ 35 years; 16–34 versus ≥ 35 years), being African‐American or Hispanic (versus being White), high school education (versus ≥ college), weekly or early marijuana use, other SUDs, use of substance abuse treatment, and serious psychological distress were positively associated with an increased level of MUD trait, while female gender was negatively associated with MUD trait.
Discussion
The reported increased rates of MUDs among minority groups and marijuana‐related treatment admissions, an elevated level of marijuana potency, and the debate on medical marijuana use have resulted in calls for research to evaluate potentially changing profiles for MUDs (Compton et al., 2004; NCASA, 2008; SAMHSA, 2009b). Using data from a large nationally representative sample of marijuana users, we integrated latent (IRT/MIMIC) and observed (logistic regression) procedures to evaluate population disparities in MUDs while considering gender‐ and race/ethnicity‐related DIF in self‐reports of MUD symptoms. Latent approaches indicate support for IRT‐based severity estimates because, at a syndrome level, the factor score of all MUD criteria was positively associated with weekly or early onset of marijuana use, other SUDs, substance abuse treatment, and serious psychological distress. This pattern was identified from logistic regression analysis of individual item‐level data. MIMIC modeling using information from all available MUD criteria further revealed an elevated level of MUDs among young adults, African‐Americans, and Hispanics; this association remained after adjusting for identified DIF in self‐reports of MUDs. This finding supports other national data from adults collected during the early 2000s showing an increased level of marijuana‐related problems among young users who were African‐American or Hispanic (Compton et al., 2004).
What this study adds
First, these results reveal a high level of redundancy in diagnostic questions for MUDs and suggest a need to reduce the number of criteria used to assess symptoms of MUDs. Prior IRT studies of SUD data have found that criterion symptoms for individual SUDs (including MUDs) form a unidimensional distribution (e.g. Gillespie et al., 2007; Lynskey and Agrawal, 2007); item‐level information data (IICs), however, were omitted. Here, we have shown that IICs provide clearer item‐level performance than ICCs as IICs clarify the presence of six criteria (A1, A4, D2, D3, D5, D6) measuring similar middle‐to‐high levels of the MUD trait. Of these, role interference and giving up important activities were the most reliable indicators, suggesting that less reliable items are redundant and could be evaluated for removal to improve efficiency in the assessment of MUD in clinical settings.
IICs also show that items assessing either the lower ends (dependence items: tolerance, time spent using) or the high ends of the MUD trait (abuse items: problems with the law and hazardous use) are comparatively low‐reliable indicators. This pattern not only supports other IRT findings that dependence criteria for SUDs (e.g. alcohol, marijuana, cocaine, hallucinogen, opioid) are not necessarily more severe indicators than abuse criteria (Gillespie et al., 2007; Piontek et al., 2011; Saha et al., 2006; Wu et al., 2009c), but also suggests that the proposal to use two criteria as a threshold for defining a MUD (APA, 2010) may not reliably identify marijuana users with a clear need for intensive treatment. Additional consideration of other health indicators (e.g. psychological distress) or marijuana use behaviors (e.g. weekly or early onset of use) appear more likely to provide information to guide effective use of more intensive interventions, such as outpatient or residential treatment. However, the low reliability of the most severe items – problems with the law (2.1% in marijuana users) and hazardous use (4.7%) – is related to their low prevalence. Nevertheless, both are likely indicators of involvement in costly interventions (e.g. involvement with the criminal justice system and treatment admissions due to accidents/injuries). Therefore, both may serve as useful screeners for identifying more problematic marijuana users with a need for early or more intensive interventions. The proposed suggestion to remove problems with the law from the criteria in DSM‐5 (APA, 2010) could be evaluated according to its impact on excluding some marijuana users from treatment.
Secondly, this study expands the scope of IRT studies by demonstrating an innovative means for linking IRT‐based severity estimates with clinically relevant variables to explore the utility of a dimensional approach for assessing MUDs. For example, one uncertainty with IRT‐based severity estimates for SUDs concerns their exclusive reliance on symptom‐level data, and severity parameters often correlate positively with rarity in symptom occurrences (e.g. Saha et al., 2006; Wu et al., 2009c). Using a dimensional (IRT/MIMIC) approach to link diagnostic data with health‐related measures, we found that this model‐based severity factor was positively associated with factors indicative of increased odds for marijuana use problems and treatment need (weekly or early onset of marijuana use, serious psychological distress, substance abuse treatment) (Anthony and Petronis, 1995; Baker et al., 2010; Gfroerer and Epstein, 1999; Gfroerer et al., 2002b; Smith et al., 2010; SAMHSA, 2008). Results also showed that the MUD level was more positively correlated with serious psychological distress than with major depression or poor self‐rated health, as associations with these latter two problems were reduced substantially once the model considered weekly and early marijuana use, serious psychological distress, and treatment use. Thus, marijuana users with multiple MUD symptoms are also likely to present with pervasive symptoms of psychological distress that require mental health treatment (SAMHSA, 2008).
Further, the findings highlight the need to monitor the trend and investigate factors associated with marijuana use and MUDs, especially for African‐Americans, Hispanics, and young adults. By comparing rates of MUDs in the 1991–1992 National Longitudinal Alcohol Epidemiologic Survey (NLAES) with rates in the 2001–2002 NESARC, Compton et al. (2004) reported an increase in marijuana use and MUDs in the 18–29 age group of African‐Americans and Hispanics but not in their White counterparts. Rates of treatment admissions for primary marijuana abuse also had increased from 12% in 1997 to 16% in the 2007 Treatment Episode Data Set (TEDS); primary marijuana abuse accounted for a greater proportion of all admissions for African‐Americans (21.9%) and Hispanics (16.7%) than for Whites (13.5%) (SAMHSA, 2009a).
How these increases in use relate to the increasing prevalence of legalized medical marijuana is unclear but worth study. To date, 15 states plus Washington, DC, have legalized medical marijuana and another 10 have pending legislation (ProCon.org, 2010). Given concerns about potential misuse/abuse of marijuana and psychiatric problems associated with repeated marijuana use (Kuepper et al., 2011; McGrath et al., 2010; Seely et al., 2011), future research should examine the effects of medical marijuana on state‐level variations in marijuana use and MUDs (e.g. changes in trends of marijuana use and MUDs by legalization status). Results suggest that adult marijuana users, particularly those who are African‐American, Hispanic, or who have mental health problems, may be vulnerable to adverse effects from marijuana use and warrant efforts to include them in the analysis and reporting of research findings.
Lastly, indication of gender‐ and race/ethnicity‐related DIF in self‐reports of MUD symptoms, along with similar evidence of DIF from diagnostic questions for alcohol and MUDs in other national surveys (NESARC and NLAES), suggest that DIF by respondents' gender or racial/ethnic backgrounds is an inherent measurement issue in self‐reports of abuse/dependence symptoms (Agrawal and Lynskey, 2007; Blanco et al., 2007; Carle, 2009, 2010; Grant et al., 2007; Wu et al., 2009c). Indeed, various cultural and societal backgrounds exert differential effects on respondents' interpretations of and response to survey questions (Johnson et al., 2006; Warnecke et al., 1997). Researchers thus have highlighted the need to address these confounding effects on the criteria for SUDs and addiction research (Carle, 2009, 2010; Room, 2006). However, it is not a common practice to consider DIF in research on SUD data, and research analyses via traditional regression procedures implicitly ignore the effects of DIF. The results presented here show that increased efforts are needed to consider DIF in the analysis of MUD and other SUD data, especially when population disparities in SUDs (gender, race/ethnicity) are key research questions. Finally, effective interventions and health policies for population subgroups rely on sound diagnostic tools and accurate health statistics. Therefore, systematic research is needed to test and develop questions that are truly applicable to different gender and racial/ethnic groups.
Study limitations and strengths
These findings should be interpreted with some caution. Like other national surveys, NSDUH relies on self‐reports. Although our focus on past‐year MUDs and health‐related variables might minimize recall errors, self‐reports could be influenced by memory errors and under‐reporting, and self‐reported SUDs have not been validated by clinicians. Longitudinal studies are needed to evaluate the clinical utility of model‐based MUDs and other SUDs. Results also do not apply to a small (<2%) group of incarcerated, institutionalized, or homeless adults who are not included in the NSDUH.
Additionally, “withdrawal” and “craving” (Kranzler et al., 1999) are not considered necessary for DSM‐IV MUDs and thus were not collected by NSDUH. Among drug‐dependent adults in addiction treatment, 16.7% of marijuana users report marijuana withdrawal symptoms in the past year, a symptom that had the lowest prevalence of all marijuana dependence criteria (Wu et al., 2009b). In a national sample of adults, 1.3% of alcohol users reported alcohol craving in the past year (Keyes et al., 2011). Although little is known about the true extent of marijuana‐specific withdrawal and craving in the general population of adults who used any marijuana, prior results suggest that both symptoms may be less prevalent than DSM‐IV MUD criteria. Additional research is needed to better describe their prevalence in the general population. Nonetheless, from our extensive IRT modeling experience, we have found that adding or removing one indicator of the same domain of the construct from the model has minimal effect on the size of parameters for other symptom indicators, and that it does not alter their direction. Other IRT research has also demonstrated this observation (Compton et al., 2009).
Lastly, it should be noted that IRT analysis of a given set of assessments provides model‐based estimates for a SUD that is constrained by the fact that it does not consider a wide range of psychosocial and health consequences. These model‐based estimates require additional research to describe their clinical utility, and the use of MIMIC modeling provides a means to relate the IRT‐based MUD severity with health‐related measures (Wu et al., 2009c).
NSDUH also has noteworthy strengths. It uses computer‐assisted interviewing methods to increase respondents' reporting of substance use behaviors, treatment use, and health status (Turner et al., 1998; SAMHSA, 2009a). The sample is representative of non‐institutionalized Americans, and it includes the largest sample of marijuana users presently available for this research. Results have a higher level of generalizability for population subgroups than results from a convenience sample.
Conclusions
Results suggest redundancy in multiple items for MUD criteria. Items closely related to indicators of impairment – role interference and giving up important activities – are the most reliable indicators for MUD symptoms and should be studied further for their utility as screeners. Because self‐reports are subject to measurement errors, additional consideration of other health indicators is needed to improve case ascertainment. MIMIC methods using fuller information from all available diagnostic data and incorporating differential item‐response functioning from self‐reports can improve understanding of population disparities for MUDs and other SUDs and provide additional information about treatment needs (Wu et al., 2009c).
Ethical approval
The study was exempt from Duke Institutional Review Board review due to the data being available in the public domain without any identification of personal information.
Declaration of interest statement
G.E. Woody is a member of the RADARS post‐marketing study scientific advisory group, whose job is to assess abuse of prescription medications. Denver Health administers RADARS, and pharmaceutical companies support its work. L.T. Wu has received research funding from NIH (USA) only to conduct research. The other authors have no conflicts of interest to disclose.
Acknowledgments
This work was made possible by research grants from the US National Institute on Drug Abuse of the National Institutes of Health (R01DA019623, R01DA019901, and R33DA027503 to L.T. Wu; HHSN271200522071C to D.G. Blazer; K05DA017009 and U10DA013043 to G.E. Woody). The sponsoring agency had no further role in the study design and analysis, the writing of the report, or the decision to submit the paper for publication. The Substance Abuse and Mental Health Data Archive provided the public‐use data files for NSDUH, which was sponsored by the Center for Behavioral Health Statistics and Quality of the Substance Abuse and Mental Health Services Administration. We thank Amanda McMillan for her editorial assistance.
References
- Agrawal A., Lynskey M.T. (2007) Does gender contribute to heterogeneity in criteria for cannabis abuse and dependence? Results from the national epidemiological survey on alcohol and related conditions. Drug and Alcohol Dependence, 88(2–3), 300–307. [DOI] [PMC free article] [PubMed] [Google Scholar]
- American Psychiatric Association (APA) . (2000) Diagnostic and Statistical Manual of Mental Disorders Fourth Edition, Text Revision. Washington, DC, American Psychiatric Publishing. [Google Scholar]
- American Psychiatric Association (APA) . (2010) Rationale for changes to substance‐related disorders, tentative new title of new combined section: addiction and related disorders. http://www.dsm5.org/ProposedRevisions/Pages/proposedrevision.aspx?rid=431# [15 October 2010].
- Andrews G., Slade T. (2001) Interpreting scores on the Kessler Psychological Distress Scale (K10). Australian and New Zealand Journal of Public Health, 25(6), 494–497. DOI: 10.1111/j.1467-842X.2001.tb00310.x [DOI] [PubMed] [Google Scholar]
- Anthony J.C., Petronis K.R. (1995) Early‐onset drug use and risk of later drug problems. Drug and Alcohol Dependence, 40(1), 9–15. DOI: 10.1016/0376-8716(95)01194-3 [DOI] [PubMed] [Google Scholar]
- Baker F. (2001) The Basics of Item Response Theory, College Park, MD, ERIC Clearinghouse on Assessment and Evaluation, University of Maryland. [Google Scholar]
- Baker A.L., Hides L., Lubman D.I. (2010) Treatment of cannabis use among people with psychotic or depressive disorders: a systematic review. The Journal of Clinical Psychiatry, 71(3), 247–254. [DOI] [PubMed] [Google Scholar]
- Blanco C., Harford T.C., Nunes E., Grant B., Hasin D. (2007) The latent structure of marijuana and cocaine use disorders: results from the National Longitudinal Alcohol Epidemiologic Survey (NLAES). Drug and Alcohol Dependence, 91(1), 91–96. DOI: 10.1016/j.drugalcdep.2007.04.003 [DOI] [PMC free article] [PubMed] [Google Scholar]
- Blazer D.G., Wu L.T. (2009) The epidemiology of substance use and disorders among middle aged and elderly community adults: national survey on drug use and health. The American Journal of Geriatric Psychiatry, 17(3), 237–245. DOI: 10.1097/JGP.0b013e318190b8ef [DOI] [PMC free article] [PubMed] [Google Scholar]
- Browne M.W., Cudeck R. (1993) Alternative ways of assessing model fit In Testing Structural Equation Models Bollen K.A., Long J.S. (eds), pp. 136–162, Newbury Park, CA: Sage Publications. [Google Scholar]
- Carle A.C. (2009) Cross‐cultural invalidity of alcohol dependence measurement across Hispanics and Caucasians in 2001 and 2002. Addictive Behavior, 34(1), 43–50. DOI: 10.1016/j.addbeh.2008.08.004 [DOI] [PMC free article] [PubMed] [Google Scholar]
- Carle A.C. (2010) Mitigating systematic measurement error in comparative effectiveness research in heterogeneous populations. Medical Care, 48(6 Suppl), S68–S74. DOI: 10.1097/MLR.0b013e3181d59557 [DOI] [PubMed] [Google Scholar]
- Cattell R.B. (1996) The scree test for the number of factors. Multivariate Behavioral Research, 1(2), 245–276. DOI: 10.1207/s15327906mbr0102_10 [DOI] [PubMed] [Google Scholar]
- Chromy J.R., Feder M., Gfroerer J., Hirsch E., Kennet J., Morton K.B., Piper L., Riggsbee B.H., Snodgrass J.A., Virag T.G., Yu F. (2009) Reliability of Key Measures in the National Survey on Drug Use and Health, DHHS Publication No. SMA 09–4425, Methodology Series M‐8, Rockville, MD, Substance Abuse and Mental Health Services Administration, Office of Applied Studies. [PubMed] [Google Scholar]
- Compton W.M., Grant B.F., Colliver J.D., Glantz M.D., Stinson F.S. (2004) Prevalence of marijuana use disorders in the United States: 1991–1992 and 2001–2002. Journal of the American Medical Association, 291(17), 2114–2121. DOI: 10.1001/jama.291.17.2114 [DOI] [PubMed] [Google Scholar]
- Compton W.M., Saha T.D., Conway K.P., Grant B.F. (2009) The role of cannabis use within a dimensional approach to cannabis use disorders. Drug and Alcohol Dependence, 100(3), 221–227. DOI: 10.1016/j.drugalcdep.2008.10.009 [DOI] [PMC free article] [PubMed] [Google Scholar]
- Degenhardt L., Lynskey M., Coffey C., Patton G. (2002) ‘Diagnostic orphans’ among young adult cannabis users: persons who report dependence symptoms but do not meet diagnostic criteria. Drug and Alcohol Dependence, 67(2), 205–212. DOI: 10.1016/S0376-8716(02)00064-9 [DOI] [PubMed] [Google Scholar]
- Edelen M.O., Reeve B.B. (2007) Applying item response theory (IRT) modeling to questionnaire development, evaluation, and refinement. Quality of Life Research, 16(Suppl 1), 5–18. DOI: 10.1007/s11136-007-9198-0 [DOI] [PubMed] [Google Scholar]
- Embretson S.E., Reise S.P. (2000) Item Response Theory for Psychologists, Mahwah, NJ, Lawrence Erlbaum. [Google Scholar]
- Epstein J.F. (2002) Substance Dependence, Abuse, and Treatment: Findings from the 2000 National Household Survey on Drug Abuse, DHHS Publication No. SMA 02–3642, Analytic Series A‐16, Rockville, MD, Substance Abuse and Mental Health Services Administration, Office of Applied Studies. [Google Scholar]
- Gfroerer J.C., Epstein J.F. (1999) Marijuana initiates and their impact on future drug abuse treatment need. Drug and Alcohol Dependence, 54(3), 229–237. DOI: 10.1016/S0376-8716(98)00167-7 [DOI] [PubMed] [Google Scholar]
- Gfroerer J.C., Eyerman J., Chromy J. (eds). (2002a) Redesigning an Ongoing National Household Survey: Methodological Issues, DHHS Publication No. SMA 03–3768, Rockville, MD, Substance Abuse and Mental Health Services Administration, Office of Applied Studies. [Google Scholar]
- Gfroerer J.C., Wu L.T., Penne M.A. (2002b) Initiation of Marijuana Use: Trends, Patterns, and Implications, DHHS Publication No. SMA 02–3711, Analytic Series: A‐17, Rockville, MD, Substance Abuse and Mental Health Services Administration, Office of Applied Studies. http://www.oas.samhsa.gov/MJinitiation/MJinitiation.pdf [1 October 2010].
- Gillespie N.A., Neale M.C., Prescott C.A., Aggen S.H., Kendler K.S. (2007) Factor and item‐response analysis DSM‐IV criteria for abuse of and dependence on cannabis, cocaine, hallucinogens, sedatives, stimulants and opioids. Addiction, 102(6), 920–930. DOI: 10.1111/j.1360-0443.2007.01804.x [DOI] [PubMed] [Google Scholar]
- Grant B.F., Harford T.C., Muthén B.O., Yi H.Y., Hasin D.S., Stinson F.S. (2007) DSM‐IV alcohol dependence and abuse: further evidence of validity in the general population. Drug and Alcohol Dependence, 86(2–3), 154–166. DOI: 10.1016/j.drugalcdep.2006.05.019 [DOI] [PubMed] [Google Scholar]
- Green K.M., Doherty E.E., Stuart E.A., Ensminger M.E. (2010) Does heavy adolescent marijuana use lead to criminal involvement in adulthood? Evidence from a multiwave longitudinal study of urban African Americans. Drug and Alcohol Dependence, 112(1–2), 117–125. [DOI] [PMC free article] [PubMed] [Google Scholar]
- Harrison L.D., Martin S.S., Enev T., Harrington D. (2007) Comparing Drug Testing and Self‐report of Drug Use among Youths and Young Adults in the General Population, DHHS Publication No. SMA 07–4249, Methodology Series M‐7, Rockville, MD, Substance Abuse and Mental Health Services Administration, Office of Applied Studies. [Google Scholar]
- Hasin D.S., Hatzenbueler M., Smith S., Grant B.F. (2005) Co‐occurring DSM‐IV drug abuse in DSM‐IV drug dependence: results from the National Epidemiologic Survey on Alcohol and Related Conditions. Drug and Alcohol Dependence, 80(1), 117–123. DOI: 10.1016/j.drugalcdep.2005.03.010 [DOI] [PubMed] [Google Scholar]
- Hu L., Bentler P.M. (1999) Cutoff criteria for fit indexes in covariance structure analysis: conventional criteria versus new alternatives. Structural Equation Modeling, 6(1), 1–55. DOI: 10.1080/10705519909540118 [DOI] [Google Scholar]
- Johnson T.P., Cho Y.I., Holbrook A.L., O'Rourke D., Warnecke R.B., Chavez N. (2006) Cultural variability in the effects of question design features on respondent comprehension of health surveys. Annals of Epidemiology, 16(9), 661–668. DOI: 10.1016/j.annepidem.2005.11.011 [DOI] [PubMed] [Google Scholar]
- Kessler R.C., Andrews G., Colpe L.J., Hiripi E., Mroczek D.K., Normand S.L., Walters E.E., Zaslavsky A.M. (2002) Short screening scales to monitor population prevalences and trends in non‐specific psychological distress. Psychological Medicine, 32(6), 959–976. DOI: 10.1017/S0033291702006074 [DOI] [PubMed] [Google Scholar]
- Kessler R.C., Barker P.R., Colpe L.J., Epstein J.F., Gfroerer J.C., Hiripi E., Howes M.J., Normand S.L., Manderscheid R.W., Walters E.E., Zaslavsky A.M. (2003) Screening for serious mental illness in the general population. Archives of General Psychiatry, 60(2), 184–189. DOI: 10.1001/archpsyc.60.2.184 [DOI] [PubMed] [Google Scholar]
- Kessler R., Tat W., Demler M., Walters E. (2005) Prevalence, severity, and comorbidity of 12‐month DSM‐IV disorders in the National Comorbidity Survey Replication. Archives of General Psychiatry, 62(6), 617–627. DOI: 10.1001/archpsyc.62.6.617 [DOI] [PMC free article] [PubMed] [Google Scholar]
- Keyes K.M., Krueger R.F., Grant B.F., Hasin D.S. (2011) Alcohol craving and the dimensionality of alcohol disorders. Psychological Medicine, 41(3), 629–640, DOI: 10.1017/S003329171000053X [DOI] [PMC free article] [PubMed] [Google Scholar]
- Kranzler H.R., Mulgrew C.L., Modesto‐Lowe V., Burleson J.A. (1999) Validity of the Obsessive Compulsive Drinking Scale (OCDS): does craving predict drinking behavior? Alcoholism, Clinical and Experimental Research, 23(1), 108–114. DOI: 10.1111/j.1530-0277.1999.tb04030.x [DOI] [PubMed] [Google Scholar]
- Kuepper R., van Os J., Lieb R., Wittchen H.U., Höfler M., Henquet C. (2011) Continued cannabis use and risk of incidence and persistence of psychotic symptoms: 10‐year follow‐up cohort study. British Medical Journal, 342, d738 DOI: 10.1136/bmj.d738 [DOI] [PMC free article] [PubMed] [Google Scholar]
- Lynskey M.T., Agrawal A. (2007) Psychometric properties of DSM assessments of illicit drug abuse and dependence: results from the National Epidemiologic Survey on Alcohol and Related Conditions (NESARC). Psychological Medicine, 37(9), 1345–1355. DOI: 10.1017/S0033291707000396 [DOI] [PubMed] [Google Scholar]
- Lynskey M.T., Glowinski A.L., Todorov A.A., Bucholz K.K., Madden P.A., Nelson E.C., Statham D.J., Martin N.G., Heath A.C. (2004) Major depressive disorder, suicidal ideation, and suicide attempt in twins discordant for cannabis dependence and early‐onset cannabis use. Archives of General Psychiatry, 61(10), 1026–1032. DOI: 10.1001/archpsyc.61.10.1026 [DOI] [PubMed] [Google Scholar]
- McGrath J., Welham J., Scott J., Varghese D., Degenhardt L., Hayatbakhsh M.R., Alati R., Williams G.M., Bor W., Najman J.M. (2010) Association between cannabis use and psychosis‐related outcomes using sibling pair analysis in a cohort of young adults. Archives of General Psychiatry, 67(5), 440–447. DOI: 10.1001/archgenpsychiatry.2010.6 [DOI] [PubMed] [Google Scholar]
- Muthén B.O., Muthén L.K. (2007) Mplus: Statistical Analysis with Latent Variables (version 4.2.1), Los Angeles, CA, Muthén and Muthén, Inc. [Google Scholar]
- National Center on Addiction and Substance Abuse (NCASA) . (2008) Non‐medical Marijuana III: Rite of Passage or Russian Roulette?, New York, The National Center on Addiction and Substance Abuse at Columbia University. [Google Scholar]
- Piontek D., Kraus L., Legleye S., Bühringer G. (2011) The validity of DSM‐IV cannabis abuse and dependence criteria in adolescents and the value of additional cannabis use indicators. Addiction, 106(6), 1137–1145. DOI: 10.1111/j.1360-0443.2010.03359.x [DOI] [PubMed] [Google Scholar]
- ProCon.org . (2010) Should Marijuana be a Medical Option? http://medicalmarijuana.procon.org/ [13 November 2010].
- Research Triangle Institute . (2006) SUDAAN User's Manual, Release 9.0, Research Triangle Park, NC, Research Triangle Institute. [Google Scholar]
- Room R. (2006) Taking account of cultural and societal influences on substance use diagnoses and criteria. Addiction, 101(suppl 1), 31–39. DOI: 10.1111/j.1360-0443.2006.01597.x [DOI] [PubMed] [Google Scholar]
- Saha T.D., Chou S.P., Grant B.F. (2006) Toward an alcohol use disorder continuum using item response theory: results from the National Epidemiologic Survey on Alcohol and Related Conditions. Psychological Medicine, 36(7), 931–941. DOI: 10.1017/S003329170600746X [DOI] [PubMed] [Google Scholar]
- Schatzberg A.F. (2010) Why is DSM‐5 being delayed? Psychiatric News, 45(1), 3. [Google Scholar]
- Seely K.A., Prather P.L., James L.P., Moran J.H. (2011) Marijuana‐based drugs: innovative therapeutics or designer drugs of abuse? Molecular Interventions, 11(1), 36–51. [DOI] [PMC free article] [PubMed] [Google Scholar]
- Shapiro G.K., Buckley‐Hunter L. (2010) What every adolescent needs to know: cannabis can cause psychosis. Journal of Psychosomatic Research, 69(6), 533–539. DOI: 10.1016/j.jpsychores.2010.04.002 [DOI] [PubMed] [Google Scholar]
- Smith P.M., Glazier R.H., Sibley L.M. (2010) The predictors of self‐rated health and the relationship between self‐rated health and health service needs are similar across socioeconomic groups in Canada. Journal of Clinical Epidemiology, 63, 412–421. DOI: 10.1016/j.jpsychores.2010.04.002 [DOI] [PubMed] [Google Scholar]
- Substance Abuse and Mental Health Services Administration (SAMHSA) . (2008) The NSDUH Report: Serious Psychological Distress and Receipt of Mental Health Services, Rockville, MD, Office of Applied Studies, Substance Abuse and Mental Health Services. [Google Scholar]
- Substance Abuse and Mental Health Services Administration (SAMHSA) . (2009a) Results from the 2008 National Survey on Drug Use and Health: National Findings, Rockville, MD, Office of Applied Studies, Substance Abuse and Mental Health Services. [Google Scholar]
- Substance Abuse and Mental Health Services Administration (SAMHSA) . (2009b) Treatment Episode Data Set (TEDS) Highlights—2007 National Admissions to Substance Abuse Treatment Services, OAS Series #S‐45, HHS Publication No. (SMA) 09–4360, Rockville, MD, Substance Abuse and Mental Health Services. [Google Scholar]
- Turner C.F., Ku L., Rogers S.M., Lindberg L.D., Pleck J.H., Sonenstein F. (1998) Adolescent sexual behavior, drug use, and violence: increased reporting with computer survey technology. Science, 280(5365), 867–873. DOI: 10.1126/science.280.5365.867 [DOI] [PubMed] [Google Scholar]
- Warnecke R.B., Johnson T.P., Chávez N., Sudman S., O'Rourke D.P., Lacey L., Horm J. (1997) Improving question wording in surveys of culturally diverse populations. Annals of Epidemiology, 7(5), 334–342. DOI: 10.1016/S1047-2797(97)00030-6 [DOI] [PubMed] [Google Scholar]
- Wu L.T., Pan J.J., Blazer D.G., Tai B., Brooner R.K., Stitzer M.L., Patkar A.A., Blaine J.D. (2009a) The construct and measurement equivalence of cocaine and opioid dependences: a National Drug Abuse Treatment Clinical Trials Network (CTN) study. Drug and Alcohol Dependence, 103(3), 114–123. DOI: 10.1016/j.drugalcdep.2009.01.018 [DOI] [PMC free article] [PubMed] [Google Scholar]
- Wu L.T., Pan J.J., Blazer D.G., Tai B., Stitzer M.L., Brooner R.K., Woody G.E., Patkar A.A., Blaine J.D. (2009b) An item response theory modeling of alcohol and marijuana dependences: a National Drug Abuse Treatment Clinical Trials Network study. Journal of Studies on Alcohol and Drugs, 70(3), 414–425. [DOI] [PMC free article] [PubMed] [Google Scholar]
- Wu L.T., Pan J.J., Blazer D.G., Tai B., Stitzer M.L., Woody G.E. (2010a) Using a latent variable approach to inform gender and racial/ethnic differences in cocaine dependence: a National Drug Abuse Treatment Clinical Trials Network study. Journal of Substance Abuse Treatment, 38(Suppl 1), S70–S79. DOI: 10.1016/j.jsat.2009.12.011 [DOI] [PMC free article] [PubMed] [Google Scholar]
- Wu L.T., Pan J.J., Yang C., Reeve B.B., Blazer D.G. (2010b) An item response theory analysis of DSM‐IV criteria for hallucinogen abuse and dependence in adolescents. Addictive Behaviors, 35, 273–277. DOI: 10.1016/j.addbeh.2009.10.009 [DOI] [PMC free article] [PubMed] [Google Scholar]
- Wu L.T., Ringwalt C.L. (2004) Alcohol dependence and use of treatment services among women in the community. The American Journal of Psychiatry, 161(10), 1790–1797. DOI: 10.1176/appi.ajp.161.10.1790 [DOI] [PMC free article] [PubMed] [Google Scholar]
- Wu L.T., Ringwalt C.L., Mannelli P., Patkar A.A. (2008) Hallucinogen use disorders among adult users of MDMA and other hallucinogens. American Journal of Addiction, 17(5), 354–363. DOI: 10.1080/10550490802269064 [DOI] [PMC free article] [PubMed] [Google Scholar]
- Wu L.T., Ringwalt C.L., Yang C., Reeve B.B., Pan J.J., Blazer D.G. (2009c) Construct and differential item functioning in the assessment of prescription opioid use disorders among American adolescents. Journal of the American Academy of Child and Adolescent Psychiatry, 48(5), 563–572. DOI: 10.1097/CHI.0b013e31819e3f45 [DOI] [PMC free article] [PubMed] [Google Scholar]