

Background: Family 1 carbohydrate-binding modules (CBMs) bind selectively to the hydrophobic surfaces of cellulose.
Results: Simulations have shown that the planar face of the CBM binds preferentially to the hydrophobic face.
Conclusion: Thermodynamic driving forces enable transfer of the CBM from the hydrophilic to hydrophobic surfaces.
Significance: Selectivity of CBM provides access of cellulases to active surfaces of cellulose.
Keywords: Cellulase, Molecular Dynamics, Molecular Modeling, Protein Dynamics, Protein Structure, Cel7A, Carbohydrate-binding Module, Cellulose, Hypocrea jecorina, Trichoderma reesei
Abstract
Cellulase enzymes often contain carbohydrate-binding modules (CBMs) for binding to cellulose. The mechanisms by which CBMs recognize specific surfaces of cellulose and aid in deconstruction are essential to understand cellulase action. The Family 1 CBM from the Trichoderma reesei Family 7 cellobiohydrolase, Cel7A, is known to selectively bind to hydrophobic surfaces of native cellulose. It is most commonly suggested that three aromatic residues identify the planar binding face of this CBM, but several recent studies have challenged this hypothesis. Here, we use molecular simulation to study the CBM binding orientation and affinity on hydrophilic and hydrophobic cellulose surfaces. Roughly 43 μs of molecular dynamics simulations were conducted, which enables statistically significant observations. We quantify the fractions of the CBMs that detach from crystal surfaces or diffuse to other surfaces, the diffusivity along the hydrophobic surface, and the overall orientation of the CBM on both hydrophobic and hydrophilic faces. The simulations demonstrate that there is a thermodynamic driving force for the Cel7A CBM to bind preferentially to the hydrophobic surface of cellulose relative to hydrophilic surfaces. In addition, the simulations demonstrate that the CBM can diffuse from hydrophilic surfaces to the hydrophobic surface, whereas the reverse transition is not observed. Lastly, our simulations suggest that the flat faces of Family 1 CBMs are the preferred binding surfaces. These results enhance our understanding of how Family 1 CBMs interact with and recognize specific cellulose surfaces and provide insights into the initial events of cellulase adsorption and diffusion on cellulose.
Introduction
Cellulase enzymes are responsible for much of the cellulose (and hence carbon) turnover in the biosphere. Fungal cellulases are key starting points for enzyme engineering efforts in biofuels development (1–3), especially following the decades of work conducted on characterization of the Trichoderma reesei (Hypocrea jecorina) cellulase mixture (4–21) and related filamentous fungi (22–24). Many fungal cellulases are multimodular proteins with catalytic domains (CDs)2 that are connected to carbohydrate-binding modules (CBMs) by flexible, glycosylated linkers (7, 25, 26). In most fungal cellulases, the CBMs are from the CBM Family 1 (CBM1). These are roughly 36-residue proteins usually containing two or three disulfide bonds and a planar face containing three aligned aromatic residues and several polar residues (5). This planar face of CBM1 has long been hypothesized to be the cellulose-binding face (5, 9, 27, 28). It has been proposed that the wedge face opposite the planar face can also bind to cellulose (29, 30). At minimum, CBMs are responsible for increasing the local concentration of the enzyme near the substrate. Additional roles for CBMs that have been proposed in the literature include targeting a specific feature of the substrate (31) and disruption of cellulose crystalline packing (32, 33), although evidence for the latter is not yet definitive (33, 34).
In the process of cellulose hydrolysis by multimodular cellulases, the initial binding event is likely mediated by the CBM (35). For CBM1 from the T. reesei Family 7 cellobiohydrolase (Cel7A), it has been shown experimentally that the CBM binds to the hydrophobic surface of cellulose Iα (28). With simulation, we later suggested that this CBM displays energy wells every 1 nm on the hydrophobic surface (100 surface) of cellulose Iβ, which is structurally nearly identical to the hydrophobic surface (110 surface) of cellulose Iα (35, 36). However, cellulose microfibrils also contain hydrophilic surfaces. Depending on the relative areas of the exposed microfibril surfaces, an enzyme in solution will likely first encounter a hydrophilic surface of the substrate. From there, the CBM can either detach from the cellulose microfibril or diffuse to another surface (e.g., the hydrophobic surface). For example, in the 36-chain cellulose microfibril shown in Fig. 1A that was constructed to approximate a cylindrical cross-section as perhaps found in plants, the hydrophobic surfaces (three chains at top and bottom) account for only 38% of the total surface area. In the 16-chain cellulose microfibril shown in Fig. 1B, only 15% of the surface is hydrophobic (single chains at top and bottom). Microfibrils from algae and tunicates also contain mostly hydrophilic surfaces (37–42). Thus, it is more likely that the initial CBM binding events from solution will be to hydrophilic surfaces on microfibrils with cross-sections such as these.
FIGURE 1.

Starting points for MD simulations of the Cel7A CBM1 on the surfaces of cellulose microfibrils. The CBMs are shown in green or orange, whereas the tyrosine residues on the planar face of the CBM are shown in purple. A, the 36-chain microfibril simulations were started with the CBM in the center of the hydrophobic (100) surface or one of two positions on (110) or (010) hydrophilic surfaces. B, for the 16-chain microfibril, simulations were started with the CBM in the center of the (110) and (010) hydrophilic surfaces and on the hydrophobic (100) surface containing a single chain. In all simulations, the microfibril was reoriented such that the z direction is normal to the starting surface, the x direction is along the cellulose fiber axis, and the y direction is perpendicular to the chains in the plane of the starting surface.
To our knowledge, the thermodynamic driving forces relevant to the CBM binding to different surfaces of cellulose or detachment from the surfaces have not been studied, nor has the preferred orientation of the CBM on each of the different crystal surfaces been elucidated. Moreover, it has yet to be confirmed that the planar face in the Cel7A CBM interacts with the hydrophobic surface of cellulose directly, and the unbiased, one-dimensional diffusion coefficients of the CBM have not been measured. All of these problems represent quite challenging experiments, because these are transient, molecular level steps of a small protein domain on a heterogeneous substrate. Computer simulation, however, can probe these types of physical steps directly (3, 34, 43–47).
Here, we apply molecular dynamics (MD) and free energy simulations to investigate questions related to CBM-cellulose interactions. These questions are concerned with the behavior of the CBM on the different crystal surfaces after binding and the preferred orientations of the CBM on different surfaces. Specific questions addressed in this study include: (a) Does the CBM1 diffuse to the hydrophobic face when it binds to a hydrophilic face, or does it unbind and detach from the cellulose crystal surface rather than diffuse along the surface? (b) What are the relative binding free energies to different cellulose crystal surfaces? (c) How does the shape and size of the hydrophobic surface impact the CBM binding behavior? (d) Does the planar face of the CBM1 selectively adsorb to the hydrophobic face of cellulose I or is the CBM in a different orientation than previously hypothesized from the NMR structure (5)? If the CBM1 binds in a nonfavorable orientation, can the CBM realign itself without detaching? (e) How does the CBM1 behave once bound to the hydrophobic surface of cellulose I? What are the one-dimensional diffusion coefficients parallel and perpendicular to the cellulose chains?
The MD and free energy simulations presented here represent a significantly larger data set than all previous simulation studies of the same or similar systems. We confirm that the CBM1 prefers the hydrophobic surface of cellulose I and demonstrate that the CBM can diffuse from hydrophilic faces to the hydrophobic faces on a time scale of tens to hundreds of nanoseconds. The thermodynamic driving force for this surface to surface transition is quantified and is shown to be predominantly enthalpic in nature. We find that the orientation of the CBM with the flat face of the CBM bound to the cellulose surface, as previously hypothesized from the NMR structure (5), is likely to be correct. Lastly, we show that the CBM readily diffuses along the microfibril axis on a single chain of cellulose but does not move from one chain to another as readily. These results provide insights into the binding events related to CBM-cellulose association and suggest a means for the CBM to drive the CD close to the hydrophobic face such that the CD can bind to a free end of a cellulose chain.
MATERIALS AND METHODS
All of the MD simulations were conducted using the CHARMM27 force field with the CMAP correction (52, 53) for the CBM, the TIP3P water model (54, 55), and the C35 force field for the carbohydrates (56, 57). For the MD simulations, the CHAMBER program (58) was used to convert the CHARMM input files to an Amber-readable format, and the Amber PMEMD module was used to run the MD simulations (59). SHAKE was used to fix the distance of hydrogen atoms covalently linked to heavy atoms (60) and a 2-fs time step was used for all MD simulations. Particle Mesh Ewald was applied for long range electrostatics with a grid size of (78, 62, 78) for 36-chain microfibril simulations and (64, 48, 80) for 16-chain simulations (61).
The box size for the simulations with 36-chain microfibrils and the CBM is 78 Å × 62 Å × 78 Å with ∼38,000 atoms, whereas for the 16-chain microfibrils, the dimensions are 62 Å × 47 Å × 78 Å with 23,000 atoms. The nonbonded cutoff was 8 Å, and the Ewald coefficient was 0.35. During the MD simulations, the end carbon atoms of each chain were harmonically restrained with a force constant of 100 kcal mol−1 Å−2 to prevent delamination and any additional structural changes. The CBM was placed on the cellulose, and the system was minimized. The protein and substrate were then resolvated and equilibrated with the Nosé-Hoover thermostat and barostat at 1 atm and 300 K (62–64).
MD umbrella sampling was used to examine the surface-to-surface transitions (65, 66). A reaction coordinate was defined in which the CBM transferred from position B on the (110) surface to the center of the (100) surface of the 36-chain microfibril, similar to a configuration shown on the (100) surface in Fig. 1A. The reaction coordinate was the distance from the center-of-mass of the three tyrosine residues on the planar face (Tyr-5, Tyr-31, and Tyr-32) to a plane perpendicular to the (110) surface. The plane was located on and parallel to a chain of the (110) surface four chains removed from the (100) surface. Fifty-eight umbrella windows were sampled between these end points. The window centers were spaced 0.5 Å apart, and the system was restrained with a harmonic force constant of 2.5 kcal mol−1 Å−2. Because of the greater mobility on the (110) surface, five independent simulations were conducted in each window on this surface, whereas only one simulation was conducted at the umbrella sampling windows on the (100) surface. A harmonic restraining force constant of 0.1 kcal mol−1 Å−2 on the center of mass of the CBM was used to prevent it from moving parallel to the cellulose microfibril axis. Simulations in each window were conducted for 10 ns. The results were analyzed using WHAM (67).
RESULTS AND DISCUSSION
Model Construction and Simulation Approach
The nonglycosylated CBM1 structure was taken from an NMR study (5). The cellulose microfibrils were built from the crystal structure of cellulose Iβ (48).
Cellulose microfibrils were constructed with 36 and 16 cellulose chains, as shown in Fig. 1. In both cases, the microfibrils were equilibrated for 10 ns in water without a CBM present. During equilibration, the microfibrils contained chains of cellulose that were 40 glucose residues long. No restraints were placed on the cellulose during equilibration, which allows the microfibrils to twist as is consistent with earlier studies (43, 49). After equilibration, the microfibril ends were trimmed such that only the central 12 residues of each chain were retained. These truncated microfibrils were harmonically restrained at the ends and used for the simulations with the CBM, thus reducing edge effects and computational cost. We note that a recent study from our group indicated for the C35 force field in similar conditions, 10 ns is sufficient for the cellulose surface to equilibrate (49). Because we are studying interactions of a protein on the cellulose surface, this was deemed an adequate equilibration time.
Two types of simulations were run: (a) unrestricted simulations were conducted with the CBM on different surfaces of the cellulose microfibrils shown in Fig. 1; sufficient MD simulations were conducted from each starting point such that that the transfer rates could be estimated with adequate statistics from a given surface to another or to solution; and (b) umbrella sampling simulations were conducted along a path where the CBM translated from the hydrophilic (110) surface to the hydrophobic (100) surface of the 36-chain microfibril. These restrained simulations were used to estimate the relative free energy difference between CBM adsorption on the hydrophobic (100) surface and the hydrophilic (110) surface.
For the unrestricted simulations, the CBM was placed in contact with the surface of interest, as shown in Fig. 1. MD simulations were conducted for at least 100 ns each. Equivalent surfaces are located on the opposite sides of the microfibrils so there are only two unique hydrophilic surfaces and one hydrophobic surface on each microfibril. Note that the hydrophobic surface on the 36-chain microfibril has three chains, whereas the 16-chain microfibril has only one chain. We conducted simulations with the planar face of the CBM containing three tyrosine residues (Tyr-5, Tyr-31, and Tyr-32) in contact with the cellulose microfibril, as shown in Fig. 1. Note that two starting positions were used on hydrophilic surfaces in the 36-chain microfibril. One starting position had the CBM located two chains away from the hydrophobic surface, and the second position was located four chains away from the hydrophobic surface. Forty simulations were started at each of these positions with randomly seeded velocities drawn from the Boltzmann distribution.
It has been proposed that the “top” of the CBM1 (opposite the planar face) has a binding site that can bind to carbohydrates (29, 30). We also investigated the binding of this wedge face to the 36-chain microfibril. We conducted a potential energy scan on the (100) surface as a function of the rotation of the CBM about an axis roughly coinciding with the three tyrosine residues. Two minima were identified: one with the planar face of the CBM on the (100) surface and the other with the wedge face of the CBM facing the (100) surface. A description of these calculations and a plot of the potential energy surface are provided in supplemental Fig. S1. To investigate relative binding free energies, MD simulations were also conducted with this top face of the CBM on the hydrophobic and hydrophilic surfaces of the 36-chain cellulose microfibril, as detailed in Table 1.
TABLE 1.
MD simulations
| Unrestricted simulations |
| 36-Chain fibril, 40 simulations, 100 ns each |
| (100) |
| (110) position A |
| (110) position B |
| (010) position A |
| (010) position B |
| (100) CBM wedge face bindinga |
| (110) position A, CBM wedge face bindinga |
| (010) position B, CBM wedge face bindinga |
| 16-Chain fibril, 40 simulations, 80 ns each |
| (100)b |
| (110) |
| (01̄0) |
| Umbrella sampling |
| 154 simulations, 10 ns each |
a In this configuration the planar face of the CBM was facing away from the surface of the cellulose microfibril.
b Several simulations started on the (100) surface of the 16-chain microfibril were run for approximately 140 ns.
Kinetic Measurements
This section describes the unrestricted simulations listed in Table 1. These simulations suggest that the CBM prefers binding with its planar face on the hydrophobic (100) surface. During simulations started on the (100) surface, the CBM remains on this surface during all forty 100-ns simulations on the 36-chain microfibril. In contrast, during simulations started with the CBM on the hydrophilic surfaces, the CBM often either leaves the microfibril or migrates to the (100) surface, as shown below.
Fig. 2 shows the time evolution of simulations started with the CBM on the hydrophilic surfaces of the 36-chain microfibril. At 10-ns intervals, the CBM location was classified as either remaining on the initial cellulose surface, desorbed from the microfibril, or transferred to the hydrophobic (100) surface. The data in Fig. 2 are averages of the occurrences of these states over the 40 simulations in a given set. The end points of simulations for each simulation set are shown in Table 2. As shown in Table 2, the observation that the CBM has a much higher probability of remaining on the (100) surface compared with the hydrophilic surfaces suggests that it has a thermodynamic preference for binding to the hydrophobic surface.
FIGURE 2.

Time evolution of the simulations with the CBM started on the hydrophilic surfaces of the 36-chain microfibril. The plots are the fractions of the 40 simulations in which the CBM remained on the initial hydrophilic surface, transferred to the (100) surface, or desorbed from the microfibril. A, simulations in which the CBM was initially placed on the (010) surface at position A (solid lines) or position B (dotted lines). B, simulations were started on the (110) surface at position A (solid lines) or position B (dotted lines). Fig. 1 shows the initial CBM positions on the microfibril.
TABLE 2.
Results of kinetic simulations
| Starting surface | Remaineda | Desorbed | Transferred to (100) |
|---|---|---|---|
| 36-Chain microfibril | |||
| (100) | 1.0 | 0.00 | |
| (110) A | 0.45 | 0.22 | 0.33 |
| (110) B | 0.40 | 0.42 | 0.18 |
| (010) A | 0.14 | 0.53 | 0.33 |
| (010) Bb | 0.22 | 0.72 | 0.00 |
| 16-Chain microfibril | |||
| (100) | 0.90 | 0.00 | 0.10 (to 110) |
| (010) | 0.26 | 0.51 | 0.17 |
| (01̄0) | 0.41 | 0.44 | 0.15 |
| 36-Chain microfibril: CBM inverted | |||
| (100)c | 0.70 | 0.20 | |
| (110) A | 0.37 | 0.35 | 0.28 |
| (010) B | 0.90 | 0.10 | 0.00 |
a Average occurrence after 100-ns simulations.
b Some of the simulations started with the CBM on the (010) surface at position B resulted in the CBM transferring to the (110) surface.
c 10% of the simulations started in the inverted position (with the wedge face on the (100) surface) flipped so that the planar face of the CBM faced the cellulose surface.
Simulations with the CBM on the 16-chain microfibril produced results similar to those for the 36-chain microfibril. As shown in Table 2, the CBM binds stably on the one-chain (100) surface, although not as stably as to the three-chain (100) surface of the 36-chain microfibril. In 10% of the simulations, the CBM rotated so that the planar face of the CBM was in contact with both a hydrophilic surface and the chain in the (100) surface. In contrast, the CBM had a high probability of either leaving the microfibril or transferring to the (100) surface when started on the hydrophilic surfaces of this 16-chain microfibril. Fig. 3 shows the kinetic data from 40 unrestrained simulations conducted for 80 ns on the (110) and the (01̄0) surfaces, and Table 2 compares the results at the end of the simulations. As with the 36-chain microfibril, these data suggest that the CBM has a preference for the (100) surface.
FIGURE 3.

Time evolution of the simulations with the CBM started on the hydrophilic surfaces of the 16-chain microfibril. The plots are the fractions of the 40 simulations in which the CBM remained on the same surface, transferred to the (100) surface, or desorbed from the microfibril. The solid lines are for the simulations started on the (110) surface, whereas the dotted lines were started on the (11̄0) surface. Fig. 1 shows the starting configurations and the initial CBM positions on the microfibril.
Dynamics of Transfer to (100) Surface
Analysis of the simulations where a transition from a hydrophilic surface to the hydrophobic surface indicates that rotation (rather than just translation) of the CBM is often an antecedent to the transition. During the simulations where the CBM transfers from the (110) to (100) surface, 92% of the simulations starting from point A and 100% from point B rotated about the axis normal to the cellulose surface as illustrated in Fig. 4, which shows snapshots from a simulation in which the CBM transferred from the (110) surface to the (100) surface. From point A on the (010) surface, 83% of the simulations rotated before transferring to (100). By rotating, the planar surface of the CBM is exposed to a broader range of the cellulose surface than by translation. It is observed that the CBM can rotate so that its planar face is in contact with the (100) surface, which is often followed by transfer. Supplemental Movies S1 and S2 show this transition.
FIGURE 4.
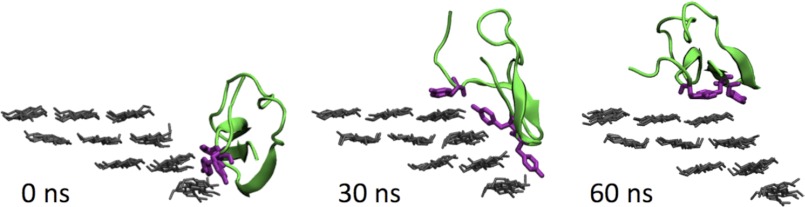
Snapshots of the CBM during a typical simulation in which the CBM transfers from the (110) surface to the (100) surface of the 36-chain microfibril.
Proximity of the CBM to the (100) surface also affects its ability to transfer from the hydrophilic surfaces. Because the CBM in position A is closer than in position B to the (100) surface, simulations starting at position A are more likely to result in transfer to (100) at the time scales examined here.
Free Energy Calculations for Surface to Surface Transitions
To quantify the free energy difference for CBM binding to the hydrophobic and hydrophilic surfaces of the 36-chain microfibril, MD umbrella sampling was conducted. The potential of mean force, or free energy, from (110) to (100) is shown in Fig. 5. The potential of mean force does not provide an accurate estimate of the barriers for the transition from the (110) surface to the (100) surface because the reaction coordinate may not be correct for the actual transition. However, a comparison of the minima is reliable given convergence along the reaction coordinate. The potential of mean force shows that the difference in free energy between binding of the CBM to the (110) surface and the (100) surface is ∼2.5 kcal mol−1. This difference in free energy is consistent with the observations from the unrestrained simulations, which show a nonreversible transfer to the (100) surface on the time scale of these calculations. The 2.5 kcal mol−1 difference is between binding to the third cellulose chain of the (110) surface and the most favorable binding to the middle chain of the (100) surface. Binding to the second chain of the (110) surface is ∼1 kcal mol−1 less stable than the third chain, and binding to the corner chain of the (100) surface is 1 kcal mol−1 less stable than binding to the center chain. This is consistent with the unrestricted simulations on the (100) surface, in which less than 3% of the simulations starting on the center chain transferred to the corner chain (see below).
FIGURE 5.

The free energy for the transfer of the CBM from the (110) surface to the (100) surface. Snapshots from each basin are shown.
Enthalpic Driving Forces for CBM Selectivity
Fig. 6 shows the interaction energy between the CBM and cellulose, which exhibits differences in binding to the hydrophobic and hydrophilic surfaces of cellulose. Here we consider the interaction energies for the simulations in which the CBM transferred from the hydrophilic faces to the (100) face. Eight simulations are used for this analysis where the CBM started on the (110) surface and transferred the (100) surface of the 36-chain cellulose microfibril. The interaction energy between the CBM and cellulose for these simulations shows a clear trend to lower energy as the CBM moves from the (110) to the (100) surface. Fig. 6 shows histograms of the average interaction energy during the first 20 ns of the simulations, on the (110) surface, and during the last 20 ns of the simulations, on the (100) surface. The electrostatic energy does not change significantly between the (110) surface and the (100) surface, whereas the van der Waals energy decreases significantly (15 to 20 kcal mol−1). This is likely due to a higher number of contacts between the CBM and the cellulose microfibril on the (100) surface because of a closer proximity between the CBM and cellulose as shown in supplemental Fig. S2. Similar results for simulations started on the (010) surface are presented in supplemental Fig. S3. We also considered the total energy of the system, which is shown in supplemental Fig. S4. This analysis includes protein-cellulose, cellulose-water, protein-water, and all self-interactions. Overall, for the simulations that exhibit a transfer of the CBM from the hydrophilic face to the hydrophobic face, we observed a decrease in the total energy of the system. These results taken together suggest that the CBM selectivity for and desolvation of the hydrophobic surface combined with solvation of the hydrophilic surface is primarily caused by a favorable enthalpic driving force.
FIGURE 6.

Averaged distribution of interaction energies at the beginning and end of simulations on the 36-chain microfibril in which the CBM transferred from the (110) surface to the (100) surface. A, electrostatic energy. B, Van der Waals energy.
CBM Binding Orientation on (100) Surface
To more fully explore the selectivity of the CBM toward the surfaces of cellulose, simulations were conducted in which the planar face of the CBM was directed toward the solvent and away from the cellulose. The potential energy for this orientation is shown in supplemental Fig. S1. Unrestrained MD simulations suggest that this orientation on all cellulose surfaces is thermodynamically less preferred than with the planar face of the CBM on the (100) surface. Fig. 7 shows a kinetic plot obtained from simulations in which the CBM was started in the inverted position on the (100) surface. Table 2 contains a comparison of the fractions for the final states for these simulations and simulations started on the (110) and (010) surfaces. The results show that in the inverted orientation on all of these surfaces, a significant fraction of the simulations resulted in the CBM leaving the surface. Furthermore, 10% of the simulations started with the CBM in the inverted orientation on the (100) surface resulted in the CBM reorienting so that the planar face was in contact with the cellulose. Although these results show the preference of the flat face of the CBM for cellulose, they do not disprove the proposed mechanism (29) where the CBM acts like a wedge and a dislocated cellulose chain binds to the top.
FIGURE 7.

Time evolution of simulations in which the wedge face of CBM was placed on the (100) surface of the 36-chain microfibril. The red trace is the fraction of simulations in which the CBM reoriented so that the planar face was bound to the cellulose surface, whereas the green trace is the fraction that desorbed from the microfibril.
CBM Translation
Analysis of the CBM movement on the cellulose surfaces provides additional information about its function and its selectivity for the hydrophobic surface. The unrestrained simulations demonstrate that the CBM can readily move perpendicular to the cellulose chains on the hydrophilic surfaces, but it does not move readily between chains on the (100) surface. Once the CBM has moved from the hydrophilic surfaces to the (100) surface (perpendicular to the cellulose chains), it does not return on the time scales sampled here.
Fig. 8 shows histograms of the CBM motion perpendicular to and along the cellulose chain axis on the (100) surface. The location of the CBM for the histograms was calculated as the center of mass of the three tyrosine residues on the planar face of the CBM (Tyr-5, Tyr-31, and Tyr-32). The three tyrosine residues remained roughly aligned with the middle cellulose chain as shown in Fig. 8A. Only one of the 40 simulations on this surface resulted in the CBM moving in the y direction to an adjacent chain. The distribution has a peak maximum at 1.6 Å and a width of ∼3 Å. Because the distance between adjacent chains is ∼8 Å, this distribution suggests that the CBM does not readily translate to other cellulose chains on the hydrophobic face of cellulose on time scales sampled in this study.
FIGURE 8.

Histograms of the distribution of the center-of-mass of the three tyrosine residues on the planar CBM face during simulations on the (100) surface of the 36-chain cellulose microfibril. A, distribution in the y direction perpendicular to chain direction. Zero is the center of the middle chain. B, distribution in x direction parallel to chain axis (blue line), and cluster analysis locations and populations (red lines). Cluster analysis of the populations produced two classes of structures: one with the tyrosine rings centered over the C1 carbon of the cellulose chain (class A) and one with the tyrosine rings centered over the C4 carbon of the cellulose chain (class B). The inset shows the alignment of the tyrosine rings (shown schematically with the ocher and green circles) on the cellulose chain for the two clusters, A and B.
However, the CBM can readily move along the cellulose chains as shown in a histogram of the positions of the CBM parallel to the cellulose chains, in Fig. 8B. The maxima in this distribution correspond to free energy basins for the CBM along the cellulose chain. To determine the alignment of the CBM with the cellulose chains in these basins, a clustering analysis was performed using the Means (50) method. Fifteen clusters were chosen, and the locations of the representative structures for these clusters and the populations of the clusters are represented by the red lines in Fig. 8B. From a visual inspection of the representative configurations for each cluster, it was determined that there were two types of alignments: one in which the centers of the tyrosine rings were over the C1 carbon of the cellulose (labeled A) and one in which the tyrosine rings were over the C4 carbon (labeled B). The populations indicate that the A type structures were preferred. The simulations showed that the CBM moved in jumps between the stable basins along a cellulose chain of the hydrophobic face. This motion is consistent with earlier MD simulations of this CBM on cellulose (35, 36).
Contrary to the behavior on the (100) surface, the CBM can move readily both parallel and perpendicular to the cellulose chain axis on the hydrophilic surfaces of cellulose. Fig. 9 shows histograms for simulations in which the CBM was started in the B position on the (110) surface. These histograms were calculated using only simulations in which the CBM did not leave the microfibril. The distributions in the perpendicular and parallel directions have roughly the same widths, suggesting that the CBM can readily move in either direction. Interestingly, the peaks in the distribution along the perpendicular direction (Fig. 9A), correspond to orientations in which the tyrosine residues on the planar face roughly align with the cellulose chains on the (110) surface and the edge chain on the (100) surface. The peaks in the parallel direction (Fig. 9B) are spaced by roughly 5 Å, the distance between glycan residues in a cellulose chain. Similar histograms were obtained for the simulations started at the other positions on the hydrophilic surfaces, and the results are shown in supplemental Figs. S5–S7.
FIGURE 9.

Distribution of the CBM during simulations started at position B on the (110) surface of the 36-chain microfibril in y direction (A) and x direction (B). The CBM location was determined by the center of mass of the three tyrosine residues on the planar face (Tyr-32, Tyr-31, and Tyr-5).
Diffusivity
Analysis of the CBM displacement during the unrestrained simulations enables calculation of the CBM diffusivity. Fig. 10 shows the square of the average displacement on the (100) surface in the x and y directions over time in the 40 simulations started on this surface. From Fick's second law, the slopes of these lines are proportional to the one-dimensional diffusivities, D|| or D⊥. The diffusivity parallel to the cellulose chains on this surface is 2 Å2 ns−1, which is nearly four times higher than the diffusivity perpendicular to the chains. This is consistent with the distribution histograms in Fig. 8, which show that the CBM can readily translate along the cellulose microfibril axis but is restricted from moving across the microfibril (100) surface. Similar measurements on the hydrophilic surfaces of the 36-chain microfibril were found which indicates that the diffusivity is similar on all surfaces parallel to the cellulose chains, but across chains diffusivity is larger on hydrophilic surfaces compared with the (100) surface. The calculated diffusivities are 103 Å2 s−1 larger than those measured for the Family 2 CBMs from Cex and CenA from Cellulomonas fimi, which are larger and contain 99 and 96 amino acids, respectively (51).
FIGURE 10.

A plot of the square displacements in the x and y directions from unrestrained MD simulations of the CBM on the (100) surface of the 36-chain microfibril. The lines are linear least square fits to the data. The slope of the fits is the diffusivity, D.
These diffusivity calculations, taken with the MD simulations described above, suggest that the CBM can move more freely on hydrophilic surfaces without directional preference. However, on the hydrophobic face, the CBM one-dimensional diffusivity parallel to the cellulose chain axis is four times larger than across the chains. This is likely important both when for CD complexation with a free chain end as well as during processive hydrolysis.
Implications for Cellulase Action
The results of these simulations suggest mechanisms for the formation of a catalytically active complex between a cellulase CD with cellulose: (a) the CBM can migrate from hydrophilic surfaces to the (100) surface, which is better suited for cellulase action, and the CBM can also move to the (100) surface through desorption and readsorption; (b) desorption and migration from the hydrophilic surfaces play an important role in the selectivity for the (100) surface; (c) enthalpic driving forces play a role in transfer of the CD to its appropriate substrate via the CBM; and (d) the observations in this study are likely to be constant across all Family 1 CBMs, because there is a high homology in this family (36).
Conclusions
The MD simulations in this study demonstrate that the Family 1 CBMs exhibit high selectivity for adsorption of its planar face onto the hydrophobic surface of cellulose. That the CBM would have a preference for the hydrophobic surface is reasonable because Cel7A likely extracts a chain from this surface. The MD simulations also suggest mechanisms for transfer from the hydrophilic surfaces to the hydrophobic surface. Because there is a high probability that the CBM will initially adsorb to a hydrophilic surface, the mechanism that allows it to find the correct surface will be important for the rate of the whole enzyme to become catalytically active. The results of the simulations show that the Family 1 CBM can transfer to the desired surface by lateral diffusion on the hydrophilic surfaces to the hydrophobic surface. Our simulations show that this process is probable during the relatively short (100 ns) simulations. Likewise if the wrong face of the CBM is adsorbed onto the surfaces of the cellulose, an expedient way toward the correct configuration is for the CBM to rotate. The high homology of the CBMs in this family with regards to the planar face suggests that all of members of the family will display similar behavior on cellulose.
Acknowledgment
We thank Dr. Christina M. Payne for help setting up the simulations.
This work was supported in part by the Department of Energy Office of the Biomass Program. Computer time was provided by the TACC Ranger cluster and the NICS Athena and Kraken clusters under NSF Teragrid Grant MCB090159.

This article contains supplemental Movies S1 and S2 and Figs. S1–S7.
- CD
- catalytic domain
- CBM
- carbohydrate-binding module
- MD
- molecular dynamics.
REFERENCES
- 1. Himmel M. E., Ding S. Y., Johnson D. K., Adney W. S., Nimlos M. R., Brady J. W., Foust T. D. (2007) Biomass recalcitrance: engineering plants and enzymes for biofuels production. Science 315, 804–807 [DOI] [PubMed] [Google Scholar]
- 2. Wilson D. B. (2009) Cellulases and biofuels. Curr. Opin. Biotech. 20, 295–299 [DOI] [PubMed] [Google Scholar]
- 3. Chundawat S. P., Beckham G.T., Himmel M. E., Dale B. E. (2011) Deconstruction of lignocellulosic biomass to fuels and chemicals. Annu. Rev. Chem. Biomol. Eng. 2, 121–145 [DOI] [PubMed] [Google Scholar]
- 4. Reese E. T. (1976) History of the cellulase program at the U.S. army Natick Development Center. Biotechnol. Bioeng. Symp. 6, 9–20 [PubMed] [Google Scholar]
- 5. Kraulis J., Clore G. M., Nilges M., Jones T. A., Pettersson G., Knowles J., Gronenborn A. M. (1989) Determination of the three-dimensional solution structure of the C-terminal domain of cellobiohydrolase I from Trichoderma reesei. A study using nuclear magnetic resonance and hybrid distance geometry-dynamical simulated annealing. Biochemistry 28, 7241–7257 [DOI] [PubMed] [Google Scholar]
- 6. Rouvinen J., Bergfors T., Teeri T., Knowles J. K., Jones T. A. (1990) Three-dimensional structure of cellobiohydrolase II from Trichoderma reesei. Science 249, 380–386 [DOI] [PubMed] [Google Scholar]
- 7. Srisodsuk M., Reinikainen T., Penttilä M., Teeri T. T. (1993) Role of the interdomain linker peptide of Trichoderma reesei cellobiohydrolase I in its interaction with crystalline cellulose. J. Biol. Chem. 268, 20756–20761 [PubMed] [Google Scholar]
- 8. Divne C., Ståhlberg J., Reinikainen T., Ruohonen L., Pettersson G., Knowles J. K., Teeri T. T., Jones T. A. (1994) The three-dimensional crystal structure of the catalytic core of cellobiohydrolase I from Trichoderma reesei. Science 265, 524–528 [DOI] [PubMed] [Google Scholar]
- 9. Linder M., Lindeberg G., Reinikainen T., Teeri T. T., Pettersson G. (1995) The difference in affinity between two fungal cellulose-binding domains is dominated by a single amino acid substitution. FEBS Lett. 372, 96–98 [DOI] [PubMed] [Google Scholar]
- 10. Kleywegt G. J., Zou J. Y., Divne C., Davies G. J., Sinning I., Stâhlberg J., Reinikainen T., Srisodsuk M., Teeri T. T., Jones T. A. (1997) The crystal structure of the catalytic core domain of endoglucanase I from Trichoderma reesei at 3.6 A resolution, and a comparison with related enzymes. J. Mol. Biol. 272, 383–397 [DOI] [PubMed] [Google Scholar]
- 11. Divne C., Ståhlberg J., Teeri T. T., Jones T. A. (1998) High-resolution crystal structures reveal how a cellulose chain is bound in the 50 A long tunnel of cellobiohydrolase I from Trichoderma reesei. J. Mol. Biol. 275, 309–325 [DOI] [PubMed] [Google Scholar]
- 12. Koivula A., Kinnari T., Harjunpää V., Ruohonen L., Teleman A., Drakenberg T., Rouvinen J., Jones T. A., Teeri T. T. (1998) Tryptophan 272. An essential determinant of crystalline cellulose degradation by Trichoderma reesei cellobiohydrolase Cel6A. FEBS Lett. 429, 341–346 [DOI] [PubMed] [Google Scholar]
- 13. Hu J. P., Lanthier P., White T. C., McHugh S. G., Yaguchi M., Roy R., Thibault P. (2001) Characterization of cellobiohydrolase I (Cel7A) glycoforms from extracts of Trichoderma reesei using capillary isoelectric focusing and electrospray mass spectrometry. J. Chromatogr. B Biomed. Sci. Appl. 752, 349–368 [DOI] [PubMed] [Google Scholar]
- 14. Sandgren M., Shaw A., Ropp T. H., Wu S., Bott R., Cameron A. D., Ståhlberg J., Mitchinson C., Jones T. A. (2001) The X-ray crystal structure of the Trichoderma reesei family 12 endoglucanase 3, Cel12A, at 1.9 A resolution. J. Mol. Biol. 308, 295–310 [DOI] [PubMed] [Google Scholar]
- 15. Stals I., Sandra K., Devreese B., Van Beeumen J., Claeyssens M. (2004) Factors influencing glycosylation of Trichoderma reesei cellulases. II. N-Glycosylation of Cel7A core protein isolated from different strains. Glycobiology 14, 725–737 [DOI] [PubMed] [Google Scholar]
- 16. Stals I., Sandra K., Geysens S., Contreras R., Van Beeumen J., Claeyssens M. (2004) Factors influencing glycosylation of Trichoderma reesei cellulases. I. Postsecretorial changes of the O- and N-glycosylation pattern of Cel7A. Glycobiology 14, 713–724 [DOI] [PubMed] [Google Scholar]
- 17. Karkehabadi S., Hansson H., Kim S., Piens K., Mitchinson C., Sandgren M. (2008) The first structure of a glycoside hydrolase family 61 member, Cel61B from Hypocrea jecorina, at 1.6 A resolution. J. Mol. Biol. 383, 144–154 [DOI] [PubMed] [Google Scholar]
- 18. Martinez D., Berka R. M., Henrissat B., Saloheimo M., Arvas M., Baker S. E., Chapman J., Chertkov O., Coutinho P. M., Cullen D., Danchin E. G. J., Grigoriev I. V., Harris P., Jackson M., Kubicek C. P., Han C. S., Ho I., Larrondo L. F., de Leon A. L., Magnuson J. K., Merino S., Misra M., Nelson B., Putnam N., Robbertse B., Salamov A. A., Schmoll M., Terry A., Thayer N., Westerholm-Parvinen A., Schoch C. L., Yao J., Barbote R., Nelson M. A., Detter C., Bruce D., Kuske C. R., Xie G., Richardson P., Rokhsar D. S., Lucas S. M., Rubin E. M., Dunn-Coleman N., Ward M., Brettin T. S. (2008) Genome sequencing and analysis of the biomass-degrading fungus Trichoderma reesei (syn. Hypocrea jecorina). Nat. Biotechnol. 26, 553–560 [DOI] [PubMed] [Google Scholar]
- 19. Igarashi K., Koivula A., Wada M., Kimura S., Penttilä M., Samejima M. (2009) High speed atomic force microscopy visualizes processive movement of Trichoderma reesei cellobiohydrolase I on crystalline cellulose. J. Biol. Chem. 284, 36186–36190 [DOI] [PMC free article] [PubMed] [Google Scholar]
- 20. Lantz S. E., Goedegebuur F., Hommes R., Kaper T., Kelemen B. R., Mitchinson C., Wallace L., Ståhlberg J., Larenas E. A. (2010) Hypocrea jecorina CEL6A protein engineering. Biotechnol. Biofuels 3, 20. [DOI] [PMC free article] [PubMed] [Google Scholar]
- 21. Stals I., Samyn B., Sergeant K., White T., Hoorelbeke K., Coorevits A., Devreese B., Claeyssens M., Piens K. (2010) Identification of a gene coding for a deglycosylating enzyme in Hypocrea jecorina. FEMS Microbiol. Lett. 303, 9–17 [DOI] [PubMed] [Google Scholar]
- 22. Deshpande N., Wilkins M. R., Packer N., Nevalainen H. (2008) Protein glycosylation pathways in filamentous fungi. Glycobiology 18, 626–637 [DOI] [PubMed] [Google Scholar]
- 23. Harris P. V., Welner D., McFarland K. C., Re E., NavarroPoulsen J. C., Brown K., Salbo R., Ding H., Vlasenko E., Merino S., Xu F., Cherry J., Larsen S., Lo Leggio L. (2010) Stimulation of lignocellulosic biomass hydrolysis by proteins of glycoside hydrolase family 61. Structure and function of a large, enigmatic family. Biochemistry 49, 3305–3316 [DOI] [PubMed] [Google Scholar]
- 24. Phillips C. M., Iavarone A. T., Marletta M. A. (2011) Quantitative proteomic approach for cellulose degradation by Neurospora crassa. J. Proteome Res. 10, 4177–4185 [DOI] [PubMed] [Google Scholar]
- 25. Harrison M. J., Nouwens A. S., Jardine D. R., Zachara N. E., Gooley A. A., Nevalainen H., Packer N. H. (1998) Modified glycosylation of cellobiohydrolase I from a high cellulase-producing mutant strain of Trichoderma reesei. Eur. J. Biochem. 256, 119–127 [DOI] [PubMed] [Google Scholar]
- 26. Beckham G. T., Bomble Y. J., Matthews J. F., Taylor C. B., Resch M. G., Yarbrough J. M., Decker S. R., Bu L., Zhao X., McCabe C., Wohlert J., Bergenstråhle M., Brady J. W., Adney W. S., Himmel M. E., Crowley M. F. (2010) The O-glycosylated linker from the Trichoderma reesei Family 7 cellulase is a flexible, disordered protein. Biophys. J. 99, 3773–3781 [DOI] [PMC free article] [PubMed] [Google Scholar]
- 27. Linder M., Mattinen M. L., Kontteli M., Lindeberg G., Ståhlberg J., Drakenberg T., Reinikainen T., Pettersson G., Annila A. (1995) Identification of functionally important amino acids in the cellulose-binding domain of Trichoderma reesei cellobiohydrolase I. Protein Sci. 4, 1056–1064 [DOI] [PMC free article] [PubMed] [Google Scholar]
- 28. Lehtiö J., Sugiyama J., Gustavsson M., Fransson L., Linder M., Teeri T. T. (2003) The binding specificity and affinity determinants of family 1 and family 3 cellulose binding modules. Proc. Natl. Acad. Sci. 100, 484–489 [DOI] [PMC free article] [PubMed] [Google Scholar]
- 29. Mulakala C., Reilly P. J. (2005) Hypocrea jecorina (Trichoderma reesei) Cel7A as a molecular machine. A docking study. Proteins 60, 598–605 [DOI] [PubMed] [Google Scholar]
- 30. Tavagnacco L., Mason P. E., Schnupf U., Pitici F., Zhong L., Himmel M. E., Crowley M., Cesàro A., Brady J. W. (2011) Sugar-binding sites on the surface of the carbohydrate-binding module of CBH I from Trichoderma reesei. Carbohydr. Res. 346, 839–846 [DOI] [PubMed] [Google Scholar]
- 31. Boraston A. B., Bolam D. N., Gilbert H. J., Davies G. J. (2004) Carbohydrate-binding modules. Fine-tuning polysaccharide recognition. Biochem. J. 382, 769–781 [DOI] [PMC free article] [PubMed] [Google Scholar]
- 32. Arantes V., Saddler J. N. (2010) Access to cellulose limits the efficiency of enzymatic hydrolysis. The role of amorphogenesis. Biotechnol. Biofuels 3, 4. [DOI] [PMC free article] [PubMed] [Google Scholar]
- 33. Hall M., Bansal P., Lee J. H., Realff M. J., Bommarius A. S. (2011) Biological pretreatment of cellulose. Enhancing enzymatic hydrolysis rate using cellulose-binding domains from cellulases. Bioresour. Technol. 102, 2910–2915 [DOI] [PubMed] [Google Scholar]
- 34. Beckham G. T., Bomble Y. J., Bayer E. A., Himmel M. E., Crowley M. F. (2011) Applications of computational science for understanding enzymatic deconstruction of cellulose. Curr. Opin. Biotechnol. 22, 231–238 [DOI] [PubMed] [Google Scholar]
- 35. Bu L., Beckham G. T., Crowley M. F., Chang C. H., Matthews J. F., Bomble Y. J., Adney W. S., Himmel M. E., Nimlos M. R. (2009) The energy landscape for the interaction of the family 1 carbohydrate-binding module and the cellulose surface is altered by hydrolyzed glycosidic bonds. J. Phys. Chem. B 113, 10994–11002 [DOI] [PubMed] [Google Scholar]
- 36. Beckham G. T., Matthews J. F., Bomble Y. J., Bu L., Adney W. S., Himmel M. E., Nimlos M. R., Crowley M. F. (2010) Identification of amino acids responsible for processivity in a Family 1 carbohydrate-binding module from a fungal cellulase. J. Phys. Chem. B 114, 1447–1453 [DOI] [PubMed] [Google Scholar]
- 37. Koyama M., Sugiyama J., Itoh T. (1997) Systematic survey on crystalline features of algal celluloses. Cellulose 4, 147–160 [Google Scholar]
- 38. Helbert W., Nishiyama Y., Okano T., Sugiyama J. (1998) Molecular imaging of halocynthia papillosa cellulose J. Struct. Biol. 124, 42–50 [DOI] [PubMed] [Google Scholar]
- 39. Newman R. H. (1998) Evidence of assignment of 13C NMR signals to cellulose crystallite surfaces in wood, pulp and isolated cellulose. Holzforschung 52, 157–159 [Google Scholar]
- 40. Horikawa Y., Itoh T., Sugiyama J. (2006) Preferential uniplanar orientation of cellulose microfibrils re-investigated by FTIR technique. Cellulose 13, 309–316 [Google Scholar]
- 41. Nishiyama Y. (2009) Structure and properties of the cellulose microfibril. J. Wood Sci. 55, 241–249 [Google Scholar]
- 42. Fernandes A. N., Thomas L. H., Altaner C. M., Callow P., Forsyth V. T., Apperley D. C., Kennedy C. J., Jarvis M. C. (2011) Nanostructure of cellulose microfibrils in spruce wood. Proc. Natl. Acad. Sci. U.S.A. 108, E1195–E1203 [DOI] [PMC free article] [PubMed] [Google Scholar]
- 43. Matthews J. F., Skopec C. E., Mason P. E., Zuccato P., Torget R. W., Sugiyama J., Himmel M. E., Brady J. W. (2006) Computer simulation studies of microcrystalline cellulose Iβ. Carbohydr. Res. 341, 138–152 [DOI] [PubMed] [Google Scholar]
- 44. Beckham G. T., Matthews J. F., Peters B., Bomble Y. J., Himmel M. E., Crowley M. F. (2011) Molecular-level origins of biomass recalcitrance. Decrystallization free energies for four common cellulose polymorphs. J. Phys. Chem. B 115, 4118–4127 [DOI] [PubMed] [Google Scholar]
- 45. Bu L., Beckham G. T., Shirts M. R., Nimlos M. R., Adney W. S., Himmel M. E., Crowley M. F. (2011) Probing carbohydrate product expulsion from a processive cellulase with multiple absolute binding free energy methods. J. Biol. Chem. 286, 18161–18169 [DOI] [PMC free article] [PubMed] [Google Scholar]
- 46. Chundawat S. P., Bellesia G., Uppugundla N., da Costa Sousa L., Gao D., Cheh A. M., Agarwal U. P., Bianchetti C. M., Phillips G. N., Jr., Langan P., Balan V., Gnanakaran S., Dale B. E. (2011) Restructuring the crystalline cellulose hydrogen bond network enhances its depolymerization rate. J. Am. Chem. Soc. 133, 11163–11174 [DOI] [PubMed] [Google Scholar]
- 47. Payne C. M., Himmel M. E., Crowley M. F., Beckham G. T. (2011) Decrystalization of oligosaccharides from the cellulose 1β surface with molecular simulations. J. Phys. Chem. Lett. 2, 1546–1550 [Google Scholar]
- 48. Nishiyama Y., Langan P., Chanzy H. (2002) Crystal structure and hydrogen-bonding system in cellulose Iβ from synchrotron X-ray and neutron fiber diffraction. J. Am. Chem. Soc. 124, 9074–9082 [DOI] [PubMed] [Google Scholar]
- 49. Matthews J. F., Beckham G. T., Bergenstråhle-Wohlert M., Brady J. W., Himmel M. E., Crowley M. F. (2012) J. Chem. Theory Comput. 8, 735–748 [DOI] [PubMed] [Google Scholar]
- 50. Shao J., Tanner S. W., Thompson N., Cheatham T. E. (2007) Clustering molecular dynamics trajectories. 1. Characterizing the performance of different clustering algorithms. J. Chem. Theory Comput. 3, 2312–2334 [DOI] [PubMed] [Google Scholar]
- 51. Jervis E. J., Haynes C. A., Kilburn D. G. (1997) Surface diffusion of cellulases and their isolated binding domains on cellulose. J. Biol. Chem. 272, 24016–24023 [DOI] [PubMed] [Google Scholar]
- 52. MacKerell A. D., Bashford D., Bellott M., Dunbrack R. L., Evanseck J. D., Field M. J., Fischer S., Gao J., Guo H., Ha S., Joseph-McCarthy D., Kuchnir L., Kuczera K., Lau F. T. K., Mattos C., Michnick S., Ngo T., Nguyen D. T., Prodhom B., Reiher W. E., Roux B., Schlenkrich M., Smith J. C., Stote R., Straub J., Watanabe M., Wiorkiewicz-Kuczera J., Yin D., Karplus M. (1998) All-atom empirical potential for molecular modeling and dynamics studies of proteins. J. Phys. Chem. B 102, 3586–3616 [DOI] [PubMed] [Google Scholar]
- 53. MacKerell A. D., Feig M., Brooks C. L. (2004) Extending the treatment of backbone energetics in protein force fields. Limitations of gas-phase quantum mechanics in reproducing protein conformational distributions in molecular dynamics simulations. J. Comp. Chem. 25, 1400–1415 [DOI] [PubMed] [Google Scholar]
- 54. Jorgensen W. L., Chandrasekhar J., Madura J. D. (1983) Comparison of simple potential functions for simulating liquid water. J. Chem. Phys. 79, 926–935 [Google Scholar]
- 55. Durell S. R., Brooks B. R., Ben-Naim A. (1994) Solvent-induced forces between two hydrophilic groups. J. Phys. Chem. 98, 2198–2202 [Google Scholar]
- 56. Guvench O., Greene S. N., Kamath G., Brady J. W., Venable R. M., Pastor R. W., Mackerell A. D. (2008) Additive empirical force field for hexopyranose monosaccharides. J. Comput. Chem. 29, 2543–2564 [DOI] [PMC free article] [PubMed] [Google Scholar]
- 57. Guvench O., Hatcher E., Venable R. M., Pastor R. W., MacKerell A. D. (2009) CHARMM additive all-atom force field for glycosidic linkages between hexopyranoses. J. Chem. Theor. Comp. 5, 2353–2370 [DOI] [PMC free article] [PubMed] [Google Scholar]
- 58. Crowley M. F., Williamson M. J., Walker R. C. (2009) CHAMBER. Comprehensive support for CHARMM force fields within the AMBER software. Int. J. Quantum Chem. 109, 3767–3772 [Google Scholar]
- 59. Case D. A., Cheatham T. E., Darden T., Gohlke H., Luo R., Merz K. M., Onufriev A., Simmerling C., Wang B., Woods R. J. (2005) The Amber biomolecular simulation programs. J. Comp. Chem. 26, 1668–1688 [DOI] [PMC free article] [PubMed] [Google Scholar]
- 60. Ryckaert J., Ciccotti G., Berendsen H. (1977) Numerical integration of the Cartesian equations of motion of a system with constraints. Molecular dynamics of n-alkanes. J. Comput. Phys. 23, 327–341 [Google Scholar]
- 61. Essmann U., Perera L., Berkowitz M. L., Darden T., Lee H., Pedersen L. G. (1995) A smooth particle mesh Ewald method. J. Chem. Phys. 103, 8857 [Google Scholar]
- 62. Parrinello M., Rahman A. (1980) Crystal structure and pair potentials. A molecular dynamics study. Phys. Rev. Lett. 45, 1196–1199 [Google Scholar]
- 63. Nosé S., Klein M. L. (1983) Constant pressure molecular dynamics for molecular systems. Mol. Phys. 50, 1055–1076 [Google Scholar]
- 64. Hoover W. G. (1985) Canonical dynamics: Equilibrium phase-space distributions. Phys. Rev. A 31, 1695–1697 [DOI] [PubMed] [Google Scholar]
- 65. Torrie G. M., Valleau J. P. (1977) Nonphysical sampling distributions in Monte Carlo free-energy estimation. Umbrella sampling. J. Comput. Phys. 23, 187–199 [Google Scholar]
- 66. Kottalam J., Case D. A. (1988) Dynamics of ligand escape from the heme pocket of myoglobin. J. Am. Chem. Soc. 110, 7690–7697 [Google Scholar]
- 67. Kumar S., Rosenberg J. M., Bouzida D., Swendsen R. H., Kollman P. A. (1992) The weighted histogram analysis method for free-energy calculations on biomolecules. I. The method. J. Comp. Chem. 13, 1011–1021 [Google Scholar]