

Background: Hepatic ER stress promotes insulin resistance, but the role of cholesterol in this pathway is unknown.
Results: LCAT-deficient mice maintain a low ER cholesterol and are protected from cholesterol-induced ER stress.
Conclusion: ER cholesterol, not tissue cholesterol, is crucial for hepatic ER stress development.
Significance: Modulators of hepatic ER cholesterol may be novel targets to treat diabetes.
Keywords: Cholesterol Regulation, Endoplasmic Reticulum Stress, Insulin Resistance, LCAT, Mouse, ACAT, Biliary Cholesterol, NPC1L1, SREBP, TRC8
Abstract
We recently reported that lecithin:cholesterol acyltransferase (LCAT) knock-out mice, particularly in the LDL receptor knock-out background, are hypersensitive to insulin and resistant to high fat diet-induced insulin resistance (IR) and obesity. We demonstrated that chow-fed Ldlr−/−xLcat+/+ mice have elevated hepatic endoplasmic reticulum (ER) stress, which promotes IR, compared with wild-type controls, and this effect is normalized in Ldlr−/−xLcat−/− mice. In the present study, we tested the hypothesis that hepatic ER cholesterol metabolism differentially regulates ER stress using these models. We observed that the Ldlr−/−xLcat+/+ mice accumulate excess hepatic total and ER cholesterol primarily attributed to increased reuptake of biliary cholesterol as we observed reduced biliary cholesterol in conjunction with decreased hepatic Abcg5/g8 mRNA, increased Npc1l1 mRNA, and decreased Hmgr mRNA and nuclear SREBP2 protein. Intestinal NPC1L1 protein was induced. Expression of these genes was reversed in the Ldlr−/−xLcat−/− mice, accounting for the normalization of total and ER cholesterol and ER stress. Upon feeding a 2% high cholesterol diet (HCD), Ldlr−/−xLcat−/− mice accumulated a similar amount of total hepatic cholesterol compared with the Ldlr−/−xLcat+/+ mice, but the hepatic ER cholesterol levels remained low in conjunction with being protected from HCD-induced ER stress and IR. Hepatic ER stress correlates strongly with hepatic ER free cholesterol but poorly with hepatic tissue free cholesterol. The unexpectedly low ER cholesterol seen in HCD-fed Ldlr−/−xLcat−/− mice was attributable to a coordinated marked up-regulation of ACAT2 and suppressed SREBP2 processing. Thus, factors influencing the accumulation of ER cholesterol may be important for the development of hepatic insulin resistance.
Introduction
Lecithin:cholesterol acyltransferase (LCAT)3 is the key enzyme mediating the esterification of free cholesterol, primarily in high density lipoprotein (HDL), in the circulation. Complete LCAT deficiency in humans causes a profound reduction in circulating HDL, an elevated free cholesterol to cholesteryl ester ratio, and modest hypertriglyceridemia. Corneal opacities and glomerulosclerosis are also frequently reported complications (1, 2). To date, most of the key morbid phenotypes have been recapitulated in the LCAT knock-out mice bred into a variety of dyslipidemic backgrounds (2–6). Despite the metabolically unfavorable high triglyceride/low HDL phenotypes (2, 7), we recently reported an unexpected observation that LCAT-deficient mice are protected from diet-induced obesity and IR in a gender-specific manner with the phenotypes being more pronounced in females (8). These protective effects were also comparatively more pronounced in the low density lipoprotein receptor-null (Ldlr−/−) background. In the absence of the dietary challenge, we also reported that the Ldlr−/−xLcat−/− mice were more insulin-sensitive than their Ldlr−/−xLcat+/+ controls (2, 9). Although multiple pathways are implicated in the observed protective effects (8, 9), alterations in hepatic ER stress appear to play an important role (8, 10–12). We recently observed that the hepatic expression of unfolded protein response (UPR) markers is up-regulated by ∼2-fold in the Ldlr−/−xLcat+/+ mice when compared with the wild type (WT) control under chow-fed conditions. On the other hand, a concomitant loss of LCAT (i.e. in Ldlr−/−xLcat−/− mice) led to normalization of expression of the UPR markers (8). Furthermore, the induction of the hepatic UPR in response to a high fat, high sucrose diet was significantly attenuated in the Ldlr−/−xLcat−/− mice when compared with the Ldlr−/−xLcat+/+ mice (8). To further address the mechanism of these protective phenotypes, we asked whether altered cholesterol metabolism in LCAT deficiency and LDLR deficiency may play an important role in the observed alterations of hepatic ER stress.
The role of cellular cholesterol in the induction of ER stress has been well established in macrophages in the context of atherosclerosis. Excess plasma cholesterol can be taken up by macrophages via multiple receptors, hydrolyzed to free cholesterol, and transported to various organelles, including the ER (13, 14). This accumulation can alter the critical free cholesterol to phospholipid ratio of the ER membrane that is necessary to maintain membrane fluidity. Stiffening of the ER membrane inhibits enzyme conformational changes, thus inducing ER stress and contributing to the pathogenesis of vulnerable atherosclerotic plaque (13, 14). Surprisingly, little has been reported on the effect of cholesterol on hepatic ER stress. Feeding Sprague-Dawley rats a 2% high cholesterol diet (HCD) failed to induce hepatic ER stress, but rather the animals developed mitochondrial stress (15). A suitable model for dietary cholesterol-induced hepatic ER stress remains elusive. The observed elevated UPR expression in the Ldlr−/−xLcat+/+ mice and its exaggerated response to the high fat, high sucrose diet (8) make this knock-out strain a strong candidate.
The ER of mammalian cells contains an elaborate feedback system that responds to the level of membrane cholesterol and modulates the transcription of genes that mediate cholesterol biosynthesis and uptake to maintain homeostasis. Cholesterol depletion in cells promotes the transport of sterol response element-binding protein 2 (SREBP2) by SREBP cleavage-activating protein (SCAP) from the ER to the Golgi. This allows for sequential cleavage of SREBP2, liberating its N terminus (nSREBP2) and allowing it to translocate to the nucleus to up-regulate genes for cholesterol uptake (LDLR) and synthesis (HMG-CoA reductase (HMGR)). In cholesterol-replete states, SREBP2 is retained in the ER through binding of the SREBP2-SCAP complex to the ER-resident proteins INSIG1 and INSIG2. Radhakrishnan et al. (16) recently showed that the nuclear abundance of SREBP2 is tightly regulated by ER membrane cholesterol with a threshold of ∼5 mol % of total ER lipids. The relationship between nuclear abundance of nSREBP2 protein and ER membrane cholesterol conforms to a sigmoidal curve with a steep slope based on Hill analysis (16). As such, slight deviations from this threshold lead to marked activation or deactivation of SREBP2 processing in conditions of low or high ER cholesterol content, respectively.
In this study, we report that levels of ER membrane cholesterol, not total tissue cholesterol, best correlate with hepatic ER stress and correctly predict the paradoxical suppression of hepatic ER stress in HCD-fed Ldlr−/−xLcat−/− mice. We have also provided evidence of marked alteration in the biliary cholesterol homeostatic pathways to account for the excess hepatic cholesterol accumulation in the Ldlr−/−xLcat+/+ mice and its reversal in the Ldlr−/−xLcat−/− mice. Furthermore, alteration in the cholesterol esterification pathways in Ldlr−/−xLcat−/− mice has been shown to protect, at least in part, against cholesterol-induced ER cholesterol accumulation and ER stress.
EXPERIMENTAL PROCEDURES
Reagents
Tunicamycin, methyl-β-cyclodextrin (MCD), cholesterol, 2-hydroxypropyl-β-cyclodextrin (HPCD), and zaragozic acid were purchased from Sigma. Thapsigargin was from Invitrogen. Pyripyropene A (PPPA) was purchased from Enzo Life Sciences (Cederlane, Ontario, Canada).
Animals
Ldlr−/−xLcat−/− mice and Ldlr−/−xLcat+/+ mice in a C57Bl/6 background were generated as described previously (8). C57Bl/6 WT mice were used as controls. Age-matched female animals were used in all experiments. Mice were fed either a regular chow diet (Harlan Teklad 2918) with no cholesterol or a 2% high cholesterol diet (Harlan Teklad 03091) starting between 9 and 11 weeks of age. Mice were fasted for 12 h prior to sacrifice, and all tissues collected were immediately flash frozen in liquid nitrogen after dissection and stored at −80 °C. All experimental procedures used were approved by the Animal Care Committee at St. Michael's Hospital.
mRNA Quantitation of Hepatic Tissue Genes
RNA extraction from liver tissue, generation of cDNA, and quantitative RT-PCR were carried out as described previously (8). The relative mRNA expression was determined using the comparative Ct method by calculating 2−ΔΔCt. The primers were synthesized by the DNA Synthesis Facility at the Hospital for Sick Children (Toronto, Ontario, Canada). Xbp1-s, Chop, Npc1l1, Hmgr, Abcg5, and Abcg8 were analyzed by quantitative real time polymerase chain reaction using glyceraldehyde-3-phosphate dehydrogenase (Gapdh) as an internal control. Primer pairs used to amplify these genes were as follows (forward and reverse, respectively): Chop, 5′-ctgcctttcaccttggagac and 3′-tataggtgcccccattttca; Xbp1-s, 5′-gagtccgcagcaggtg and 3′-gtgtcagagtccatggga; Hmgr, 5′-tctggcagtcagtgggaactatt and 3′-cctcgtccttcgatccaattt; Npc1l1, 5′-atcgcactaccatccaggac, 3′-ggctccatctggagtagctg; Abcg5, 5′-ttggtgtcctgctgaggcgagt and 3′-gcacagcgccctttagcgtg; Abcg8, 5′-cccagcgtgacaaacgggtgg and 3′-ccccggacaccccacgtaca; Insig1, 5′-cgctgtctgctgtttcagtc and 3′-tcacagattgcaagctccac; Srb1, 5′-ggcaagcccctgagcacgatt and 3′-cctccaagccccagcagcac; Abcb4, 5′-gccctggggatgacgcagtg and 3′-aggccatggaccggagcctt; and Gapdh, 5′-acccagaagactgtggatgg and 3′-ggatgcagggatgatgttct.
Western Blot Analysis of Hepatic Proteins
Liver samples (50–100 mg) were homogenized in radioimmune precipitation assay lysis buffer and protease inhibitor mixture (Santa Cruz Biotechnology, Santa Cruz, CA). Cytosolic and nuclear components of whole liver were isolated using the Compartment Protein Extraction kit (Chemicon catalog number 2145, Temecula, CA) as described previously (9). Protein concentrations in the supernatant were determined using a Bio-Rad protein assay kit. Phosphorylated eIF2α protein levels were analyzed and compared with unphosphorylated eIF2α levels using β-actin as an internal control. Rabbit polyclonal anti-phospho-eIF2α and anti-eIF2α antibodies were purchased from Cell Signaling Technology and New England Biolabs (Pickering, Ontario, Canada). Anti-NPC1L1 and anti-SRBI antibodies were from Novus Biologicals (Canada). Anti-HSP60 antibody was from Wuhan Boster Biological Technology (China). Anti-INSIG1, anti-translocation in renal cancer from chromosome 8 (TRC8), anti-ACAT2, and anti-NPC2 antibodies were from Santa Cruz Biotechnology. ABCA1 antibody was a kind gift from Dr. Michael Fitzgerald. Rabbit polyclonal anti-β-actin antibody was purchased from Rockland Immunochemicals (Gilbertsville, PA). Western blots were carried out as described previously (8).
Intraperitoneal Glucose Tolerance Test
Mice were fasted overnight. They were then weighed, and their fasting plasma glucose readings were measured from tail vein blood using Compact Accu-Chek strips and a glucometer. Mice were then injected with 10% glucose at 1 g/kg of body weight intraperitoneally, and plasma glucose levels were measured at 15, 30, 60, and 120 min.
Plasma Lipid Analyses
Mice were fasted overnight and anesthetized using a 2.5% 2,2,2-tribromoethanol (TBE) intraperitoneal injection at 0.3 mg/kg of body weight. Cardiac puncture was performed to collect 1 ml of blood. Plasma was isolated, and total values of total cholesterol (TC), free cholesterol (FC), triglyceride (TG), and phospholipid (PL) were measured using enzymatic assay kits from Wako Industries (Richmond, VA). Plasma was separated by size exclusion chromatography on a Superose 6HR column (Amersham Biosciences), and the fractions were analyzed for cholesterol to determine lipoprotein concentrations (4).
Liver Perfusion and Primary Hepatocyte Treatments
Chow-fed female mice of 9–11 weeks of age were anesthetized by 2.5% 2,2,2-tribromoethanol injection to achieve complete general anesthesia. Primary hepatocytes were isolated by liver perfusion as described previously (17). The cells were seeded into BD PrimariaTM surface-modified polystyrene 6 well plates (1 × 10⁶ cells/well) (BD Biosciences) and incubated at 37 °C in 5% CO2.
Cholesterol, Cyclodextrin, and Zaragozic Acid (ZA) Treatments
Cholesterol was complexed to 5% MCD and delivered to cells at a concentration of 10, 20, or 40 μg/ml for 16 h using MCD as a control. HPCD was diluted in double distilled H2O to a stock concentration of 100 mg/ml, and then the hepatocytes were treated with 1% HPCD solution in serum-free medium for 1.5 h using double distilled H2O as a control. ZA was diluted in DMSO to a stock concentration of 1 mg/ml, and the primary hepatocytes were treated at a concentration of 1 μm in serum-free medium for 12 h using DMSO as a control.
ACAT2 Inhibitor Treatment
PPPA was dissolved in methanol to a stock concentration of 100 μg/ml, and then the hepatocytes were first treated with cyclodextrin-cholesterol at a concentration of 30 μg/ml for 16 h. Then PPPA at a concentration of 5 μg/ml in α-minimum Eagle's medium was added for 30 min using methanol as a control. RNA was extracted as described above for quantitative real time PCR analysis.
Hepatic Lipid Analyses
Lipids were extracted from liver tissue (100–200 mg) using a modified version of the method of Folch et al. (18). Briefly, liver tissue was homogenized in 5 ml of 2:1 chloroform-methanol solution containing 0.005% butylated hydroxytoluene (Sigma) and 1 ml of 50 mm NaCl. Homogenates were centrifuged at 1500 × g for 30 min after which the organic phase was transferred and washed twice with 0.36 m CaCl2 solution and 30 min of centrifugation. The final organic phase was transferred to a volumetric flask and diluted to a final volume of 5 ml with chloroform containing butylated hydroxytoluene. Using 100 (for cholesterol) or 50 μl (for triglyceride) of lipid extract and 10 μl of 1:1 chloroform-Triton X-100, which was dried down under a stream of nitrogen, TC (Beckman Coulter), FC (Wako), and TG (Beckman Coulter) levels were measured against their respective standard curves and normalized to the initial liver mass used.
Mitochondrial Isolation and Lipid Analysis
Mitochondria were isolated using the Qproteome mitochondrial isolation kit (Qiagen, Canada). Briefly, freshly excised liver tissues were washed using 0.9% NaCl solutions, minced, and kept on ice. All the procedures were conducted at 4 °C. The liver tissue samples were then homogenized in lysis buffer and incubated for 10 min. The homogenates were then centrifuged at 1000 × g for 10 min. The cell pellets were resuspended in disruption buffer and disrupted using a Dounce homogenizer. The lysates were centrifuged at 1000 × g for 10 min. The supernatants were collected and centrifuged at 6000 × g for 10 min. The pellet containing mitochondria was collected and washed with mitochondrial storage buffer by centrifuging at 6000 × g for 20 min. The pellets were suspended in 300 μl of storage buffer for future protein measurement and lipid extraction. The lipid extraction was as described above for hepatic tissue extraction. In the final organic phase, 1000 μl was used for cholesterol, and 500 μl was used for triglyceride.
ER Membrane Lipid Analyses
Hepatic ER membranes were isolated using a modified version of the method described previously by Radhakrishnan et al. (16) and Klett et al. (19). Liver tissue was homogenized and centrifuged at 100,000 × g for 40 min to produce a crude membrane pellet. The pellet was then resuspended in sucrose solution and loaded onto a sucrose gradient. After ultracentrifugation at 100,000 × g for 1 h, the heavier membrane layer was extracted and purified on an iodixanol gradient at 110,000 × g for 2 h. The resulting gradient was collected in 13 fractions. Equal volumes of each fraction were used to identify the presence of ACAT2 proteins by Western blotting to identify the ER membrane-containing fractions. Lipids were extracted from the ACAT2-positive fractions. The concentration of free cholesterol was determined by LC/MS/MS, and the concentration of choline phospholipids was determined using an enzymatic assay kit (Wako).
LC/MS/MS Analysis of ER Cholesterol
Lipid extract samples described above were dissolved in 100% methanol and analyzed on a 6410 LC/MS/MS instrument (Agilent Technologies, Ontario, Canada) with an electrospray ionization source in positive ion mode. A 50-μl sample was separated on a Zorbax XDB C18 column (4.6 × 50 mm, 3.5 μm) by gradient elution at 0.4 ml/min. The mobile phase consisted of HPLC grade water (A) and methanol (B), both containing 5 mm ammonium acetate. The following gradient program was run: 0–1 min, 90% B; 1–3.3 min, 90–100% B; 3.3–20 min, 100% B. MS parameters were as follows: nebulizer pressure, 35 p.s.i.; drying gas (nitrogen), 10 liters/min; capillary voltage, 4000 V (positive); column temperature, 40 °C; drying gas temperature, 175 °C for all compounds. The following transitions were observed in multiple reaction monitoring mode: cholesterol-d7 (m/z 411 → 376; retention time; 12.5 min) and cholesterol (m/z 404 → 369; retention time, 12.6 min). Fragmentor voltage was 105 V, and collision energy was 1 V. The cholesterol concentrations in each sample were then determined using the standard curve and normalization to the amount of internal standard present.
Statistical Analysis
Unpaired t tests with Welch's correction were used when comparing two group means. One-way ANOVA followed by a Tukey post test was used for multiple group pairwise comparisons. When group data were determined to have unequal variance by Bartlett's test, data were reanalyzed after transformation to confirm equality of variance. The Mann-Whitney U non-parametric test was used for pairwise comparisons if variance remained unequal after transformation. The Kruskal-Wallis test followed by Dunn's correction for multiple comparisons was used for non-parametric multiple group analysis. Two-way ANOVA was used for comparing means of multiple groups with two independent variables. All analyses were performed using GraphPad Prism V5.0 software (GraphPad Software Inc., La Jolla, CA) except for Bartlett's test, which was performed with SAS version 9.3 (SAS Institute, Cary, NC). A p value <0.05 was considered to be statistically significant. Correlations between ER stress markers and ER or tissue cholesterol were analyzed with non-linear regression analysis with best fit to an exponential growth curve using GraphPad Prism V5.0 software.
RESULTS
Ldlr−/−xLcat+/+ Mice Are Susceptible to Dietary Cholesterol-induced ER Stress and Impairment of Glucose Tolerance, and Ldlr−/−xLcat−/− Mice Are Protected from These Phenotypes
To investigate the role of cholesterol loading in the induction of hepatic ER stress, we fed the female C57Bl/6 (WT), Ldlr−/−xLcat+/+ (SKO), and Ldlr−/−xLcat−/− (DKO) mice a 2% HCD for 10 weeks. As seen in Fig. 1, we observed a significant 2.9-, 2.6-, and 1.8-fold increase in hepatic TC, FC, and TG levels, respectively, in the WT mice when compared with their chow-fed controls (p < 0.05) (Fig. 1, a–c). With the 10-week feeding of a 2% HCD, significant inductions in TC (2.9-fold), FC (2.1-fold), and TG (1.8-fold) were also observed in Ldlr−/−xLcat+/+ mice (p < 0.05). Comparable inductions of hepatic TC, FC, and TG were also observed in the Ldlr−/−xLcat−/− mice at 3.0-, 2.3-, and 1.8-fold, respectively (Fig. 1, a–c).
FIGURE 1.

a–c, hepatic lipid analyses on 9-week-old female WT (n = 4), Ldlr−/−xLcat+/+ (SKO) (n = 5), and Ldlr−/−xLcat−/− (DKO) (n = 5) mice fed either a chow (filled bars) or a 2% HCD (open bars) for 10 weeks. Data are means ± S.D. (error bars). a, total cholesterol; b, free cholesterol; and c, triglyceride. *, p < 0.05 for SKO versus WT; **, p < 0.05 for DKO versus SKO on the same diet; #, p < 0.05 for HCD versus chow by one-way ANOVA and Tukey post test. d and e, protective effect of LCAT deficiency in cholesterol diet-induced ER stress. 9-week-old female SKO and DKO mice (n > 4) were fed either a chow diet or 2% HCD for 10 weeks, and hepatic tissue mRNA was measured for Chop (c) and Xbp1-s (d). *, p < 0.05 for SKO versus WT; **, p < 0.05 for DKO versus SKO on the same diet; #, p < 0.05 for HCD versus chow by one-way ANOVA and Tukey post test. arb, arbitrary.
We also examined the relationship between the hepatic tissue lipid and hepatic ER stress response to the 10-week HCD. Under the chow-fed condition, the Ldlr−/−xLcat+/+ mouse liver TC and FC levels were 1.12- and 1.21-fold higher, respectively, compared with their WT controls (p < 0.05) (Fig. 1, a and b). In the Ldlr−/−xLcat−/− mice, hepatic TC and FC were significantly reduced when compared with there respective levels in the Ldlr−/−xLcat+/+ mice and reverted toward WT levels. These changes correlated with increased expression of UPR markers in the Ldlr−/−xLcat+/+ mice and reversal to WT levels in the Ldlr−/−xLcat−/− mice as reported previously (8). Despite a similar increase in tissue cholesterol in response to the HCD, these mice showed differential responses in the induction of markers of UPR. As seen in Fig. 1, d and e, we observed an absence of induction of two UPR markers, Chop mRNA and Xbp1-s mRNA, in the WT mice fed the HCD for 10 weeks. On the other hand, the Ldlr−/−xLcat+/+ mice showed not only a slightly elevated level of the UPR markers on a chow diet as reported previously (8) but also developed a marked increase in both markers on the HCD diet. Interestingly, the Ldlr−/−xLcat−/− mice not only showed reversal of the UPR marker levels to the base line on chow diet but also resisted the HCD-induced ER stress (Fig. 1, d and e).
To further characterize the impact of dietary cholesterol on hepatic ER stress, insulin resistance, and body weight, we examined the time course of these phenotypes in response to the HCD. Within 4 weeks of HCD feeding, the Ldlr−/−xLcat+/+ mice already displayed a gene profile that showed induction of hepatic ER stress. The mRNA levels of both Chop and Xbp1-s (Fig. 2, a and b) were significantly up-regulated by 2.5- and 1.8-fold, respectively (p ≤ 0.04). The notion of early induction of hepatic ER stress upon only 4 weeks of HCD feeding was further substantiated by a concomitant 4.6-fold (p = 0.01) induction of eIF2α phosphorylation (Fig. 2c) when compared with their chow-fed controls (p = 0.01). These inductive effects were independent of body weight gain (0.83 ± 0.66 versus 0.80 ± 0.47 g; p = 0.95) or impairment of glucose tolerance (area under the glucose excursion curve, 842.8 ± 55.16 versus 749.5 ± 83.8; p = 0.4). In the case of Ldlr−/−xLcat−/− mice, hepatic levels of the same UPR markers were unaffected after the 4-week HCD feeding (Fig. 2, a–c).
FIGURE 2.

a–c, hepatic UPR expression in response to a high cholesterol diet. 20-week-old female SKO and DKO mice were fed either chow or 2% HCD (n = 4 for each group) for 4 weeks. Effects of HCD feeding were determined on hepatic tissue UPR markers Chop mRNA (a), Xbp1-s mRNA (b), and phospho-EIF2α (P-eif2α) protein (c) levels. Data are means ± S.D. (error bars). *, p < 0.05 for HCD-fed mice versus their respective chow-fed controls by unpaired t test with Welch's correction. d and e, glucose tolerance test in female SKO and DKO mice after 10 weeks of a 2% HCD. d, mean glucose excursions in response to an intraperitoneal glucose challenge. e, mean area under the glucose excursion curve (AUC). *, p < 0.05 against their respective genotype control (SKO); #, p < 0.05 compared with diet control (chow) by one-way ANOVA and Tukey post test. arb, arbitrary.
HCD treatment for 10 weeks resulted in impairment in glucose tolerance on the basis of significant elevation of area under the glucose excursion curves (1.2-fold; p < 0.05) (Fig. 2, d and e) when compared with chow-fed controls in the Ldlr−/−xLcat+/+ mice and in the absence of excess weight gain when comparing HCD- versus chow-fed mice (3.54 ± 0.55 versus 3.58 ± 1.66 g; p = 0.58). However, the same dietary treatment did not increase the area under the curve in the Ldlr−/−xLcat−/− mice. There was also no significant difference in weight gain between the two diet groups (4.66 ± 1.0 versus 2.86 ± 1.34 g; p = 0.14), suggesting that cholesterol-induced hepatic ER stress precedes the development of glucose intolerance and is independent of weight gain. Our findings are also consistent with the previous observation that hepatic ER stress promotes insulin resistance through activation of JNK signaling (11, 12).
To rule out the possible influence of differential alterations in plasma lipoproteins in the Ldlr−/−xLcat−/− mice in response to the HCD, we analyzed plasma lipoprotein levels by FPLC. We observed development of significant hyperlipidemia in both Ldlr−/−xLcat+/+ and Ldlr−/−xLcat−/− mice to comparable extents in response to the HCD. As shown in Fig. 3, for Ldlr−/−xLcat+/+ mice, we observed a marked increase in mean fasting cholesterol in the low density lipoprotein (LDL) fractions (4.95 ± 0.40 versus 2.73 ± 0.08 mm; p < 0.05) and the very low density lipoprotein (VLDL) fractions (4.99 ± 1.15 versus 0.33 ± 0.03 mm; p < 0.05). On the same diet, the Ldlr−/−xLcat−/− mice also developed a significant increase in fasting plasma cholesterol in both the LDL (7.51 ± 1.92 versus 1.92 ± 0.35 mm; p < 0.05) and VLDL fractions (4.18 ± 0.52 versus 1.83 ± 0.83; p < 0.05).
FIGURE 3.
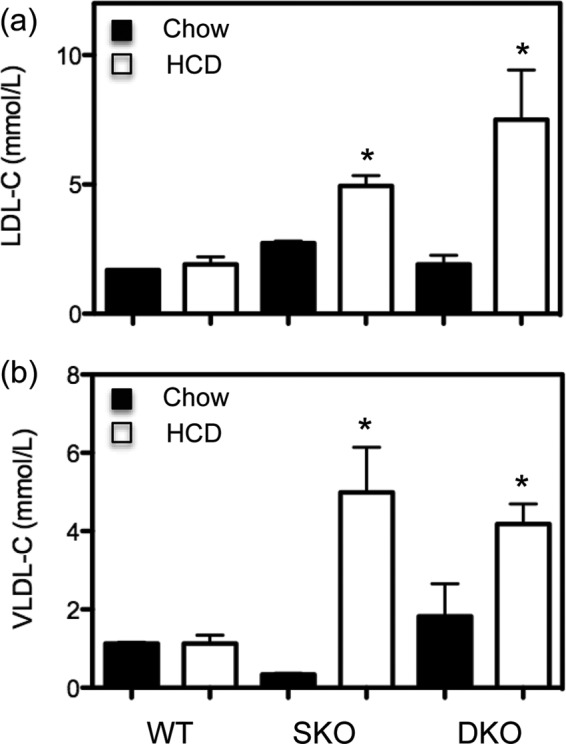
Lipoprotein analyses in SKO and DKO mice fed either chow or 2% HCD for 10 weeks. Cholesterol (C) was measured in FPLC fractions of the plasma samples and pooled into LDL (a) and VLDL (b) fractions for analyses. Data are means ± S.D. (error bars). *, p < 0.05 compared with their respective diet (chow) controls by one-way ANOVA and Tukey post test.
Primary Hepatocytes of Ldlr−/−xLcat+/+ Mice, but Not Ldlr−/−xLcat−/− Mice, Are Susceptible to Induction of ER Stress by Exogenous Cholesterol
To further support the hypothesis that exogenous cholesterol directly induces ER stress in the liver, we treated primary hepatocytes from Ldlr−/−xLcat+/+ mice with escalating doses of cholesterol complexed to MCD. We observed a marked dose-dependent increase in the mRNA levels of Chop and Xbp1-s (Fig. 4, a and b), suggesting that the Ldlr−/−xLcat+/+ mice are susceptible to cholesterol-induced hepatic cholesterol accumulation and ER stress. On the other hand, the Ldlr−/−xLcat−/− mice demonstrated a marked resistance to Chop and Xbp1-s mRNA induction at all cholesterol concentrations tested (Fig. 4, a and b).
FIGURE 4.
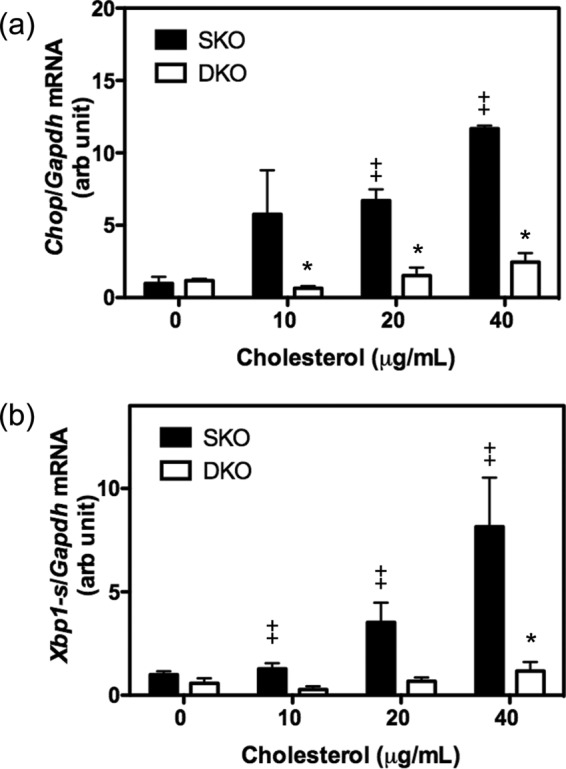
Cholesterol induction of ER stress in primary hepatocytes from 9–11-week-old female SKO and DKO mice. Primary hepatocytes were treated with cholesterol-MCD complex for 16 h at 0, 10, 20, and 40 μg/ml; RNA was isolated; and mRNA expression levels of Chop (a) and Xbp1-s (b) were quantified by quantitative real time PCR. Data are means ± S.D. (error bars). *, p < 0.05 for comparison with genotype (SKO) for each concentration; ‡, p < 0.05 for comparison with untreated (0 μg/ml) controls by two-way ANOVA. n > 4 for all samples. arb, arbitrary.
Free Cholesterol Levels in ER Membrane Are Elevated in Ldlr−/−xLcat+/+ Mice but Are Markedly Decreased in Ldlr−/−xLcat−/− Mice
To further investigate the unexpected dissociation between elevated hepatic tissue cholesterol and the absence of elevated hepatic ER stress markers in the HCD-fed Ldlr−/−xLcat−/− mice, we hypothesized that the ER membrane is protected from cholesterol accumulation in response to the HCD, preventing the development of hepatic ER stress. The WT, Ldlr−/−xLcat+/+, and Ldlr−/−xLcat−/− mice were all fed either the chow diet or HCD for 10 weeks. We then isolated hepatic ER membranes and measured their FC and PL content. On chow diet, the Ldlr−/−xLcat+/+ mice had a higher ER membrane FC/PL ratio compared with the WT mice (1.52-fold), and the Ldlr−/−xLcat−/− mice showed a 66.9 and 49.0% reduction (p < 0.05) compared with the Ldlr−/−xLcat+/+ and WT mice, respectively. After 10 weeks of HCD feeding, the Ldlr−/−xLcat+/+ mice showed a significant 1.5-fold (p < 0.05) increase in ER FC/PL, but this inductive response was unexpectedly absent in the Ldlr−/−xLcat−/− mice (Fig. 5a). Further analysis revealed that the variation in ER membrane FC/PL ratio between groups is attributed to the variation in FC level alone as PL/g of liver levels are similar among all groups (p = 0.52 by Kruskal-Wallis analysis). By combining the findings from the three genotypes under two dietary conditions, we observed a striking difference in correlation comparing the Chop mRNA-hepatic ER cholesterol (FC/PL) relationship (R2 = 0.55 on non-linear regression with best fit exponential curve) and that of Chop mRNA-hepatic FC (R2 = 0.05) (Fig. 5, b and c). Alternatively, a non-parametric Pearson correlation analysis resulted in a Spearman r value of 0.94 (p = 0.017) between the mean Chop mRNA and mean ER FC/PL), whereas the Spearman r value was 0.20 (p = 0.71) between mean Chop mRNA and mean hepatic tissue FC levels.
FIGURE 5.

a–c, induction of hepatic ER cholesterol in the SKO mice and resistance to induction in the DKO mice. a, 9-week-old female mice were fed either a chow diet or 2% HCD for 10 weeks. ER membrane fractions were isolated from liver tissues after an overnight fast. FC was measured by LC/MS/MS, and PL levels were obtained by colorimetric assay. Data are means ± S.D. (error bars). *, p < 0.05 compared with their respective WT controls; ‡, p < 0.05 compared with their respective SKO controls; #, p < 0.05 compared with diet control (chow diet) (n > 3) by one-way ANOVA and Tukey post test. The correlation of ER stress marker Chop mRNA levels with ER FC (Chol)/PL (b) and hepatic tissue free cholesterol (c) in WT, SKO and DKO mice on chow and 2% HCD is shown. The solid line indicates the curve of best fit using an exponential non-linear regression analysis. d and e, hepatic expression of HSP60 protein in age-matched female WT, SKO, and DKO mice fed with either chow (d) or 4 weeks of 2% HCD (e). One-way ANOVA with Tukey post test revealed no difference between any pair of data within the group. arb, arbitrary.
Mitochondrial Cholesterol and Mitochondrial Stress Are Unaffected by Absence of LCAT in Both Chow- and HCD-fed Animals
To rule out the possible contribution of altered hepatic mitochondrial stress to the protective metabolic phenotypes from altered mitochondrial cholesterol, we quantified both total and free cholesterol in mitochondrial fractions isolated from both chow- and HCD-fed Ldlr−/−xLcat+/+ and Ldlr−/−xLcat−/− mouse livers. There was no difference in mitochondrial TC and FC between the two groups when fed a chow diet. Mitochondrial total cholesterol for Ldlr−/−xLcat+/+ versus Ldlr−/−xLcat−/− mice was 3.74 ± 0.80 versus 3.54 ± 0.19 μg/mg of protein (p = 0.85) (chow) and 8.88 ± 0.7 versus 7.02 ± 0.81 μg/mg (p = 0.14) (HCD). Mitochondrial free cholesterol levels were 3.61 ± 0.85 versus 3.25 ± 0.27 μg/mg (p = 0.76) (chow) and 3.32 ± 0.30 versus 4.06 ± 0.48 μg/mg (p = 0.26) (HCD). We also measured hepatic expression of HSP60, a mitochondrion-specific stress marker, and observed no difference between each genotypic group under both chow- and HCD-fed conditions (Fig. 5, d and e).
ER Cholesterol in Chow-fed Ldlr−/−xLcat+/+ Mice Contributes to Basal Elevation of Hepatic UPR
To further explore the hypothesis that ER cholesterol in the Ldlr−/−xLcat+/+ mice contributes to the elevated UPR markers, we tested the effects of two independent methods of lowering ER cholesterol. We treated primary hepatocytes with (a) HPCD to remove membrane cholesterol and (b) ZA to inhibit squalene synthase and thus cholesterol biosynthesis. Consistent with the known effects of these inhibitors, we observed marked reduction in ER membrane cholesterol in both HPCD- and ZA-treated primary hepatocytes by 65 and 85%, respectively, although only the ZA treatment reached statistical significance by one-way ANOVA (Fig. 6a). In agreement with our hypothesis, we observed a 66 and 82% reduction in Chop mRNA and a 52 and 54% reduction in Xbp1-s mRNA after treatment with HPCD and ZA, respectively (p < 0.05) (Fig. 6, b and c).
FIGURE 6.

Effect of ZA and HPCD on ER free cholesterol (chol) (a) and hepatic Chop (b) and Xbp1-s mRNA (c) in primary hepatocytes from chow-fed female Ldlr−/−xLcat+/+ mice. Data are means ± S.D. (error bars). *, p < 0.05 when compared with untreated control cells (n > 4) by one-way ANOVA and Tukey post test. Results in b were confirmed by repeat one-way ANOVA and Tukey post test after square root transformation. arb, arbitrary.
Cholesterol Accumulation in Ldlr−/−xLcat+/+ ER Membrane Is Not Due to Elevated Cholesterol Biosynthesis but Increased Uptake of Cholesterol from Biliary and Intestinal Origins
To elucidate the mechanism by which the HCD-fed Ldlr−/−xLcat−/− ER is protected from cholesterol accumulation, we began by analyzing how cellular cholesterol and ER cholesterol are regulated in the Ldlr−/−xLcat+/+ mice under both chow and HCD feeding. Under chow-fed conditions, we observed significant reductions in both nuclear nSREBP2 protein levels (76%; p < 0.05) and Hmgr mRNA levels (38%; p < 0.05) when compared with the WT controls (Fig. 7, a and b). These results suggest that endogenous cholesterol biosynthesis is reduced and that the excess cellular cholesterol and ER cholesterol seen in the Ldlr−/−xLcat+/+ mice are exogenous in origin. Correspondingly, we also observed a marked down-regulation of INSIG1, a key ER-resident protein that regulates SREBP processing and is also one of the target genes of SREBP2. We observed a 45% reduction in mRNA and a 33% reduction in protein levels, consistent with its expression level being strongly driven by SREBP2 (Fig. 7, d and e).
FIGURE 7.

a, hepatic levels of markers of cholesterol homeostatic machinery in livers of chow- and HCD-fed WT, SKO, and DKO mice. 9-week-old female mice were fed either chow or a 2% HCD for 10 weeks, and hepatic tissues were harvested after an overnight fast. a, nuclear protein abundance of nSREBP2 by Western blot (n = 3–6). b and c, Hmgr mRNA levels (n = 4 each). d, Insig1 mRNA levels (n = 4 each). e and f, INSIG1 protein levels (n = 4–7). TRC8 protein levels in chow-fed mice (n = 7–8) (g) and HCD-fed mice (n = 3 each) (h) are shown. Data are means ± S.D. (error bars). *, p < 0.05 compared with their respective genotype WT controls; #, p < 0.05 compared with SKO control by one-way ANOVA and Tukey post test. arb, arbitrary.
In the case of Ldlr−/−xLcat−/− mice, under chow-fed conditions, the marked reduction in the ER cholesterol to levels below those of WT mice was associated with a reversal of nSREBP2 to the WT levels (Fig. 7a). This is paralleled by full reversal in the mRNA levels of Hmgr and Insig1, which are both target genes of SREBP2, as well as the INSIG1 protein level (Fig. 7, b, d, and e).
After 10 weeks of HCD feeding, in the Ldlr−/−xLcat+/+ mice, we observed further down-regulation of the nSREBP2 level and corresponding reduced Hmgr mRNA and INSIG protein levels (Fig. 7, a, c, and f). Unexpectedly, in the Ldlr−/−xLcat−/− mice, despite a markedly reduced level of ER cholesterol as seen in their chow-fed counterparts, we observed only a minor reversal in the nSREBP2 protein, Hmgr mRNA, and INSIG1 protein (Fig. 7, a, c, and f).
To further investigate possible mechanisms for the unexpected suppression of nSREBP2 in the HCD-fed Ldlr−/−xLcat−/− mice, we measured the protein level of TRC8, an intrinsic ER protein known to hinder SREBP2 cleavage in the Golgi, thus causing a reduction in nSREBP2 and the expression of its target genes. In chow-fed mice, the TRC8 protein level was 1.8-fold (p < 0.05) up-regulated, and its level was significantly reduced back to the WT level in the Ldlr−/−xLcat−/− mice, consistent with the notion that TRC8 suppresses SREBP2 processing (Fig. 7g). Likewise, with HCD feeding, TRC8 was up-regulated 1.5-fold in the Ldlr−/−xLcat+/+ mice versus the WT control but remained elevated in the Ldlr−/−xLcat−/− mice (1.6-fold increase versus WT; p < 0.05) (Fig. 7h).
To investigate the mechanism for the hepatic cholesterol accumulation in the Ldlr−/−xLcat+/+ mouse liver and its reversal seen in the Ldlr−/−xLcat−/− mice, we examined the role of the hepatobiliary cholesterol pathways. As shown in Fig. 8a, we detected a significant reduction in the biliary cholesterol level in the Ldlr−/−xLcat+/+ mice, and this was reversed in the Ldlr−/−xLcat−/− mice. To test the role of specific transporters, we first observed that the mRNA levels of Abcg5 and Abcg8, genes encoding the two half-transporters mediating efflux of hepatic cholesterol into the bile, were reduced by 86 (p < 0.05) and 69% (p < 0.05), respectively (Fig. 8, b and c). We also observed a marked 5.8-fold (p < 0.05) increase in the intestinal protein level of NPC1L1 in the Ldlr−/−xLcat+/+ mice (Fig. 8d). Together, in the Ldlr−/−xLcat+/+ mice, the combined up-regulation of intestinal NPC1L1 and the reduction in hepatic Abcg5/8 expressions would promote a net accumulation of hepatic cholesterol. Likewise, these findings are reversed toward their respective WT levels to variable extents in the Ldlr−/−xLcat−/− mice, consistent with the reversal of the hepatic and biliary cholesterol levels (Fig. 8, a–d).
FIGURE 8.

Biliary cholesterol levels and expression of hepatic and intestinal cholesterol transporters in chow-fed WT, Ldlr−/−xLcat+/+ (SKO), and Ldlr−/−xLcat−/− (DKO) mice. a, biliary cholesterol (Chol) concentrations (n = 4–5). Shown are mRNA expressions of hepatic Abcg5 (n = 8 each) (b) and Abcg8 (n = 4 each) (c), intestinal NPC1L1 protein (n = 6 each) (d), hepatic Npc1l1 mRNA (n = 4 each) (e), protein levels of hepatic NPC1L1 (n = 5–7) (f) and hepatic NPC2 (n = 4 each) (g), hepatic Abcb4 mRNA (n = 3 each) (h), and protein levels of hepatic ABCA1 (n = 6 each) (i) and SRBI (n = 3 each) (j). Data are means ± S.D. (error bars). *, p < 0.05 compared with their respective genotype WT controls; #, p < 0.05 compared with SKO control by one-way ANOVA and Tukey post test. Results in a and d were confirmed by Kruskal-Wallis test followed by Dunn's multiple comparisons, and results in b were confirmed by unpaired t tests with Welch's correction. arb, arbitrary; Sml, small.
In addition to the above findings, we also found a 13.8-fold up-regulation of the hepatic Npc1l1 mRNA level in the Ldlr−/−xLcat+/+ mice. Despite the low abundance of NPC1L1 protein mass in mouse liver, we detected a modest but significant 1.5-fold (p < 0.05) increase in NPC1L1 mass in the Ldlr−/−xLcat+/+ mouse liver over that of the WT by Western blotting (Fig. 8, e and f). In the Ldlr−/−xLcat−/− mouse liver, the Npc1l1 mRNA levels were significantly reduced by 65% (p < 0.05), whereas the NPC1L1 protein levels were reduced by 57% (p < 0.05) when compared with their respective Ldlr−/−xLcat+/+ group (Fig. 8, e and f). To further address the significance of the changes in hepatic NPC1L1 expressions, we measured the hepatic Niemann-Pick C2 protein levels as recent reports have suggested that the soluble NPC2 protein also participates in stimulating biliary cholesterol efflux in an ABCG5/G8-dependent manner and that its hepatic and biliary levels are negatively modulated by hepatic NPC1L1 (20, 21). We observed a significant 70% reduction in the hepatic NPC2 level in the Ldlr−/−xLcat+/+ mice, and this was also significantly reversed by 2.2-fold in the Ldlr−/−xLcat−/− mice (Fig. 8g). Hepatic mRNA expression of Abcb4, the gene encoding for ABCB4, which is known to mediate secretion of biliary phospholipid and cholesterol, was not significantly altered in the Ldlr−/−xLcat+/+ mice but was markedly up-regulated in the Ldlr−/−xLcat−/− mice (Fig. 8h).
We also investigated the possible roles of the transporters ABCA1 and SRBI in the liver and observed no change in their protein and mRNA expression levels when compared with the WT controls (Fig. 8, i and j). Collectively, our data suggest that the accumulation of hepatic cellular cholesterol seen in the Ldlr−/−xLcat+/+ mice is largely attributable to the coordinated change in the expressions of intestinal NPC1L1, hepatic Abcg5 and Abcg8, hepatic NPC2, and possibly hepatic NPC1L1. Taken together, these changes are suggestive of a coordinated increase in the cholesterol reuptake from and decrease in the cholesterol efflux to the bile in support of the observed changes in the biliary cholesterol (Fig. 8).
Ldlr−/−xLcat−/− Mice Fed HCD Have Altered Cholesterol Regulatory Machinery and Are Protected from ER Cholesterol Accumulation
To investigate the unexpectedly low levels of ER cholesterol in the HCD-fed Ldlr−/−xLcat−/− mice, we first observed that the nSREBP2 protein mass and Hmgr mRNA of these mice remained suppressed despite a low level of ER cholesterol (Fig. 7, a and c). We further investigated the possible role of ACAT2, the dominant isoform of ACAT in mouse liver, in the modulation of ER cholesterol by measuring ACAT2 protein levels in all three genotypes on both the chow diet and HCD. Although not statistically significant, we observed a slight down-regulation of ACAT2 protein level in the chow-fed Ldlr−/−xLcat−/− mice (Fig. 9a), consistent with the mRNA level findings reported previously (5). However, after HCD feeding, the Ldlr−/−xLcat−/− mice developed a striking increase in ACAT2 protein levels (Fig. 9a) along with elevated tissue cholesterol and elevated plasma cholesterol but subnormal ER free cholesterol levels. To further investigate the functional role of ACAT2 in the maintenance of low ER cholesterol, we treated cultured primary hepatocytes of Ldlr−/−xLcat−/− mice with PPPA, an ACAT2-specific inhibitor (22, 23), and we observed a 5.6-fold increase in ER cholesterol (p = 0.027) in association with a marked increase in UPR marker mRNA expressions (4-fold for Chop (p = 0.023) and 6.7-fold for Xbp1-s (p = 0.037)) (Fig. 9b).
FIGURE 9.

a, expression of ACAT2 in WT, SKO, and DKO mice. Hepatic tissue protein levels of ACAT2 for both chow- and 2% HCD-fed, age-matched mice by two-way ANOVA. Data are means ± S.D. (error bars). *, p < 0.05 when compared with their respective chow fed controls. #, p < 0.05 when compared with HCD-fed WT control. b, effect of ACAT2 inhibition on ER cholesterol and ER stress. Primary hepatocytes from HCD-fed DKO mice were pretreated with cholesterol-MCD for 16 h followed by treatment with PPPA (Chol + PPPA), a specific ACAT2 inhibitor, for 30 min or with methanol (Chol) as control. Effects of PPPA treatment on ER free cholesterol and Chop mRNA and Xbp1-s mRNA levels versus their respective untreated controls by unpaired t tests with Welch's correction are shown. *, p < 0.05.
DISCUSSION
Here we report the first evidence of an in vivo rodent model, namely the LDL receptor knock-out mouse, whereby cholesterol can induce hepatic ER stress through FC accumulation in the ER. In this dyslipidemic background, we also report that LCAT deficiency confers protection from cholesterol-induced ER stress through selectively protecting the ER from accumulation of cholesterol that is independent of total hepatic cholesterol content.
We recently reported that hepatic ER stress plays an important role in mediating the enhanced susceptibility of the Ldlr−/−xLcat+/+ mice to high fat, high sucrose diet-induced obesity and insulin resistance (8, 24). We observed that these protective phenotypes were in part attributable to the protection from hepatic ER stress (8, 9). The mechanism underlying the protective effect of LCAT on hepatic ER stress is unclear. We hypothesize that modulation of ER cholesterol plays an important role. Although attractive, the testing of this hypothesis has been challenged by the absence of a model of cholesterol-induced hepatic ER stress even in the case of a high cholesterol diet (15). In the present study, feeding the C57Bl/6 WT mice with a 2% HCD also failed to induce the UPR in the liver. Consistent with this finding, our data showed that in WT mice an HCD does not raise hepatic ER cholesterol, providing a plausible explanation for the absence of ER stress induction. On the other hand, in Ldlr−/−xLcat+/+ mice fed the same HCD, we showed a marked induction of hepatic ER stress and concurrent accumulation of cellular and ER cholesterol in the absence of excess body weight gain. Furthermore, treatment of primary hepatocytes with HPCD and ZA, two independent approaches to lower ER cholesterol, resulted in the resolution of UPR in the LDLR−/− background. Therefore, cholesterol accumulation within the ER membrane induces ER stress not only in macrophages (13, 14) but also in hepatocytes.
The mechanism of excess accumulation of cellular and ER membrane cholesterol in the chow-fed Ldlr−/−xLcat+/+ mice has not been investigated to date. In the present study, we made the following observations: 1) significantly reduced endogenous cholesterol biosynthesis in the liver as evidenced by a combined down-regulation of nuclear nSREBP2 protein abundance and reduced level of Hmgr mRNA, suggesting that the excess hepatic cholesterol is from exogenous sources; 2) coordinated changes in expression of cholesterol-modulating genes in the promotion of hepatic cholesterol accumulation and reduced net biliary cholesterol export; and 3) increased intestinal expression of NPC1L1. Many of these mechanisms are also responsible for the observed reversal in hepatic cholesterol in the Ldlr−/−xLcat−/− mice.
First, we observed a significant up-regulation of intestinal NPC1L1, which is likely an important source of exogenous cholesterol in the Ldlr−/−xLcat/+ mice. This change is associated with a marked reduction in hepatic Abcg5 and Abcg8 mRNAs, which encode two key half-transporters that mediate cholesterol efflux into the bile (25, 26). Collectively, these changes are likely to be the major factors in the excess cholesterol accumulation in the Ldlr−/−xLcat+/+ liver. In the Ldlr−/−xLcat−/− mice, the intestinal NPC1L1 protein level and hepatic Abcg8 mRNA level were completely reversed, whereas the Abcg5 level reversal was partial (Fig. 8).
A transgenic mouse study affirmed that hepatic NPC1L1 in mouse liver is localized to the biliary canaliculi and functions to mediate uptake of biliary cholesterol (27). Intriguingly, although known for its low expression in rodent livers, we also observed a significant up-regulation of hepatic Npc1l1 mRNA and NPC1L1 protein in the Ldlr−/−xLcat+/+ mice. These changes were also significantly reversed in the Ldlr−/−xLcat−/− mice (Fig. 8, e and f). Although modulation of hepatic expression of NPC1L1 in mice has been reported previously (28), its physiologic contribution to the mediation of cholesterol flux was not addressed. The observed changes in hepatic NPC1L1 seen in our mice could contribute to the observed reduction in biliary cholesterol in the Ldlr−/−xLcat+/+ mice and the reversal in the Ldlr−/−xLcat−/− mice (Fig. 8a) in conjunction with the corresponding changes in Abcg5 and Abcg8 expressions.
To further address the functional role of hepatic NPC1l1 in our models, we also measured the protein level of its downstream target, NPC2, which has been shown to be negatively regulated by hepatic NPC1L1 and also plays a role in stimulating cholesterol efflux in an ABCG5/G8-dependent manner. Our observation of a significant reduction in NPC2 in the Ldlr−/−xLcat+/+ mice and a reversal in the Ldlr−/−xLcat−/− mice supports the physiological relevance of hepatic NPC1L1 in biliary cholesterol transport.
The mechanism for the coordinated changes of these transporters is not known. Data to date suggest that Abcg5/g8 is transcriptionally regulated by liver X receptor, Abcb4 is transcriptionally regulated by farnesoid X receptor (29), and Npc1l1 at least in humans is transcriptionally regulated by dual regulation of SREBP2 and HNF1α as well as liver X receptor (30). Potential novel cross-talk between these pathways needs to be further explored.
In chow-fed Ldlr−/−xLcat−/− mice, hepatic cholesterol and triglycerides were significantly lower than those of the age- and gender-matched Ldlr−/−xLcat+/+ mice in association with the normalization of UPR markers back to the WT mouse levels. Concomitantly, ER cholesterol was also reduced in the Ldlr−/−xLcat−/− mice in association with a marked normalization of hepatic Npc1l1 mRNA, a 59% reduction in hepatic NPC1L1 protein, and a significant normalization of the intestinal NPC1L1 level. Feeding of the Ldlr−/−xLcat−/− mice with the HCD led to not only increased hepatic tissue TC and FC (Fig. 1) but also increased plasma VLDL cholesterol and LDL cholesterol (Fig. 3) and hepatic TC and FC to degrees comparable with those seen in the Ldlr−/−xLcat+/+ mice. However, the hepatic ER cholesterol remained unexpectedly low (below those of the WT mice) in the HCD-treated Ldlr−/−xLcat−/− mice in association with normal expression levels of UPR markers. This finding reinforced the idea that ER cholesterol, but not the total cellular cholesterol, is the critical determinant of the degree of ER stress. First, in vivo, there is a strong correlation between UPR marker levels and ER cholesterol but not total hepatic cholesterol (Fig. 5), and second, in vitro, resolution of UPR in primary hepatocytes occurred upon reduction of ER cholesterol either through squalene synthase inhibition or cyclodextrin treatment. In macrophages, cholesterol loading activates the UPR primarily through modulation of membrane fluidity and consequently impairment of the sarcoplasmic/endoplasmic reticulum calcium ATPase (31). It is possible that a similar mechanism also applies to hepatocytes, but this remains to be further tested.
The observations of achievement and maintenance of reduced ER cholesterol in the Ldlr−/−xLcat−/− mice under both diets are intriguing. In the chow-fed mice, the major changes are in the normalization of expressions of various lipid transporters, including intestinal NPC1L1, hepatic NPC1L1 protein and Npc1l1 mRNA, and Abcg8 mRNA, and partial resolution of Abcg5 mRNA. In addition, we also observed a significant increase in NPC2 protein that may be a result of a reduction in NPC1L1 protein (21). In turn, this increase may further augment the ABCG5/G8-mediated cholesterol efflux. Furthermore, the marked up-regulation of Abcb4, which mediates phosphatidylcholine secretion, may also contribute as phosphatidylcholine secretion is frequently accompanied by cholesterol secretion (32, 33). Meanwhile, as a result of these changes, the INSIG/SCAP/SREBP2 homeostatic machinery appeared to respond appropriately as predicted (16).
In the case of HCD-fed Ldlr−/−xLcat−/− mice, hepatic ER cholesterol remained low despite a marked increase in total tissue cholesterol. This was accompanied by markedly reduced levels of nSREBP2 and Hmgr mRNA. Mechanistically, our findings suggest that altered expressions of TRC8 and ACAT2 may both be contributory.
TRC8, an intrinsic ER protein, has been shown to modulate cholesterol homeostasis through formation of a complex with SCAP and SREBP2, hindering the interaction of SCAP and the COPII protein Sec24 and resulting in reduced cleavage of SREBP2 in the Golgi (34). TRC8 has also been shown to destabilize pre-SREBP2 with a reduced nSREBP2 level and the expressions of SREBP target genes as the final result (35). In our models, the levels of TRC8 changed with nSREBP2 in a reciprocal manner, consistent with its regulatory role in SREBP2 processing. On the other hand, its levels changed in parallel with ER cholesterol in all groups except in the HCD-fed Ldlr−/−xLcat−/− mice. The persistently elevated level of TRC8 may indeed contribute to the observed low ER cholesterol through reduced nSREBP2 and Hmgr mRNA levels. The mechanism for the increased level of TRC8 in the HCD-fed Ldlr−/−xLcat−/− mice is not known and is the subject of future investigation.
Our in vivo observation of a marked up-regulation of ACAT2 and our in vitro ACAT2 inhibition studies strongly suggest a mechanistic role of ACAT2 in sustaining subnormal levels of ER cholesterol and ER stress. The mechanism for the marked up-regulation of ACAT2 in these mice is not known. Several lines of experimental evidence suggest that cellular cholesterol activates ACAT2 expression at both the transcriptional and post-transcriptional levels, although the mechanism of activation remains unknown (36, 37). It is intriguing to note that, by examining the three genotypic groups on the chow diet and HCD, we observed an excellent correlation between the ACAT2 protein level and ER cholesterol for all groups except for the HCD-fed Ldlr−/−xLcat−/− mice. Such analysis prompted considerations of an additional mechanism beyond the cholesterol-mediated induction of ACAT2.
Time course analysis revealed that HCD feeding in the SKO mice induced ER stress by as early as 4 weeks of feeding without any significant effect on body weight. On the other hand, impaired glucose tolerance developed by 10 weeks of feeding, suggesting that ER cholesterol excess in the liver per se may be sufficient to be causative through persistent induction of ER stress and impairment of insulin signaling, the latter presumed to be through the JNK pathway (8, 11). This interpretation is consistent with previous findings that the addition of cholesterol to a high fat, high carbohydrate diet induces a synergistic effect in aggravating IR and inflammation in LDLR knock-out mice (38).
In the present study, the C57Bl/6 mice shared the phenotype of resistance to HCD-induced hepatic ER stress with the Ldlr−/−xLcat−/− mice but without any evidence of induction of changes in NPC1L1, INSIG1, or ACAT2 as seen in the latter. Based on our current findings, it is conceivable that accumulation of cellular and ER cholesterol beyond a certain threshold is necessary to induce hepatic ER stress as seen in the Ldlr−/−xLcat+/+ mice. The cellular and ER cholesterol in the WT mouse liver might be sufficiently low that excess dietary cholesterol can be adequately redistributed or removed through various transporters and efflux mechanisms without exceeding the putative threshold. In the LDL receptor-deficient mouse background, LCAT deficiency attained a low level of ER cholesterol through induction of additional mechanisms as reported here. The fact that the ER cholesterol in these mice was significantly below the levels seen in the WT mice suggests that a shift in the basal cholesterol homeostasis has occurred.
In this study, we performed the studies exclusively in female animals based on the previous observation that the metabolic phenotypes seen are gender-dependent and are most prominent in females. The mechanism of this gender effect is currently not known. However, a recent study by De Marinis et al. (39) identified a strong gender-dependent effect in the regulation of hepatic cholesterol through modulation of the INSIG1/SCAP/SREBP machinery, providing a plausible mechanism to account for, at least in part, the gender effect of the observed metabolic phenotypes in our models. Other tissues that may contribute to the observed gender dimorphism include brown adipose tissue (40).
In summary, we have reported a novel mouse model of cholesterol-induced hepatic ER stress, and we demonstrate the first evidence that LCAT deficiency is highly resistant to this pathology. Our studies revealed that ER cholesterol is superior to tissue cholesterol as a predictor of hepatic ER stress. This was supported by our primary hepatocyte studies. Our mechanistic studies suggest that LDLR-null mice are more susceptible to cholesterol accumulation due to basal elevations in cholesterol obtained from the intestinal and biliary systems and that LCAT deficiency, at least in the context of the LDLR-null background, is protective through increased esterification and decreased biosynthesis of FC. Taken together, our findings suggest that achievement and maintenance of low ER cholesterol, perhaps below a given threshold, may be protective against ER stress and its metabolic consequences. Future studies will focus on the mechanistic links between the cholesterol homeostatic system and the evasion of ER cholesterol accumulation seen in the Ldlr−/−xLcat−/− mice.
Acknowledgment
We thank Dr. Qiaozhu Su for critical review of the manuscript.
This work was supported in part by a Grant-in-aid from the Heart and Stroke Foundation of Ontario to D. S. N. (NA6331), K. A., and P. W. C., Canadian Institutes of Health Research Operating Grant MOP-97904, Natural Science and Engineering Research Council Grant RGPIN 356873-08, and a Canada Foundation for Innovation infrastructure grant (to C. L. C.).
- LCAT
- lecithin:cholesterol acyltransferase
- IR
- insulin resistance
- ER
- endoplasmic reticulum
- HCD
- high cholesterol diet
- LDLR
- low density lipoprotein receptor
- UPR
- unfolded protein response
- SREBP
- sterol response element-binding protein
- SCAP
- SREBP cleavage-activating protein
- nSREBP2
- N terminus of SREBP2
- HMGR
- HMG-CoA reductase
- MCD
- methyl-β-cyclodextrin
- HPCD
- 2-hydroxypropyl-β-cyclodextrin
- PPPA
- pyripyropene A
- TC
- total cholesterol
- FC
- free cholesterol
- TG
- triglyceride
- PL
- phospholipid
- ZA
- zaragozic acid
- ANOVA
- analysis of variance
- SKO
- single KO
- DKO
- double KO
- TRC8
- translocation in renal cancer from chromosome 8
- SRBI
- scavenger receptor class B, type I
- ACAT
- acyl-CoA:cholesterol O-acyltransferase
- INSIG
- insulin-induced gene.
REFERENCES
- 1. Rousset X., Vaisman B., Amar M., Sethi A. A., Remaley A. T. (2009) Lecithin:cholesterol acyltransferase—from biochemistry to role in cardiovascular disease. Curr. Opin. Endocrinol. Diabetes Obes. 16, 163–171 [DOI] [PMC free article] [PubMed] [Google Scholar]
- 2. Ng D. S., Xie C., Maguire G. F., Zhu X., Ugwu F., Lam E., Connelly P. W. (2004) Hypertriglyceridemia in lecithin-cholesterol acyltransferase-deficient mice is associated with hepatic overproduction of triglycerides, increased lipogenesis, and improved glucose tolerance. J. Biol. Chem. 279, 7636–7642 [DOI] [PubMed] [Google Scholar]
- 3. Lambert G., Sakai N., Vaisman B. L., Neufeld E. B., Marteyn B., Chan C. C., Paigen B., Lupia E., Thomas A., Striker L. J., Blanchette-Mackie J., Csako G., Brady J. N., Costello R., Striker G. E., Remaley A. T., Brewer H. B., Jr., Santamarina-Fojo S. (2001) Analysis of glomerulosclerosis and atherosclerosis in lecithin cholesterol acyltransferase-deficient mice. J. Biol. Chem. 276, 15090–15098 [DOI] [PubMed] [Google Scholar]
- 4. Ng D. S., Maguire G. F., Wylie J., Ravandi A., Xuan W., Ahmed Z., Eskandarian M., Kuksis A., Connelly P. W. (2002) Oxidative stress is markedly elevated in lecithin:cholesterol acyltransferase-deficient mice and is paradoxically reversed in the apolipoprotein E knockout background in association with a reduction in atherosclerosis. J. Biol. Chem. 277, 11715–11720 [DOI] [PubMed] [Google Scholar]
- 5. Song H., Zhu L., Picardo C. M., Maguire G., Leung V., Connelly P. W., Ng D. S. (2006) Coordinated alteration of hepatic gene expression in fatty acid and triglyceride synthesis in LCAT-null mice is associated with altered PUFA metabolism. Am. J. Physiol. Endocrinol. Metab. 290, E17–E25 [DOI] [PubMed] [Google Scholar]
- 6. Zhu X., Herzenberg A. M., Eskandarian M., Maguire G. F., Scholey J. W., Connelly P. W., Ng D. S. (2004) A novel in vivo lecithin-cholesterol acyltransferase (LCAT)-deficient mouse expressing predominantly LpX is associated with spontaneous glomerulopathy. Am. J. Pathol. 165, 1269–1278 [DOI] [PMC free article] [PubMed] [Google Scholar]
- 7. Frohlich J., McLeod R., Pritchard P. H., Fesmire J., McConathy W. (1988) Plasma lipoprotein abnormalities in heterozygotes for familial lecithin:cholesterol acyltransferase deficiency. Metabolism 37, 3–8 [DOI] [PubMed] [Google Scholar]
- 8. Li L., Hossain M. A., Sadat S., Hager L., Liu L., Tam L., Schroer S., Huogen L., Fantus I. G., Connelly P. W., Woo M., Ng D. S. (2011) Lecithin cholesterol acyltransferase null mice are protected from diet-induced obesity and insulin resistance in a gender-specific manner through multiple pathways. J. Biol. Chem. 286, 17809–17820 [DOI] [PMC free article] [PubMed] [Google Scholar]
- 9. Li L., Naples M., Song H., Yuan R., Ye F., Shafi S., Adeli K., Ng D. S. (2007) LCAT-null mice develop improved hepatic insulin sensitivity through altered regulation of transcription factors and suppressors of cytokine signaling. Am. J. Physiol. Endocrinol. Metab. 293, E587–E594 [DOI] [PubMed] [Google Scholar]
- 10. Engin F., Hotamisligil G. S. (2010) Restoring endoplasmic reticulum function by chemical chaperones: an emerging therapeutic approach for metabolic diseases. Diabetes Obes. Metab. 12, Suppl. 2, 108–115 [DOI] [PubMed] [Google Scholar]
- 11. Ozcan U., Cao Q., Yilmaz E., Lee A. H., Iwakoshi N. N. (2004) Endoplasmic reticulum stress links obesity, insulin action, and type 2 diabetes. Science 306, 457–461 [DOI] [PubMed] [Google Scholar]
- 12. Ozcan U., Yilmaz E., Ozcan L., Furuhashi M., Vaillancourt E., Smith R. O., Görgün C. Z., Hotamisligil G. S. (2006) Chemical chaperones reduce ER stress and restore glucose homeostasis in a mouse model of type 2 diabetes. Science 313, 1137–1140 [DOI] [PMC free article] [PubMed] [Google Scholar]
- 13. Tabas I. (2002) Consequences of cellular cholesterol accumulation: basic concepts and physiological implications. J. Clin. Investig. 110, 905–911 [DOI] [PMC free article] [PubMed] [Google Scholar]
- 14. Tabas I. (2010) The role of endoplasmic reticulum stress in the progression of atherosclerosis. Circ. Res. 107, 839–850 [DOI] [PMC free article] [PubMed] [Google Scholar]
- 15. Marí M., Caballero F., Colell A., Morales A., Caballeria J., Fernandez A., Enrich C., Fernandez-Checa J. C., García-Ruiz C. (2006) Mitochondrial free cholesterol loading sensitizes to TNF- and Fas-mediated steatohepatitis. Cell Metab. 4, 185–198 [DOI] [PubMed] [Google Scholar]
- 16. Radhakrishnan A., Goldstein J. L., McDonald J. G., Brown M. S. (2008) Switch-like control of SREBP-2 transport triggered by small changes in ER cholesterol: a delicate balance. Cell Metab. 8, 512–521 [DOI] [PMC free article] [PubMed] [Google Scholar]
- 17. Taghibiglou C., Rudy D., Van Iderstine S. C., Aiton A., Cavallo D., Cheung R., Adeli K. (2000) Intracellular mechanisms regulating apoB-containing lipoprotein assembly and secretion in primary hamster hepatocytes. J. Lipid Res. 41, 499–513 [PubMed] [Google Scholar]
- 18. Folch J., Lees M., Sloane Stanley G. H. (1957) A simple method for the isolation and purification of total lipides from animal tissues. J. Biol. Chem. 226, 497–509 [PubMed] [Google Scholar]
- 19. Klett E. L., Lee M. H., Adams D. B., Chavin K. D., Patel S. B. (2004) Localization of ABCG5 and ABCG8 proteins in human liver, gall bladder and intestine. BMC Gastroenterol. 4, 21. [DOI] [PMC free article] [PubMed] [Google Scholar]
- 20. Yamanashi Y., Takada T., Yoshikado T., Shoda J., Suzuki H. (2011) NPC2 regulates biliary cholesterol secretion via stimulation of ABCG5/G8-mediated cholesterol transport. Gastroenterology 140, 1664–1674 [DOI] [PubMed] [Google Scholar]
- 21. Yamanashi Y., Takada T., Shoda J., Suzuki H. (2012) Novel function of Niemann-Pick C1-like 1 as a negative regulator of Niemann-Pick C2 protein. Hepatology 55, 953–964 [DOI] [PubMed] [Google Scholar]
- 22. Lada A. T., Davis M., Kent C., Chapman J., Tomoda H., Omura S., Rudel L. L. (2004) Identification of ACAT1- and ACAT2-specific inhibitors using a novel, cell-based fluorescence assay: individual ACAT uniqueness. J. Lipid Res. 45, 378–386 [DOI] [PubMed] [Google Scholar]
- 23. Ohshiro T., Matsuda D., Sakai K., Degirolamo C., Yagyu H., Rudel L. L., Omura S., Ishibashi S., Tomoda H. (2011) Pyripyropene A, an acyl-coenzyme A:cholesterol acyltransferase 2-selective inhibitor, attenuates hypercholesterolemia and atherosclerosis in murine models of hyperlipidemia. Arterioscler. Thromb. Vasc. Biol. 31, 1108–1115 [DOI] [PubMed] [Google Scholar]
- 24. Schreyer S. A., Vick C., Lystig T. C., Mystkowski P., LeBoeuf R. C. (2002) LDL receptor but not apolipoprotein E deficiency increases diet-induced obesity and diabetes in mice. Am. J. Physiol. Endocrinol. Metab. 282, E207–E214 [DOI] [PubMed] [Google Scholar]
- 25. Brown J. M., Yu L. (2009) Opposing gatekeepers of apical sterol transport: Niemann-Pick C1-like 1 (NPC1L1) and ATP-binding cassette transporters G5 and G8 (ABCG5/ABCG8). Immunol. Endocr. Metab. Agents Med. Chem. 9, 18–29 [DOI] [PMC free article] [PubMed] [Google Scholar]
- 26. Pramfalk C., Jiang Z. Y., Parini P. (2011) Hepatic Niemann-Pick C1-like 1. Curr. Opin. Lipidol. 22, 225–230 [DOI] [PubMed] [Google Scholar]
- 27. Temel R. E., Tang W., Ma Y., Rudel L. L., Willingham M. C., Ioannou Y. A., Davies J. P., Nilsson L. M., Yu L. (2007) Hepatic Niemann-Pick C1-like 1 regulates biliary cholesterol concentration and is a target of ezetimibe. J. Clin. Investig. 117, 1968–1978 [DOI] [PMC free article] [PubMed] [Google Scholar]
- 28. Calpe-Berdiel L., Escolà-Gil J. C., Ribas V., Navarro-Sastre A., Garcés-Garcés J., Blanco-Vaca F. (2005) Changes in intestinal and liver global gene expression in response to a phytosterol-enriched diet. Atherosclerosis 181, 75–85 [DOI] [PubMed] [Google Scholar]
- 29. Van Erpecum K. J. (2011) Pathogenesis of cholesterol and pigment gallstones: an update. Clin. Res. Hepatol. Gastroenterol. 35, 281–287 [DOI] [PubMed] [Google Scholar]
- 30. Pramfalk C., Jiang Z. Y., Cai Q., Hu H., Zhang S. D., Han T. Q., Eriksson M., Parini P. (2010) HNF1α and SREBP2 are important regulators of NPC1L1 in human liver. J. Lipid Res. 51, 1354–1362 [DOI] [PMC free article] [PubMed] [Google Scholar]
- 31. Park S. W., Zhou Y., Lee J., Lee J., Ozcan U. (2010) Sarco(endo)plasmic reticulum Ca2+-ATPase 2b is a major regulator of endoplasmic reticulum stress and glucose homeostasis in obesity. Proc. Natl. Acad. Sci. U.S.A. 107, 19320–19325 [DOI] [PMC free article] [PubMed] [Google Scholar]
- 32. Oude Elferink R. P., Beuers U. (2011) Targeting the ABCB4 gene to control cholesterol homeostasis. Expert Opin. Ther. Targets 15, 1173–1182 [DOI] [PubMed] [Google Scholar]
- 33. Dikkers A., Tietge U. J. (2010) Biliary cholesterol secretion: more than a simple ABC. World J. Gastroenterol. 16, 5936–5945 [DOI] [PMC free article] [PubMed] [Google Scholar]
- 34. Irisawa M., Inoue J., Ozawa N., Mori K., Sato R. (2009) The sterol-sensing endoplasmic reticulum (ER) membrane protein TRC8 hampers ER to Golgi transport of sterol regulatory element-binding protein-2 (SREBP-2)/SREBP cleavage-activated protein and reduces SREBP-2 cleavage. J. Biol. Chem. 284, 28995–29004 [DOI] [PMC free article] [PubMed] [Google Scholar]
- 35. Lee J. P., Brauweiler A., Rudolph M., Hooper J. E., Drabkin H. A., Gemmill R. M. (2010) The TRC8 ubiquitin ligase is sterol regulated and interacts with lipid and protein biosynthetic pathways. Mol. Cancer Res. 8, 93–106 [DOI] [PMC free article] [PubMed] [Google Scholar]
- 36. Rudel L. L., Davis M., Sawyer J., Shah R., Wallace J. (2002) Primates highly responsive to dietary cholesterol up-regulate hepatic ACAT2, and less responsive primates do not. J. Biol. Chem. 277, 31401–31406 [DOI] [PubMed] [Google Scholar]
- 37. Das A., Davis M. A., Tomoda H., Omura S., Rudel L. L. (2008) Identification of the interaction site within acyl-CoA:cholesterol acyltransferase 2 for the isoform-specific inhibitor pyripyropene A. J. Biol. Chem. 283, 10453–10460 [DOI] [PMC free article] [PubMed] [Google Scholar]
- 38. Subramanian S., Han C. Y., Chiba T., McMillen T. S., Wang S. A., Haw A., 3rd, Kirk E. A., O'Brien K. D., Chait A. (2008) Dietary cholesterol worsens adipose tissue macrophage accumulation and atherosclerosis in obese LDL receptor-deficient mice. Arterioscler. Thromb. Vasc. Biol. 28, 685–691 [DOI] [PMC free article] [PubMed] [Google Scholar]
- 39. De Marinis E., Martini C., Trentalance A., Pallottini V. (2008) Sex differences in hepatic regulation of cholesterol homeostasis. J. Endocrinol. 198, 635–643 [DOI] [PubMed] [Google Scholar]
- 40. Choi D. K., Oh T. S., Choi J. W., Mukherjee R., Wang X., Liu H., Yun J. W. (2011) Gender difference in proteome of brown adipose tissues between male and female rats exposed to a high fat diet. Cell. Physiol. Biochem. 28, 933–948 [DOI] [PubMed] [Google Scholar]