

Abstract
Both sequence variation and copy-number variation (CNV) of the genes encoding receptors for immunoglobulin G (Fcγ receptors) have been genetically and functionally associated with a number of autoimmune diseases. However, the molecular nature and evolutionary context of this variation is unknown. Here, we describe the structure of the CNV, estimate its mutation rate and diversity, and place it in the context of the known functional alloantigen variation of these genes. Deletion of Fcγ receptor IIIB, associated with systemic lupus erythematosus, is a result of independent nonallelic homologous recombination events with a frequency of approximately 0.1%. We also show that pathogen diversity, in particular helminth diversity, has played a critical role in shaping the functional variation at these genes both between mammalian species and between human populations. Positively selected amino acids are involved in the interaction with IgG and include some amino acids that are known polymorphic alloantigens in humans. This supports a genetic contribution to the hygiene hypothesis, which states that past evolution in the context of helminth diversity has left humans with an array of susceptibility alleles for autoimmune disease in the context of a helminth-free environment. This approach shows the link between pathogens and autoimmune disease at the genetic level and provides a strategy for interrogating the genetic variation underlying autoimmune-disease risk and infectious-disease susceptibility.
Introduction
The human immune system is subject to natural selection shaped by pathogenic and commensal microorganisms.1 The interaction between antibody-antigen complexes and cells that mediate the immune response is a critical stage that determines both the nature and magnitude of that response. Fcγ receptors are cellular receptors for the Fc domain of immunoglobulin G. Upon binding to antibodies, Fcγ receptors typically transmit an intracellular signal through either phosphorylation of immunoreceptor tyrosine-based activation motifs (ITAMs) or inhibitory motifs (ITIMs).2 In humans, two tandem paralogous repeats contain the genes FCGR3A (MIM 146740) and FCGR3B (MIM 610665), encoding two variants (Fcγ receptor IIIA and Fcγ receptor IIIB, respectively) of the low-affinity activating receptor Fcγ receptor III (Figure 1A).3 The proteins that these two paralogous genes encode differ both in their attachment to the cell membrane and in their expression pattern. Fcγ receptor IIIA has a transmembrane region and is expressed on natural killer (NK) cells, monocytes, dendritic cells, and macrophages. Fcγ receptor IIIB is truncated by an arginine-to-stop mutation, is attached to the cell membrane by a glycophosphoinositol anchor, and is expressed on neutrophils, mast cells, and eosinophils.4
Figure 1.
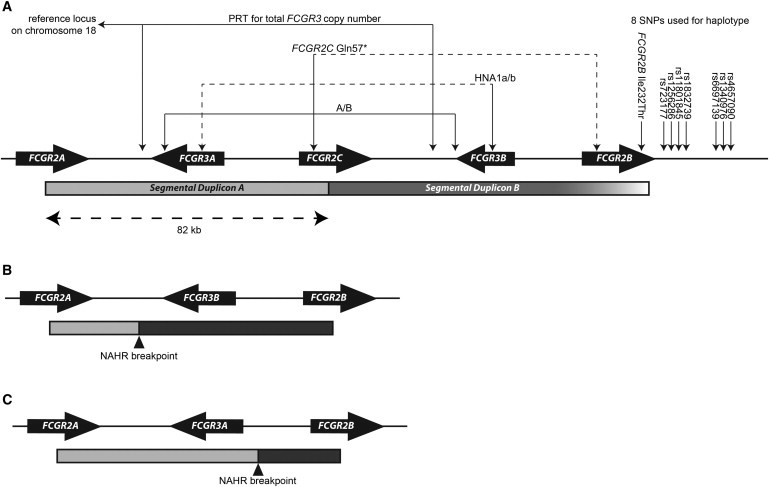
Schematic Diagram of the Low-Affinity-Region Fcγ Receptor in Humans
(A) The cluster of low-affinity-region Fcγ-receptor genes in chromosomal region 1q23.3. The location of the genes, the position of the segmental duplications, the locations of SNPs analyzed, and the copy-number assays used are shown. The gradient shading on segmental duplication B reflects the gradual decrease in sequence identity rather than a clear transition from duplicated to single-copy sequence. The dashed lines for the HNA1a/b and FCGR2C p.Gln57∗ assays indicate that both paralogs are amplified by these primers, but the relevant variation is only on one paralog.
(B) A model of how NAHR could generate FCGR3B-deletion chromosomes by unequal crossing over between the two segmental duplications. In this case, the NAHR breakpoint is proximal to FCGR3, generating a deletion of FCGR3A.
(C) A model of how NAHR could generate FCGR3A-deletion chromosomes by unequal crossing over between the two segmental duplications. In this case, the NAHR breakpoint is distal to FCGR3, generating a deletion of FCGR3B. Note that whether FCGR3A or FCGR3B is deleted is only due to the position of the NAHR breakpoint.
Three other genes encoding Fcγ receptors are in this region. FCGR2A (MIM 146790) and FCGR2B (MIM 604590) code for activating (Fcγ receptor IIA) and inhibitory (Fcγ receptor IIB) receptors, respectively. They flank the two paralogous repeats on the proximal and distal sides, respectively, but do not show CNV.5 A third Fcγ-receptor gene, FCGR2C (MIM 612169), is a fusion gene formed from the 5′ end of FCGR2B and the 3′ end of FCGR2A6 and spans the breakpoint between the two paralogous repeats. The activating receptor that it encodes is expressed on NK cells and is involved in the generation of antibody-dependent cellular cytotoxicity (ADCC).7 However, this protein is expressed only in a subset of individuals: A common polymorphism (FCGR2C c.169C>T [p.Gln57∗]) changes a glutamine to a stop codon and causes premature truncation of the protein and abolishes expression of this receptor on the cell surface.8
Both sequence and CNV of these genes have been shown to affect function and have been associated with autoimmune disease.9,10 In FCGR3B, two allotypes termed human neutrophil antigen 1a (HNA1a) and HNA1b differ at four amino acid positions and in their ability to phagocytose opsonised particles.11 Both HNA1 types and FCGR3B CNV are independently associated with systemic lupus erythamatosus (SLE [MIM 152700]),12,13 and copy number itself is associated with rheumatoid arthritis.14–16 For FCGR2A, coding polymorphism rs1801274 has been associated with Kawasaki disease (MIM 611775) in a genome-wide association analysis.17 For FCGR2B, a coding polymorphism (rs1050501) affects the ability of its receptor to associate with lipid rafts, impairs its inhibitory function, and is a susceptibility allele for SLE and is protective against malaria.18–20 For FCGR2C, the active allele is associated with the hematological autoimmune disease idiopathic thrombocytopenic pupura (MIM 188030) and with rheumatoid arthritis severity.21
We decided to address some of the outstanding questions concerning this complex disease-associated region. The nature of the CNV was not clear; limited sizing of a few deletion and duplication alleles supported a model of loss or gain of whole repeat units 82 kb in length by nonallelic homologous recombination (NAHR).22 However, some reports suggested CNV of different lengths generated by alternative mechanisms.5,19 Given the evidence for this region containing several susceptibility alleles for several autoimmune diseases, we also asked whether there is any evidence for the hygiene hypothesis,23 which states that past pathogen-driven selection has left a legacy of susceptibility alleles for autoimmune diseases in the context of a pathogen-poor modern environment. In this paper, we determine the nature and rate of CNV mutation, investigate the global variation of disease-associated variation at this locus, and explore evolutionary hypotheses explaining the variation at this locus.
Material and Methods
Samples
DNA samples were purchased from Coriell Cell Repositories (HapMap) or from CEPH-HGDP (CEPH-obtained samples from the Human Genome Diversity Panel24,25). Genotype data from the HGDP sample series for seven SNPs (rs723177, rs1256286, rs11801845, rs1832739, rs6697139, rs1340976, and rs4657090) were previously published and were downloaded via the portal SPSmart.26,27 Throughout this paper, the HapMap population identifiers CEU (Utah residents with ancestry from northern and western Europe from the CEPH collection) and YRI (Yoruba from Ibadan, Nigeria) are used.
Copy-Number Typing
We typed copy number of FCGR3A and FCGR3B and genotyped the HNA1a and HNA1b alleles by using a combination of the paralog ratio test (PRT) and restriction-enzyme-digest variant ratio (REDVR) assay essentially as described previously.22,28 In addition to the published assays, variant-ratio information from the FCGR2C p.Gln57∗ assay (see below) was also incorporated into the maximum-likelihood copy-number calling approach, improving the power of accurate copy-number calls. It is important to note that these assays are not paralog specific because the primers are designed to amplify both paralogs. The assays thus have the advantage of being insensitive to the position of the deletion or duplication breakpoints generated by NAHR, and they therefore determine the copy number regardless of the nature of the CNV generated by NAHR.
Sequence Polymorphism Assays
FCGR2C has a SNP (rs10917661; c.169C>T) that changes a glutamine to a stop codon at amino acid position 57 (p.Gln57∗), which is in the first extracellular domain, and this SNP was assayed by PCR amplification with 0.5 μM of each primer pair (5′ -CAACTGCCTTCAGTTGCAGA-3′ and 5′ NED-GTTGTTGGCCTTGAACCTGT-3′). Products were amplified from 10 ng genomic DNA with 26 cycles each of the following: 95°C for 30 s, 60°C for 30 s, and 70°C for 30 s; these cycles were followed by a single chase phase of 60°C for 1 min and 70°C for 20 min so that the levels of single-stranded DNA products would be reduced. 5 μl of PCR product was then digested with 2.5 units of BfaI restriction enzyme (New England Biolabs) in 20 mM Tris-acetate (pH 7.9 at 25°C), 50 mM potassium acetate, 100 mM NaCl, 10 mM magnesium acetate, and 1 mM dithiothreitol in a final volume of 10 μl for 3 hr at 37°C. 1 μl of product was then analyzed by capillary electrophoresis with the Applied Biosystems (ABI) 3130xl genetic analyzer. This assay, together with the FCGR3B HNA1 assay previously published, is not paralog specific, and it is assumed that the variation occurs only on the A paralog (for this assay) and the B paralog (for the FCGR3B HNA1 assay). We have no examples of REDVR data that call this assumption into doubt. Also, there is no published genetic or functional evidence that the stop-codon allele of FCGR2C is transferred by gene conversion to FCGR2B (which would generate a null FCGR2B allele) or that the HNA1 allele is transferred to FCGR3A, which is also very likely to have functional consequences. However, we cannot rule out rare instances of this occurring by gene conversion, which would not be detected by our methods.
For both the HNA1a/HNA1b locus and the FCGR2C p.Gln57∗ locus, population allele frequencies cannot be deduced in a straightforward manner given that they are not always diploid loci. We derived a mean value for HNA1a and FCGR2C Gln57 for each population, as previously published22, from individual-level data reflecting the relative proportions of each variant in that individual. For example, a HNA1a-HNA1b genotype has a value of 0.5, and a HNA1a-HNA1a-HNA1b genotype has a value of 0.66.
The FCGR2B SNP (rs1050501) was assayed by PCR amplification with 0.5 μM of each primer pair (5′ HEX-GAAGAGCTTCGGGTGACAAG-3′ and 5′-CAACAATGGCCGCTACTGCA-3′) designed to amplify both duplications. Products were amplified from 10 ng genomic DNA with 30 cycles each of the following: 95°C for 30 s, 69°C for 30 s, and 70°C for 30 s; these cycles were followed by a single chase phase of 69°C for 1 min and 70°C for 20 min. 2 μl of PCR product was subsequently digested with 5 units of PstI restriction enzyme (New England Biolabs) in 50 mM Tris-Cl (pH 7.9 at 25°C), 100 mM NaCl, 10 mM MgCl2, and 1 mM dithiothreitol in a final volume of 10 μl for 3hr at 37°C. 1 μl was then analyzed by capillary electrophoresis with the ABI 3130xl genetic analyzer; product peaks were quantified and genotypes were determined on the assumption that only FCGR2B showed variation. To confirm this assumption, we also genotyped this SNP by using a previously published paralog-specific sequencing-based assay.20
Phasing of Haplotypes
HapMap SNP data for eight SNPs were combined with the CNV data previously published,22 and the HGDP SNP data were generated and described here. HapMap trios for which no data existed for these SNPs as well as three trios for which there was evidence of non-Mendelian inheritance of the CNV region as a result of either de novo mutation events or CNV typing error were removed. This left 11 CEU trios and 14 YRI trios, which were combined with seven trios (one Columbian, one Karitiana, two Melanesian, one Pima, and two Surui) from the HGDP sample set and phased with PHASE 2.1.29
The parental haplotypes, phased from trio data, were then combined with the unrelated individual genotypes from the HGDP panel and were annotated as known haplotype phases with the -k option. This “seeding” of the unrelated genotype data with known haplotypes prior to phasing increases the power of PHASE to predict haplotypes in unrelated individuals (Figure S1, available online). For BATWING analysis, this phasing was repeated only for YRI trio samples.
Breakpoint Mapping of Deletion Alleles
Paralogous sequence variants (PSVs) were identified as differences between the two copies of the FCGR3 duplication mapped in human genome assembly hg18. Although some of these putative PSVs will represent SNPs on one paralog, the percent divergence (1.5%) between the two paralogs supports a duplication event prior to human speciation, so the vast majority of these differences are likely to be true PSVs, i.e., fixed between the two paralogs. Individuals homozygous for deletions (i.e., those with only two copies of FCGR3A or FCGR3B) were identified from the HGDP. Sixteen overlapping PCR products spanning the 82 kb duplication were generated with primer pairs detailed in Table S1. Primers were designed to coamplify both A and B paralogous sequences. Long PCRs were done in 25 μl reactions on a Veriti thermal cycler (ABI) with the buffer described previously30 and were supplemented with 0.2 μM of each primer, 0.025U Taq DNA polymerase (Kapa Biosystems), and 0.0033U Pfu DNA polymerase (Stratagene). Products were amplified from 10 ng genomic DNA with an initial denaturation of 94°C for 1 min, a first stage consisting of 23 cycles each of 94°C for 15 s and 68°C for 10 min, and a second stage consisting of 12 cycles each of 94°C for 15 s and 68°C for 10 min (plus 15 s/cycle); these were followed by a single chase phase of 72°C for 10 min. Amplicons were resolved by agarose gel electrophoresis, were gel extracted (QIAGEN), and were Sanger end sequenced for determining which amplicon contained a junction (identified by a switch in PSV identity). Internal sequencing primers were then used for mapping the exact breakpoint. In some cases, there was complexity caused by putative historic gene-conversion events that made determining the exact junction boundary impossible, and this is highlighted in Figure 2.
Figure 2.
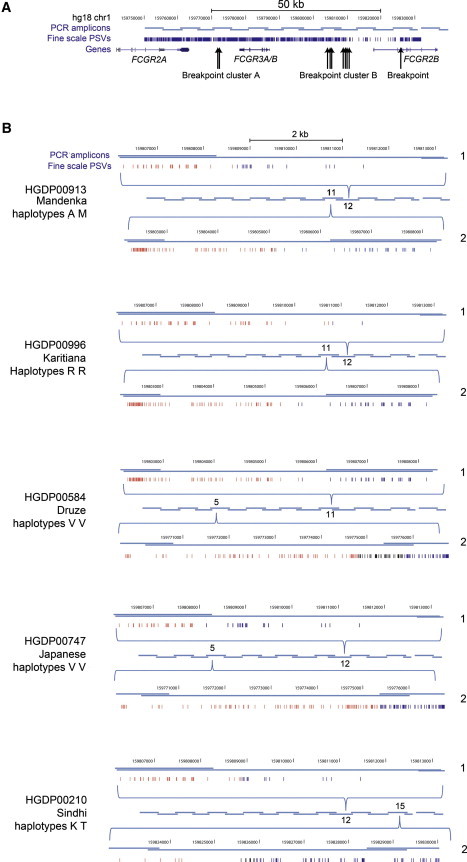
Analysis of Deletion Breakpoints in Different Deletion Chromosomes
(A) The FCGR3 duplication in humans. The positions of the overlapping PCR amplicons used for spanning and amplifying both duplications are shown in pale blue and are relative to the hg18 chromosome 1 coordinates. Also shown are the density of paralogous sequence variants (PSVs) between FCGR3A and FCGR3B duplications in dark blue, RefSeq genes, and the positions of the deletion breakpoints found.
(B) Detailed analysis of deletion breakpoints in homozygous deletion-positive individuals. For each individual, both alleles (labeled as 1 and 2 on the right of each diagram) are shown. The overlapping PCR amplicons spanning the duplication are shown in the center, and the amplicon number indicates the amplicon in which that particular breakpoint was found. Each amplicon containing the breakpoint is expanded (shown by the blue brackets above and below the PCR amplicons) and shows the position of the PSVs as well as the hg18 chromosome 1 coordinates. A change in color from red (A-like PSVs) to blue (B-like PSVs) indicates the breakpoint. If the breakpoint position is not clear because of gene-conversion events or possible recurrent NAHR events, the PSVs in the putative breakpoint region are colored black. The identification number of the individual is shown together with the population of origin and the letter code representing the eight-SNP haplotypes (Table S2).
We identified one individual (HGDP00958, Yakut) who had one copy of FCGR3A and one copy of FCGR3B and who showed no evidence of any deletion breakpoint, as identified by a switch from A-like PSVs to B-like PSVs. We interpret this individual as having a large deletion of both FCGR3A and FCGR3B on one of the two homologous chromosomes. This deletion allele is likely to be extremely rare given that it will result in a two-copy genotype when paired with a two-copy allele and in a one-copy genotype when paired with a one-copy allele. We have not seen any one-copy individuals in over 1,500 samples analyzed, and the fact that we have seen only one such two-copy individual is consistent with a estimation of the frequency of the null allele at around 0.1%, which differs from the estimated global frequency of NAHR-generated deletion alleles of around 6.5% (calculated with ConVem31 assuming Hardy-Weinberg equilibrium [Table S2]). We are currently investigating the exact nature of this rare allele.
Estimation of Mutation Rate
The mutation rate of the copy-number variable region was estimated from YRI population data via BATWING. The YRI population was chosen because it has not experienced the out-of-Africa range-expansion demographic event. FCGR3A and FCGR3B copy-number estimates were from a previously published dataset in which the copy number of FCGR3A and FCGR3B were considered together because the distinction between FCGR3A CNV and FCGR3B CNV depends only on the position of the breakpoint of NAHR. Eight-SNP haplotypes were calculated from the trio data, and all haplotypes had a posterior probability of 1. One SNP (rs1050501) was found to break the four-gamete rule,32 indicating either historical recombination or gene conversion, and was removed from the dataset.
BATWING uses a Bayesian Markov-chain Monte Carlo coalescent approach to generate approximate posterior distributions of population parameters, such as mutation rate, and incorporates a model of exponential population expansion from a constant ancestral population size; this model was used here.33 BATWING allows two classes of locus (with different mutation rates) that usually reflect SNPs and short tandem repeats (STRs). The data used here, in which haplotypes consist of a highly variable CNV and less variable SNPs, are analogous to an SNP-STR model. This is especially true given that the CNV mutation is due to NAHR, and the locus is therefore likely to follow a stepwise mutation model, which was developed for describing mutational processes at STRs.
The prior probability distribution for effective population size (Ne) was a normal distribution with a mean of 7,200 and a standard deviation of 1,600. This prior distribution, based on an estimate of the effective population size of the YRI population from linkage-disequilibrium data, is likely to represent an estimate of Ne from more recent population history and a more appropriate estimate of the current Ne used by BATWING.34 The population expansion parameter α was given a prior probability distribution after a gamma distribution (scale parameter = 2, shape parameter = 400), and the prior distribution of the mutation rate was a uniform distribution between 1 × 10⁻⁶ and 1 × 10⁻³.
Analysis of Pathogen Richness
On the basis of the Gideon database, pathogen absence or presence matrices were constructed for the 21 countries where the HGDP populations are located as described previously.35,36 In brief, pathogen diversity was calculated from these data for each population, and only species or genera that are transmitted in the 21 countries were taken into account (cases of transmission caused by tourism and immigration were not taken into account); also, species that had recently been eradicated as a result of vaccination campaigns, for example, were recorded as present in the matrix. Malaria prevalence was obtained from either the Gideon or World Health Organization (WHO) databases as previously described.37 In order to account for the demographic history of human populations, we calculated correlations by using partial Mantel tests. Specifically, matrices were computed as pairwise Euclidean distances in variant frequency, distances from east Africa, and pathogen diversity or malaria prevalence (from either the WHO or the Gideon database). Distances from Africa were derived from a previous work38 and refer to a model of human migration that progressed from east Africa along landmasses while avoiding mountain regions with altitudes over 2,000 m. We calculated the statistical significance of correlation tests by performing 10,000 permutations of pathogen diversity or malaria prevalence within continental regions; these regions were defined as previously suggested26 (i.e., Africa, Europe, America, central South Asia, East Asia, and Oceania), and Middle Eastern populations were grouped with Europeans. Partial Mantel correlations were performed with the VEGAN R package.
Genus data on helminth richness were taken from a previously published paper.39 In brief, the total number of helminth species recovered from all individual hosts within a genus (often reflecting several different species) was collected. This value was corrected for sample size. It should be noted that only gastrointestinal helminths were assayed in this analysis.
Phylogenetic Analysis
Putative orthologous DNA sequences of FCGR3 were identified with the Gene Orthology prediction method implemented in the Ensembl genome browser. In addition, mRNA sequences were obtained from the National Center for Biotechnology Information (NCBI) nucleotide database. Sequences were aligned with ClustalW, and a tree was generated by maximum likelihood with the DNA Maximum Likelihood (DNAML) program, part of the PHYLIP 3.6 suite of programs.40 After the removal of initiation codons, stop codons, and deletions within the alignment, codon sequences were analyzed with Phylogenetic Analysis by Maximum Likelihood (PAML) v.4.4b (assuming no molecular clock), an F84 base substitution model, and a guide tree based on the accepted phylogeny of the species concerned.41
By fitting the data to two likelihood models, M1a and M2a, in PAML, we have a test of whether positive selection, as defined by ω > 1, has acted on a gene. M1a is the model assuming a null hypothesis that all codons fall into two classes: (1) those that evolve neutrally (ω = 1) or (2) those that evolve with purifying selection (0 < ω <1). M2a allows codons to fall into another class: those showing positive selection (ω > 1). Therefore, by comparing the log likelihood of the data-fitting model M1a with the log likelihood of the data-fitting model M2a, we obtain a significance level testing the hypothesis that certain amino acids are under positive selection. We derive the significance value by calculating 2×(log likelihood M1a − log likelihood M2a) and by comparing that figure with a χ2 distribution with 2 degrees of freedom. Codons under positive selection were mapped to the crystal structure of FCGR3B in complex with an Fc fragment of IgG1 (RCSB PDB ID: 1T83) with PyMOL 1.2.
To test the influence of high helminth diversity, we labeled the branches on the guide tree as having high helminth diversity if they led to a genus that had a helminth-diversity value greater than the median. A branch-site test model A was run, which fits model M2a twice by once allowing ω to vary along the high-helminth branches and by once fixing ω = 1 along these branches, for the third class of codon site. We derive the significance value by doubling the log-likelihood difference between the two models and by comparing that figure with a χ2 distribution with 1 degree of freedom.
Results
Global Analysis of Variation Associated with Inflammatory Disease
We typed FCGR3A and FCGR3B copy number, rs76714703 (encoding HNA1a/b), rs10917661 (FCGR2C c.169C>T [p.Gln57∗]), and rs1050501 (FCGR2B c.695T>C [p.Ile232Thr]) on 946 unrelated samples from 51 populations and seven continental groups from the HGDP (Table 1), and we combined these with rs1801274 (FCGR2A c.497A>G [p.His131Arg]) genotypes, previously genotyped on this sample set. We observed no notable population differentiation, as measured by FST, nor any large differences in copy-number distribution (Table 1 and Table S3). One exception was the high frequency of FCGR3B three-copy individuals observed in South America. It is unclear whether this is a consequence of recent natural selection, genetic drift, or small sample size, and further work on South American populations is ongoing. For the CNV, absence of population structure could be due to a high CNV mutation rate effectively erasing the signal of ancient demographic changes, such as the out-of-Africa range expansion, from CNV diversity. To test this idea, we used a set of eight SNPs that flanked the CNV to investigate the recent evolutionary history of this locus (Figure 1A). We reasoned that if this CNV does show a high mutation rate, we would expect to see recurrent deletions and duplications of both FCGR3A and FCGR3B on different eight-SNP haplotypes. We phased FCGR3A and FCGR3B copy number together with the eight-SNP haplotypes to obtain likely haplotype pairs for each HGDP individual. The frequencies of the six most globally common eight-SNP haplotypes in the seven different continental groups are consistent with the broad neutral pattern of human genetic diversity; this pattern, a consequence of the out-of-Africa range expansion 60,000 years ago, is that high diversity in Africa reduces as the distance from Africa increases (Table 1 and Table S4).
Table 1.
Geographical Distribution of FCGR Variation
| Africa | Middle East | Europe | South Asia | East Asia | Oceania | South America | FST | |
|---|---|---|---|---|---|---|---|---|
| Number of individualsa | 103 | 163 | 158 | 201 | 229 | 28 | 64 | − |
| Allele or haplotype | ||||||||
| FCGR2A His131 | 0.61 | 0.47 | 0.52 | 0.62 | 0.71 | 0.57 | 0.28 | 0.048 |
| FCGR3B HNA1a | 0.37 | 0.35 | 0.40 | 0.32 | 0.64 | 0.72 | 0.80 | 0.074 |
| FCGR2C Gln57 | 0.17 | 0.23 | 0.18 | 0.18 | 0.05 | 0.09 | 0.24 | 0.011 |
| FCGR2B Thr232 | 0.28 | 0.13 | 0.15 | 0.15 | 0.22 | 0.18 | 0.02 | 0.012 |
| FCGR3A copy number | 2.00 | 2.08 | 1.97 | 1.99 | 1.91 | 1.96 | 2.05 | − |
| FCGR3B copy number | 2.29 | 2.13 | 2.14 | 2.17 | 2.21 | 2.00 | 2.47 | − |
| A | 0.26 | 0.13 | 0.14 | 0.14 | 0.21 | 0.18 | 0.00 | − |
| K | 0.16 | 0.13 | 0.10 | 0.08 | 0.01 | 0.07 | 0.01 | − |
| M | 0.16 | 0.06 | 0.04 | 0.08 | 0.02 | 0.00 | 0.01 | − |
| R | 0.07 | 0.13 | 0.22 | 0.24 | 0.49 | 0.59 | 0.76 | − |
| T | 0.02 | 0.24 | 0.22 | 0.18 | 0.01 | 0.13 | 0.13 | − |
| V | 0.20 | 0.25 | 0.25 | 0.22 | 0.24 | 0.02 | 0.07 | − |
| Other haplotypes | 0.13 | 0.06 | 0.03 | 0.06 | 0.02 | 0.01 | 0.02 | − |
Number of individuals tested for all variation except for FCGR2A His131.
Duplication and deletion of both FCGR3A and FCGR3B have occurred on all six common eight-SNP haplotypes (Table 2). It should be noted that, although the eight-SNP haplotypes were phased with high posterior probability, in some cases, copy number could not be reliably assigned to a particular haplotype in a given haplotype pair (Figure S1). However, the phasing is likely to be conservative, favoring the identification of eight-SNP CNV haplotypes previously observed rather than generating new combinations of haplotype and copy number. This will bias the data against observing de novo CNV mutation events—i.e., new combinations of eight-SNP haplotypes and copy number. A similar analysis of the single-nucleotide variation within the CNV, namely HNA1a/b and FCGR2C c.169C>T (p.Gln57∗), showed that for both polymorphisms, both alleles were observed on all six common eight-SNP haplotypes (Table 2) as a direct consequence of recombination, both allelic and nonallelic, within the CNV.
Table 2.
Haplotype Distribution of FCGR Variation Relevant to Disease
| SNP Haplotype |
FCGR3A Copy Number |
FCGR3B Copy Number |
HNA1 |
FCGR2C |
||||||
|---|---|---|---|---|---|---|---|---|---|---|
| 0 | 1 | 2+ | 0 | 1 | 2+ | a | b | ∗ | Gln | |
| A | 20 | 277 | 11 | 17 | 257 | 24 | 29 | 187 | 152 | 35 |
| K | 7 | 128 | 5 | 1 | 143 | 6 | 25 | 95 | 58 | 48 |
| M | 1 | 90 | 5 | 5 | 87 | 11 | 44 | 33 | 62 | 7 |
| R | 21 | 529 | 24 | 5 | 439 | 115 | 345 | 38 | 299 | 35 |
| T | 4 | 253 | 2 | 13 | 210 | 36 | 79 | 106 | 158 | 14 |
| V | 37 | 353 | 25 | 7 | 365 | 43 | 98 | 198 | 255 | 6 |
Recurrent CNV Mediated by Nonallelic Homologous Recombination
We reasoned that if the CNV is recurrent and is mediated by nonallelic homologous recombination between the segmental duplications carrying FCGR3A and FCGR3B, then we would not expect the deletion alleles to be the result of a single past NAHR event, and we would therefore expect them to not be identical by descent. Instead, we would expect the deletion alleles to be the result of several past NAHR events and to therefore show different NAHR breakpoints.
To test this hypothesis, we mapped the deletion breakpoints in five individuals homozygous for deletions—i.e., with only two copies of FCGR3A or FCGR3B. We used a PCR strategy to generate overlapping amplicons across the whole 82 kb repeat unit by using primers predicted to amplify both A and B repeats (Figure 2A). Sanger sequencing of the ends of these amplicons allowed us to determine whether each of the two deletion chromosomes was either the A repeat or the B repeat and at a given site by examining the PSVs that distinguish A from B. This allowed us to identify the amplicons containing the breakpoints between A and B, and we then completely sequenced the amplicons to identify the breakpoint.
Figure 2B shows the ten breakpoints identified in five individuals. Of these breakpoints, two are proximal to FCGR3 and generate FCGR3A deletions (Figure 1B), and eight are distal to FCGR3 and generate FCGR3B deletions (Figure 1C). Fine mapping of the breakpoints shows that they are all independent events, supported by the observation that most deletion events have occurred on different eight-SNP haplotypes. This suggests that most FCGR3A and FCGR3B deletions, at least when sampled from different populations, represent distinct mutation events.
These independent breakpoints appear to cluster in two distinct regions generating either FCGR3A (breakpoint A) or FCGR3B (breakpoint B) deletions. These are likely to represent NAHR hotspots similar to those observed at other loci,42 although HGDP00210 allele 2 shows a breakpoint outside these clusters. Analysis of more deletion alleles will help resolve how many deletion events occur within these clusters.
Estimation of CNV Mutation Rate from Population Data
We decided to use a coalescent approach to provide an estimate of the mutation rate at the FCGR3 CNV. Such an approach has limitations; in particular, it assumes no selection and a randomly mating population with no demographic substructure. Both assumptions are certainly untrue and will affect the coalescent process. However, the low FST values and lack of linkage disequilibrium between the CNV and the eight-SNP haplotype suggest that there has not been a recent selective sweep that would otherwise distort inferences made from the coalescent.
We simulated the coalescence process by using 52 haplotypes phased from YRI trio data (all had a phasing posterior probability of 1). An exponential population-expansion model was chosen, and prior estimates of the effective population size from linkage-disequilibrium data were from the YRI population. The expansion parameter is given a broad prior, similar to other studies, and covers a large number of possible expansion rates. Posterior estimates of population parameters with 95% confidence intervals are shown in Table 3. The CNV mutation rate is estimated at between 0.03% and 0.14% per generation.
Table 3.
Posterior Distributions of Coalescent Estimates of CNV Mutation Rate
| Parameter | Lower 95% CI | Mean | Upper 95% CI |
|---|---|---|---|
| Mutation rate μ (per generation) | 2.84 × 10⁻⁴ | 1.008 × 10⁻³ | 1.384 × 10⁻³ |
| Effective population size N | 4,138.18 | 6,980.128 | 9,985.66 |
| Time to MRCA of eight-SNP haplotype (years)a | 7,728 | 24,736 | 115,094 |
The following abbreviations are used: CI, confidence interval; and MRCA, most recent common ancestor.
Assuming N = 6,980 and generation time = 25 years.
Association between Inflammatory-Disease Variation and Pathogen Richness
Given the functional relevance of the sequence variation typed in this study, we reasoned that it was possible that infectious-disease burden was involved in shaping the geographic distribution of that variation. To test association with pathogen diversity, we performed a correlation analysis of allele frequency against indices of pathogen diversity, specifically viral, bacterial, protozoan, and helminth diversity.
The CNV of FCGR3A and FCGR3B showed no association with pathogen diversity. This is probably due to the lack of power given the limited variation in average copy number seen between populations (Table 1), and this limited variation is itself probably a direct consequence of the high mutation rate of this locus.
However, two of the nucleotide polymorphisms tested showed association with one or more of these indices when corrected for multiple testing. The HNA1a allele is associated with virus diversity, and the active FCGR2C Gln57 allele is associated with bacterial diversity (Table 4). Both of these alleles are also associated with helminth diversity, and the FCGR2A His131 allele shows a nominal association. The three polymorphisms should be regarded as independent evidence of association with helminth diversity; linkage disequilibrium is very unlikely to account for the shared pattern of association because there is no correlation in allele frequency between HNA1 and the active FCGR2C allele across the populations analyzed (r2 = 0.03).
Table 4.
Variant Characteristics and p Values of the Correlation between Variant Frequency and Pathogen Diversity across Human Populations
| FCGR2A His131 | HNA1a | FCGR2C Gln57 | FCGR2B Thr232 | FCGR3A Copy Number | FCGR3B Copy Number | |
|---|---|---|---|---|---|---|
| Characteristics | ||||||
| SNP | rs1801274 | rs76714703 | rs10917661 | rs1050501 | − | − |
| Class of receptor | activating | activating | activating | inhibiting | activating | activating |
| Functional consequence of allele | stronger binding of IgG2 | stronger binding of IgG1 and IgG3 | presence of receptor on NK cells | absence of receptor on cell surface | variable amount of receptor on NK cells | variable amount of receptor on neutrophils |
| Association with disease | protective against SLE; susceptibility to myasthenia gravis; susceptibility to Kawasaki disease | protective against SLE; benign course of multiple sclerosis | increases idiopathic thrombocytopenic purpurea risk | susceptibility to SLE; protection against malaria | bacterial infection | low copy-number susceptibility to SLE and rheumatoid arthritis |
| Correlation p values | ||||||
| Virus | 0.6185 | 0.0067 | 0.595 | 0.1692 | 0.0624 | 0.6115 |
| Bacteria | 0.0242 | 0.2744 | 0.0016 | 0.5453 | 0.0518 | 0.413 |
| Protozoa | 0.0140 | 0.6616 | 0.4873 | 0.4345 | 0.0835 | 0.2147 |
| Helminth | 0.0252 | 0.0018 | 0.0005 | 0.3186 | 0.083 | 0.9985 |
| Malaria (WHO) | 0.7317 | 0.4253 | 0.3927 | 0.8117 | 0.1242 | 0.771 |
| Malaria (Gideon) | 0.6466 | 0.3341 | 0.2749 | 0.6941 | 0.0458 | 0.7018 |
The p values in bold remain significant after correction for multiple testing. The following abbreviations are used: WHO, World Health Organization; NK, natural killer; and SLE, systemic lupus erythematosus.
Evolution of FCGR3 in Mammals
Given the highly significant correlation between HNA1a frequency and helminth diversity across 51 human populations, we sought to support this finding by using comparative sequence data from different mammalian species. Helminth infection is present across the mammalian order, yet levels of helminth infection, as measured by species richness, differ between each genus. We reasoned that the orthologs of FCGR3A and FCGR3B would show evidence of positive selection in tree branches that have had high levels of helminth infection. We also reasoned that amino acids under positive-selection pressure would be involved in the interaction with IgG and overlap with the amino acids distinguishing the HNA1a and HNA1b alleles in humans. We identified putative FCGR3 orthologs in 26 mammalian species and constructed a maximum-likelihood phylogenetic tree from these coding sequences (Figure 3). This tree suggests that both chimpanzees and gibbons have duplicated FCGR3. Grouping together paralogs rather than orthologs suggests that the duplications are recurrent in each species lineage. Alternatively, the duplication might have occurred in the ape ancestor and might have been homogenized within the species by gene conversion. The lack of duplication in the orangutan could then be a result of either a loss of a duplication or poor sequence coverage of the orangutan genome. There appear to be two paralogous copies of the rabbit FCGR3 ortholog, which differs by four amino acids; alternatively, these could be allelic variants.
Figure 3.
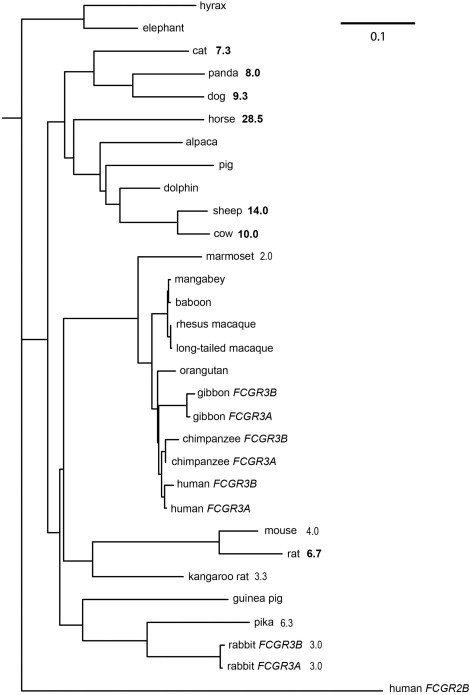
Phylogenetic Tree of FCGR3 Genes in Mammals
Maximum-likelihood phylogeny of full-length FCGR3 coding sequences. Numbers indicate helminth diversity for that particular genus (see Material and Methods), and numbers in bold reflect those genera classified as high helminth diversity in subsequent analyses. The scale bar indicates the branch length representing 0.1 nucleotide substitutions per site.
We measured positive selection by investigating the pattern of nonsynonymous and synonymous substitution rates between the FCGR3 orthologs by utilizing the maximum-likelihood approach implemented by the software PAML v.4.4b. We found very strong evidence of natural selection acting on a subset of amino acids in FCGR3 (Figure 4 and Table 5). There is also some support for a model where positive selection has acted more strongly on certain amino acids in the lineages with high levels of helminth infection (p = 0.015). The amino acids identified as being under positive selection were plotted on the crystal structure of FCGR3B bound to IgG (Figure 4). Three patches of positively selected amino acids can be identified. Patch 1 is clearly associated with antibody binding, and the presence of histidines in this region strongly suggests that natural selection for different binding affinities is mediated by changes in amino-acid-residue pH. Patch 2 is on a loop region that is close to—but not directly associated with—the antibody binding site. It might interact with either the larger antibody complex or the glycosylation moieties on the Fc domain. A human polymorphic site within this patch is known to determine the neutrophil antigen HNA1c (also known as SH antigen),43 but the effect on IgG binding of HNA1c is, to our knowledge, not known. The third patch is at the interdomain site, the cleft between the two domains of FCGR3. Alteration of residues here is very likely to alter the orientation of the two domains and, therefore, binding affinity.
Figure 4.
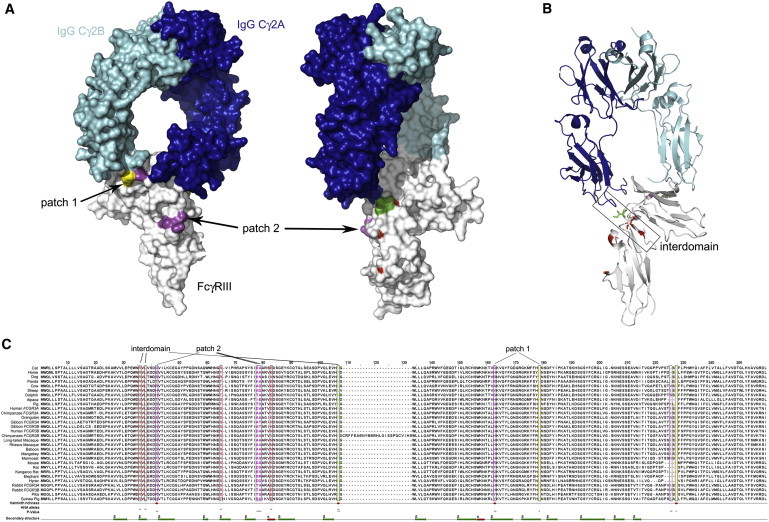
Structure of IgG Binding to the Extracellular Domain of Fcγ Receptor IIIB
Color coding is as follows: red, HNA1a/b polymorphism; magenta, positively selected site in mammals (posterior probability > 99%); green, HNA1a/b polymorphism and positively selected in mammals; yellow, positively selected site in mammals (p > 95%). Also see Table 6.
(A) Patch 1 and Patch 2 are selected variants highlighted on the space-filling protein structure. An alternative (rotated ∼90°) view is also shown and shows Patch 2 and the HNA1 variant.
(B) A view of protein structure, in ribbon format, highlights the interdomain region.
(C) An amino acid sequence alignment of species analyzed shows a predicted secondary structure, positively selected amino acids, and amino acids likely to have been shaped by helminth diversity.
Table 5.
PAML Analysis of Positive Selection on FCGR3 in Mammals
| Test for |
Null Hypothesis (H0) |
Alternative Hypothesis (H1) |
p Value | ω2 | Proportion of Sites under Selection | ||||
|---|---|---|---|---|---|---|---|---|---|
| Model | Parameters | Log Likelihood | Model | Parameters | Log Likelihood | ||||
| Variable selection between codons | 0 | ω | −8,068.63 | 3 | ω0, ω1, ω2 | −7,806.75 | 4.9 × 10−112 | >1.86 | 0.21 |
| Positive selection | 1a | 0 < ω0 <1, ω1 = 1 | −7,854.90 | 2a | 0 < ω0 <1, ω1 = 1, ω2 ≥ 1 | −7,820.03 | 7.2 × 10⁻¹⁶ | 2.62 | 0.11 |
| Positive selection | 7 | p, q | −7,840.73 | 8 | p, q, ω2 ≥ 1 | −7,804.38 | 1.6 × 10⁻¹⁶ | 2.14 | 0.14 |
| Positive selection on high helminth branches | Anull | 0 < ω0 <1, ω1 = 1, ω2 = 1 on high helminth branches | −7,851.75 | A | 0 < ω0 <1, ω1 = 1, ω2 ≥ 1 on high helminth branches | −7,848.84 | 0.0158 | 3.81 | 0.053 |
Importantly, a subset of these amino acids is identified as likely to be subject to positive selection possibly in response to higher levels of helminth infection (Table 6 and Figure 4). One of these (IV, position 83 in the crystal structure) is also the amino acid that defines the HNA1a/b polymorphism (which is associated with helminth diversity in human populations), is at the interdomain site, and directly contacts the IgG Cγ2 region (green residue, Figure 4). Two other amino acids that contribute to the HNA1a/b polymorphism are also in the interdomain region, possibly altering the angle of the domain and, therefore, binding affinity for different IgG subtypes.
Table 6.
FCGR3 Amino Acid Residues Identified as Being under Positive Selection
| Amino Acid | Position (Crystal Structure) | Position (Species Alignment) | Selection Posterior Probability | Associated with Helminth Richness | Color inFigure 4 | Human Neutrophil Antigen | dbSNP 133 |
|---|---|---|---|---|---|---|---|
| Ser or Arg | 18 | 36 | NS | no | red | HNA1a or HNA1b | − |
| Leu | 20 | 38 | NS | no | red | − | − |
| Ser | 24 | 42 | 1.000 | yes | magenta | − | − |
| Ser or Asn | 47 | 65 | NS | no | red | HNA1a or HNA1b | rs76714703 |
| Asp | 59 | 78 | 0.999 | no | magenta | − | − |
| Ala or Asp | 60 | 79 | 0.996 | no | magenta | HNA1b or HNA1c | rs5030738 |
| Asn or Asp | 64 | 83 | NS | no | red | HNA1a or HNA1b | − |
| Ile or Val | 88 | 107 | 0.999 | yes | green | HNA1a or HNA1b | − |
| His | 119 | 163 | 0.992 | yes | magenta | − | − |
| His | 135 | 179 | 0.990 | no | yellow | − | − |
| Ile | NA | 226 | 0.995 | no | magenta | − | − |
| Ser | NA | 228 | 0.962 | yes | yellow | − | − |
The following abbreviations are used: NS, not significant; and NA, not available.
Discussion
We show that the CNV of the Fcγ-receptor genes in chromosomal region 1q23.3 is mediated by recurrent NAHR between the two segmental duplications that carry FCGR3A and FCGR3B. Deletions of FCGR3A or FCGR3B differ only in the position of the NAHR breakpoint; FCGR3A deletions are proximal to the gene, and FCGR3B deletions are distal to the gene. Each deletion allele of the ten analyzed from different populations is the result of an independent mutation event that appears to occur in two distinct clusters. This suggests that the CNV has a high mutation rate and that NAHR events occur in hotspots.
Using a population-based coalescent approach, we show that the mutation rate of the FCGR3 CNV is about 0.1% per generation. This is lower than the 0.7% rate observed at another multicopy CNV locus, the beta-defensin region, probably because of the unusual genomic structure of that region.44 However, the rate is equivalent to that previously observed at some other complex multicopy CNVs like complement C4.45 This mutation rate is high enough to suggest that direct measurement of de novo CNV events in sperm will be a viable alternative approach in directly interrogating the mutation rate of this locus, although the large region of potential de novo breakpoints will make development of such assays technically challenging.
We show that pathogen richness is likely to have influenced patterns of variation at the Fc receptors in humans. The association between bacterial pathogen diversity and an active, expressed Fcγ receptor IIC at the NK cell surface is particularly interesting. NK cells respond to antibody-antigen complexes by triggering ADCC mediated by both Fcγ receptor IIIA and Fcγ receptor IIC (if expressed), which can then destroy host cells infected by bacteria.46 It is interesting to speculate that the dramatic interindividual variability of NK-cell-mediated bacterial killing46 is due to the polymorphism of FCGR2C. FCGR3B expression is restricted to neutrophils, eosinophils, and mast cells, so the association between HNA1a allele frequency and viral diversity might be due to variation in the nature of FCGR3B-mediated degranulation by mast cells and eosinophils or to phagocytosis of antibody-virus complexes by neutrophils.
We identify helminth pathogens, such as those of the genus Schistosoma or Ascaris, as a potential source of selection for Fcγ receptors by using both interspecies and intraspecies data. Chronic helminth infection is characterized by a type II immune response, which is skewed toward the production of IgE antibodies and for which signaling occurs primarily through Fcε receptors.47 However, eosinophils play a key role in the type II immune response and help contain the infection by binding IgG-coated parasites via Fcγ receptors and stimulating ADCC.48–50 For FCGR2C and FCGR3B, we show that helminth diversity is correlated with the tested polymorphisms. FCGR3B is expressed on eosinophils, and FCGR2C is expressed on NK cells also involved in mediating ADCC. This is consistent with a model in which a variable level of chronic helminth infection has provided a selective pressure on these genes between human populations.
Helminths are thought to have coexisted with mammals throughout mammalian evolution and are known to modulate the immune system with immunosuppressive activity.51 We show that certain amino acids of Fcγ receptor III have evolved rapidly during mammalian evolution and that this pattern might be explained by differences in helminth diversity between different species. Furthermore, one of the positively selected amino acids also constitutes the HNA1a/b polymorphism associated with helminth diversity, and several positively selected amino acids directly interact with IgG. The HNA1c polymorphism, which is rare (2.5%), at least in Europeans,43 is also determined by variation at an amino acid that has undergone positive selection in mammals. This variant should be a priority for further functional and genetic studies.
All together, these data suggest that alterations to IgG binding in the context of helminth infection have driven positive selection in Fcγ receptors among different mammalian species. It has been suggested previously that malaria has affected the frequency of polymorphisms at these loci.52 We find no correlation between protozoa diversity and allele frequency at these polymorphisms, but such a correlation would be expected if malaria were acting as an agent of natural selection and is indeed observed at other known loci associated with malaria.37 Similarly, two different measures of malaria prevalence showed no correlation with allele frequencies. Therefore, we find no support for this hypothesis, although this does not, of course, contradict the fact that genetic variation at these loci affects malaria susceptibility in current populations.20
Our conclusions from the genetic data should prompt further analysis of the role of Fcγ receptors in helminth infection. Importantly, our model explicitly links evolutionary pressure of helminth infection with autoimmune disease via adaptation at the genetic level. It supports the hygiene hypothesis, which states that in the absence of chronic helminth infection, as seen in modern first-world populations, previously selected alleles respond differently to immune-system challenges and therefore alter the susceptibility to autoimmune disease.23,53 It also points toward genetic and evolutionary investigation of complex structurally variable genomic regions that contain immune genes, of which there are many,54 as an approach to finding disease susceptibility alleles.
Acknowledgments
We would like to thank Mark Jobling for access to a capillary-electrophoresis machine and Rita Neumann for helpful discussions. This work was supported by Wellcome Trust grant 087663 to E.J.H.
Supplemental Data
Web Resources
The URLs for data presented herein are as follows:
Human Genome Diversity Panel, http://www.cephb.fr/en/hgdp/diversity.php/
Online Mendelian Inheritance in Man (OMIM), http://www.omim.org
RCSB PDB Protein Databank, http://www.rcsb.org
References
- 1.Barreiro L.B., Quintana-Murci L. From evolutionary genetics to human immunology: How selection shapes host defence genes. Nat. Rev. Genet. 2010;11:17–30. doi: 10.1038/nrg2698. [DOI] [PubMed] [Google Scholar]
- 2.Nimmerjahn F., Ravetch J.V. Fcgamma receptors as regulators of immune responses. Nat. Rev. Immunol. 2008;8:34–47. doi: 10.1038/nri2206. [DOI] [PubMed] [Google Scholar]
- 3.Qiu W.Q., de Bruin D., Brownstein B.H., Pearse R., Ravetch J.V. Organization of the human and mouse low-affinity Fc gamma R genes: duplication and recombination. Science. 1990;248:732–735. doi: 10.1126/science.2139735. [DOI] [PubMed] [Google Scholar]
- 4.Ravetch J.V., Perussia B. Alternative membrane forms of Fc gamma RIII(CD16) on human natural killer cells and neutrophils. Cell type-specific expression of two genes that differ in single nucleotide substitutions. J. Exp. Med. 1989;170:481–497. doi: 10.1084/jem.170.2.481. [DOI] [PMC free article] [PubMed] [Google Scholar]
- 5.Breunis W.B., van Mirre E., Geissler J., Laddach N., Wolbink G., van der Schoot E., de Haas M., de Boer M., Roos D., Kuijpers T.W. Copy number variation at the FCGR locus includes FCGR3A, FCGR2C and FCGR3B but not FCGR2A and FCGR2B. Hum. Mutat. 2009;30:E640–E650. doi: 10.1002/humu.20997. [DOI] [PubMed] [Google Scholar]
- 6.Reilly A.F., Surrey S., Rappaport E.F., Schwartz E., McKenzie S.E. Variation in human FCGR2C gene copy number. Immunogenetics. 1994;40:456. doi: 10.1007/BF00177829. [DOI] [PubMed] [Google Scholar]
- 7.Metes D., Ernst L.K., Chambers W.H., Sulica A., Herberman R.B., Morel P.A. Expression of functional CD32 molecules on human NK cells is determined by an allelic polymorphism of the FcgammaRIIC gene. Blood. 1998;91:2369–2380. [PubMed] [Google Scholar]
- 8.Breunis W.B., van Mirre E., Bruin M., Geissler J., de Boer M., Peters M., Roos D., de Haas M., Koene H.R., Kuijpers T.W. Copy number variation of the activating FCGR2C gene predisposes to idiopathic thrombocytopenic purpura. Blood. 2008;111:1029–1038. doi: 10.1182/blood-2007-03-079913. [DOI] [PubMed] [Google Scholar]
- 9.Niederer H.A., Clatworthy M.R., Willcocks L.C., Smith K.G.C. FcgammaRIIB, FcgammaRIIIB, and systemic lupus erythematosus. Ann. N Y Acad. Sci. 2010;1183:69–88. doi: 10.1111/j.1749-6632.2009.05132.x. [DOI] [PubMed] [Google Scholar]
- 10.Fanciulli M., Vyse T.J., Aitman T.J. Copy number variation of Fc gamma receptor genes and disease predisposition. Cytogenet. Genome Res. 2008;123:161–168. doi: 10.1159/000184704. [DOI] [PubMed] [Google Scholar]
- 11.Bux J. Human neutrophil alloantigens. Vox Sang. 2008;94:277–285. doi: 10.1111/j.1423-0410.2007.01031.x. [DOI] [PubMed] [Google Scholar]
- 12.Aitman T.J., Dong R., Vyse T.J., Norsworthy P.J., Johnson M.D., Smith J., Mangion J., Roberton-Lowe C., Marshall A.J., Petretto E. Copy number polymorphism in Fcgr3 predisposes to glomerulonephritis in rats and humans. Nature. 2006;439:851–855. doi: 10.1038/nature04489. [DOI] [PubMed] [Google Scholar]
- 13.Morris D.L., Roberts A.L., Witherden A.S., Tarzi R., Barros P., Whittaker J.C., Cook T.H., Aitman T.J., Vyse T.J. Evidence for both copy number and allelic (NA1/NA2) risk at the FCGR3B locus in systemic lupus erythematosus. Eur. J. Hum. Genet. 2010;18:1027–1031. doi: 10.1038/ejhg.2010.56. [DOI] [PMC free article] [PubMed] [Google Scholar]
- 14.McKinney C., Fanciulli M., Merriman M.E., Phipps-Green A., Alizadeh B.Z., Koeleman B.P.C., Dalbeth N., Gow P.J., Harrison A.A., Highton J. Association of variation in Fcgamma receptor 3B gene copy number with rheumatoid arthritis in Caucasian samples. Ann. Rheum. Dis. 2010;69:1711–1716. doi: 10.1136/ard.2009.123588. [DOI] [PMC free article] [PubMed] [Google Scholar]
- 15.Robinson J.I., Carr I.M., Cooper D.L., Rashid L.H., Martin S.G., Emery P., Isaacs J.D., Barton A., Wilson A.G., Barrett J.H., Morgan A.W., BRAGGSS Confirmation of association of FCGR3B but not FCGR3A copy number with susceptibility to autoantibody positive rheumatoid arthritis. Hum. Mutat. 2012;33:741–749. doi: 10.1002/humu.22031. [DOI] [PubMed] [Google Scholar]
- 16.McKinney C., Merriman T.R. Meta-analysis confirms a role for deletion in FCGR3B in autoimmune phenotypes. Hum. Mol. Genet. 2012;21:2370–2376. doi: 10.1093/hmg/dds039. [DOI] [PubMed] [Google Scholar]
- 17.Khor C.C., Davila S., Breunis W.B., Lee Y.C., Shimizu C., Wright V.J., Yeung R.S.M., Tan D.E.K., Sim K.S., Wang J.J., Hong Kong–Shanghai Kawasaki Disease Genetics Consortium. Korean Kawasaki Disease Genetics Consortium. Taiwan Kawasaki Disease Genetics Consortium. International Kawasaki Disease Genetics Consortium. US Kawasaki Disease Genetics Consortium. Blue Mountains Eye Study Genome-wide association study identifies FCGR2A as a susceptibility locus for Kawasaki disease. Nat. Genet. 2011;43:1241–1246. doi: 10.1038/ng.981. [DOI] [PubMed] [Google Scholar]
- 18.Floto R.A., Clatworthy M.R., Heilbronn K.R., Rosner D.R., MacAry P.A., Rankin A., Lehner P.J., Ouwehand W.H., Allen J.M., Watkins N.A., Smith K.G. Loss of function of a lupus-associated FcgammaRIIb polymorphism through exclusion from lipid rafts. Nat. Med. 2005;11:1056–1058. doi: 10.1038/nm1288. [DOI] [PubMed] [Google Scholar]
- 19.Niederer H.A., Willcocks L.C., Rayner T.F., Yang W., Lau Y.L., Williams T.N., Scott J.A.G., Urban B.C., Peshu N., Dunstan S.J. Copy number, linkage disequilibrium and disease association in the FCGR locus. Hum. Mol. Genet. 2010;19:3282–3294. doi: 10.1093/hmg/ddq216. [DOI] [PMC free article] [PubMed] [Google Scholar]
- 20.Willcocks L.C., Carr E.J., Niederer H.A., Rayner T.F., Williams T.N., Yang W., Scott J.A.G., Urban B.C., Peshu N., Vyse T.J. A defunctioning polymorphism in FCGR2B is associated with protection against malaria but susceptibility to systemic lupus erythematosus. Proc. Natl. Acad. Sci. USA. 2010;107:7881–7885. doi: 10.1073/pnas.0915133107. [DOI] [PMC free article] [PubMed] [Google Scholar]
- 21.Stewart-Akers A.M., Cunningham A., Wasko M.C., Morel P.A. Fc γ R expression on NK cells influences disease severity in rheumatoid arthritis. Genes Immun. 2004;5:521–529. doi: 10.1038/sj.gene.6364121. [DOI] [PubMed] [Google Scholar]
- 22.Hollox E.J., Detering J.C., Dehnugara T. An integrated approach for measuring copy number variation at the FCGR3 (CD16) locus. Hum. Mutat. 2009;30:477–484. doi: 10.1002/humu.20911. [DOI] [PMC free article] [PubMed] [Google Scholar]
- 23.Sironi M., Clerici M. The hygiene hypothesis: An evolutionary perspective. Microbes Infect. 2010;12:421–427. doi: 10.1016/j.micinf.2010.02.002. [DOI] [PubMed] [Google Scholar]
- 24.Cann H.M., de Toma C., Cazes L., Legrand M.F., Morel V., Piouffre L., Bodmer J., Bodmer W.F., Bonne-Tamir B., Cambon-Thomsen A. A human genome diversity cell line panel. Science. 2002;296:261–262. doi: 10.1126/science.296.5566.261b. [DOI] [PubMed] [Google Scholar]
- 25.Rosenberg N.A. Standardized subsets of the HGDP-CEPH Human Genome Diversity Cell Line Panel, accounting for atypical and duplicated samples and pairs of close relatives. Ann. Hum. Genet. 2006;70:841–847. doi: 10.1111/j.1469-1809.2006.00285.x. [DOI] [PubMed] [Google Scholar]
- 26.Li J.Z., Absher D.M., Tang H., Southwick A.M., Casto A.M., Ramachandran S., Cann H.M., Barsh G.S., Feldman M., Cavalli-Sforza L.L., Myers R.M. Worldwide human relationships inferred from genome-wide patterns of variation. Science. 2008;319:1100–1104. doi: 10.1126/science.1153717. [DOI] [PubMed] [Google Scholar]
- 27.Amigo J., Salas A., Phillips C., Carracedo Á. SPSmart: Adapting population based SNP genotype databases for fast and comprehensive web access. BMC Bioinformatics. 2008;9:428. doi: 10.1186/1471-2105-9-428. [DOI] [PMC free article] [PubMed] [Google Scholar]
- 28.Armour J.A.L., Palla R., Zeeuwen P.L.J.M., den Heijer M., Schalkwijk J., Hollox E.J. Accurate, high-throughput typing of copy number variation using paralogue ratios from dispersed repeats. Nucleic Acids Res. 2007;35:e19. doi: 10.1093/nar/gkl1089. [DOI] [PMC free article] [PubMed] [Google Scholar]
- 29.Stephens M., Smith N.J., Donnelly P. A new statistical method for haplotype reconstruction from population data. Am. J. Hum. Genet. 2001;68:978–989. doi: 10.1086/319501. [DOI] [PMC free article] [PubMed] [Google Scholar]
- 30.Jeffreys A.J., Neumann R., Wilson V. Repeat unit sequence variation in minisatellites: A novel source of DNA polymorphism for studying variation and mutation by single molecule analysis. Cell. 1990;60:473–485. doi: 10.1016/0092-8674(90)90598-9. [DOI] [PubMed] [Google Scholar]
- 31.Gaunt T.R., Rodriguez S., Guthrie P.A.I., Day I.N.M. An expectation-maximization program for determining allelic spectrum from CNV data (CoNVEM): insights into population allelic architecture and its mutational history. Hum. Mutat. 2010;31:414–420. doi: 10.1002/humu.21199. [DOI] [PubMed] [Google Scholar]
- 32.Hudson R.R., Kaplan N.L. Statistical properties of the number of recombination events in the history of a sample of DNA sequences. Genetics. 1985;111:147–164. doi: 10.1093/genetics/111.1.147. [DOI] [PMC free article] [PubMed] [Google Scholar]
- 33.Wilson I.J., Weale M.E., Balding D.J. Inferences from DNA data: population histories, evolutionary processes and forensic match probabilities. J. R. Stat. Soc. Ser. A Stat. Soc. 2003;166:155–201. [Google Scholar]
- 34.Tenesa A., Navarro P., Hayes B.J., Duffy D.L., Clarke G.M., Goddard M.E., Visscher P.M. Recent human effective population size estimated from linkage disequilibrium. Genome Res. 2007;17:520–526. doi: 10.1101/gr.6023607. [DOI] [PMC free article] [PubMed] [Google Scholar]
- 35.Fumagalli M., Pozzoli U., Cagliani R., Comi G.P., Riva S., Clerici M., Bresolin N., Sironi M. Parasites represent a major selective force for interleukin genes and shape the genetic predisposition to autoimmune conditions. J. Exp. Med. 2009;206:1395–1408. doi: 10.1084/jem.20082779. [DOI] [PMC free article] [PubMed] [Google Scholar]
- 36.Fumagalli M., Pozzoli U., Cagliani R., Comi G.P., Bresolin N., Clerici M., Sironi M. The landscape of human genes involved in the immune response to parasitic worms. BMC Evol. Biol. 2010;10:264. doi: 10.1186/1471-2148-10-264. [DOI] [PMC free article] [PubMed] [Google Scholar]
- 37.Pozzoli U., Fumagalli M., Cagliani R., Comi G.P., Bresolin N., Clerici M., Sironi M. The role of protozoa-driven selection in shaping human genetic variability. Trends Genet. 2010;26:95–99. doi: 10.1016/j.tig.2009.12.010. [DOI] [PubMed] [Google Scholar]
- 38.Handley L.J.L., Manica A., Goudet J., Balloux F. Going the distance: Human population genetics in a clinal world. Trends Genet. 2007;23:432–439. doi: 10.1016/j.tig.2007.07.002. [DOI] [PubMed] [Google Scholar]
- 39.Poulin R. Phylogeny, ecology, and the richness of parasite communities in vertebrates. Ecol. Monogr. 1995;65:283–302. [Google Scholar]
- 40.Felsenstein J. Department of Genome Sciences, University of Washington; Seattle: 2005. PHYLIP (Phylogeny Inference Package) Version 3.6. [Google Scholar]
- 41.Yang Z. PAML 4: Phylogenetic analysis by maximum likelihood. Mol. Biol. Evol. 2007;24:1586–1591. doi: 10.1093/molbev/msm088. [DOI] [PubMed] [Google Scholar]
- 42.Lindsay S.J., Khajavi M., Lupski J.R., Hurles M.E. A chromosomal rearrangement hotspot can be identified from population genetic variation and is coincident with a hotspot for allelic recombination. Am. J. Hum. Genet. 2006;79:890–902. doi: 10.1086/508709. [DOI] [PMC free article] [PubMed] [Google Scholar]
- 43.Bux J., Stein E.L., Bierling P., Fromont P., Clay M., Stroncek D., Santoso S. Characterization of a new alloantigen (SH) on the human neutrophil Fc γ receptor IIIb. Blood. 1997;89:1027–1034. [PubMed] [Google Scholar]
- 44.Abu Bakar S., Hollox E.J., Armour J.A.L. Allelic recombination between distinct genomic locations generates copy number diversity in human β-defensins. Proc. Natl. Acad. Sci. USA. 2009;106:853–858. doi: 10.1073/pnas.0809073106. [DOI] [PMC free article] [PubMed] [Google Scholar]
- 45.Fu W., Zhang F., Wang Y., Gu X., Jin L. Identification of copy number variation hotspots in human populations. Am. J. Hum. Genet. 2010;87:494–504. doi: 10.1016/j.ajhg.2010.09.006. [DOI] [PMC free article] [PubMed] [Google Scholar]
- 46.Garcia-Peñarrubia P., Koster F.T., Kelley R.O., McDowell T.D., Bankhurst A.D. Antibacterial activity of human natural killer cells. J. Exp. Med. 1989;169:99–113. doi: 10.1084/jem.169.1.99. [DOI] [PMC free article] [PubMed] [Google Scholar]
- 47.Allen J.E., Maizels R.M. Diversity and dialogue in immunity to helminths. Nat. Rev. Immunol. 2011;11:375–388. doi: 10.1038/nri2992. [DOI] [PubMed] [Google Scholar]
- 48.de Andres B., Rakasz E., Hagen M., McCormik M.L., Mueller A.L., Elliot D., Metwali A., Sandor M., Britigan B.E., Weinstock J.V., Lynch R.G. Lack of Fc-ε receptors on murine eosinophils: Implications for the functional significance of elevated IgE and eosinophils in parasitic infections. Blood. 1997;89:3826–3836. [PubMed] [Google Scholar]
- 49.Khalife J., Dunne D.W., Richardson B.A., Mazza G., Thorne K.J., Capron A., Butterworth A.E. Functional role of human IgG subclasses in eosinophil-mediated killing of schistosomula of Schistosoma mansoni. J. Immunol. 1989;142:4422–4427. [PubMed] [Google Scholar]
- 50.Baskar P., Silberstein D.S., Pincus S.H. Inhibition of IgG-triggered human eosinophil function by IL-4. J. Immunol. 1990;144:2321–2326. [PubMed] [Google Scholar]
- 51.Jackson J.A., Friberg I.M., Little S., Bradley J.E. Review series on helminths, immune modulation and the hygiene hypothesis: immunity against helminths and immunological phenomena in modern human populations: Coevolutionary legacies? Immunology. 2009;126:18–27. doi: 10.1111/j.1365-2567.2008.03010.x. [DOI] [PMC free article] [PubMed] [Google Scholar]
- 52.Espeli M., Niederer H.A., Traherne J.A., Trowsdale J., Smith K.G.C. Genetic variation, Fcγ receptors, KIRs and infection: The evolution of autoimmunity. Curr. Opin. Immunol. 2010;22:715–722. doi: 10.1016/j.coi.2010.10.003. [DOI] [PubMed] [Google Scholar]
- 53.Dunne D.W., Cooke A. A worm's eye view of the immune system: Consequences for evolution of human autoimmune disease. Nat. Rev. Immunol. 2005;5:420–426. doi: 10.1038/nri1601. [DOI] [PubMed] [Google Scholar]
- 54.Sudmant P.H., Kitzman J.O., Antonacci F., Alkan C., Malig M., Tsalenko A., Sampas N., Bruhn L., Shendure J., Eichler E.E., 1000 Genomes Project Diversity of human copy number variation and multicopy genes. Science. 2010;330:641–646. doi: 10.1126/science.1197005. [DOI] [PMC free article] [PubMed] [Google Scholar]
Associated Data
This section collects any data citations, data availability statements, or supplementary materials included in this article.