

Abstract
Cluster-detection approaches, commonly used in epidemiology and astronomy, can be applied in the context of genetic sequence data for the identification of genetic regions significantly enriched with rare disease-risk variants (DRVs). Unlike existing association tests for sequence data, the goal of cluster-detection methods is to localize significant disease mutation clusters within a gene or region of interest. Here, we focus on a chromosome 2q replicated linkage region that is associated with autism spectrum disorder (ASD) and that has been sequenced in three independent datasets. We found that variants in one gene, LRP2, residing on 2q are associated with ASD in two datasets (the combined variable-threshold-test p value is 1.2 × 10⁻⁵). Using a cluster-detection method, we show that in the discovery and replication datasets, variants associated with ASD cluster preponderantly in 25 kb windows (adjusted p values are p1 = 0.003 and p2 = 0.002), and the two windows are highly overlapping. Furthermore, for the third dataset, a 25 kb region similar to those in the other two datasets shows significant evidence of enrichment of rare DRVs. The region implicated by all three studies is involved in ligand binding, suggesting that subtle alterations in either LRP2 expression or LRP2 primary sequence modulate the uptake of LRP2 ligands. BMP4 is a ligand of particular interest given its role in forebrain development, and modest changes in BMP4 binding, which binds to LRP2 near the mutation cluster, might subtly affect development and could lead to autism-associated phenotypes.
Introduction
Advances in next-generation-sequencing technologies1 facilitate large-scale sequencing studies and allow for a comprehensive investigation of the role that rare variants might play in complex diseases with the hope that rare variants can provide further insight into the underlying biology of these diseases. Ongoing sequencing studies are already generating unprecedented amounts of genetic data. The large number of genetic variants, most of which have low population frequencies, being uncovered in these datasets creates particular challenges for the statistical analysis of this new type of data. Already, many association tests for sequence data have been proposed.2–13 These methods are concerned with rejecting the null hypothesis that variants in a gene or region are not associated with disease.
The focus in this paper is on the localization of rare disease-risk variants (DRVs) in a larger genetic region via a cluster-detection method. Unlike existing association tests that test for disease association with variants in a contained genetic region, the goal here is to find the window (within the larger region) in which DRVs cluster more significantly than they do in the rest of the region, i.e., outside of the window. Here, we describe a method that is specifically designed to identify such small regions enriched with DRVs and that is quite different from existing association tests (more details on the differences between cluster-detection methods and association tests will be given later in the Material and Methods section). Cluster-detection methods are commonly used in applied sciences, such as in epidemiology for the identification of hotspots of disease cases (i.e., epidemics), as well as in astronomy for the identification of star clusters and galaxies. One popular class of methods is based on the use of scan statistics.14 The underlying idea of scan-statistic methodology is to slide a window of fixed size w along the length of the region and compute an overall statistic for all windows of length w. We propose here a likelihood ratio (LR) statistic that takes into account the underlying spatial distribution of variants in the population; this LR statistic is similar to an approach proposed by Kulldorff.15 For each window W of size w, we calculate the LR statistic, LRW. The window W with the highest value for the LRW is the most likely region to harbor a cluster of DRVs, and an approximate p value for the window with the largest LRW is calculated by Monte Carlo simulations.
Clustering of disease mutations in small regions of a gene has been reported before for some Mendelian diseases and, more recently, for several complex traits as well. For example, highly localized mutations in the gene encoding the cytoskeletal protein filamin A (FLNA [MIM 300017]) lead to a broad range of congenital malformations in humans.16 Similarly for Duchenne muscular dystrophy (MIM 310200) and the milder form, Becker muscular dystrophy (MIM 300376), mutations cluster in actin binding domain 1 (ABD1) of dystrophin17 (MIM 300377). Other examples include Rett syndrome18 (MIM 312750), hereditary angioneurotic edema19 (MIM 106100), Von Willebrand disease type 2A20 (MIM 613554), etc. For complex traits, not many of such studies have been published to date. A recent study focusing on somatic cancer mutations found that disease-causing mutations cluster more often than random mutations, suggesting that mutation hotspots occur at the domain level.21 Similarly, a study on schizophrenia (MIM 181500) and bipolar disorder (MIM 125480) identified significant clustering of nonsynonymous SNPs in two exons encoding the cysteine-rich domain and first transmembrane helix of metabotropic (GRM1) glutamate receptor.22 Here, we report for three independent datasets a clustering of rare DRVs in a small region of LRP2 (MIM 600073), a gene residing in a replicated linkage region for autism spectrum disorder (ASD [MIM 209850]) on chromosome 2q.23–25
Autism and ASD are associated with high heritability. There have been successes in identifying chromosomal abnormalities and copy-number variants that contribute significantly to risk. These variants are individually rare but in combination are etiological factors in as much as 15% of ASD. Candidate-gene sequencing studies have identified many genes associated with high risk, and, with the advent of whole-exome and whole-genome sequencing, it is becoming possible to exhaustively explore the influence of rare variants, both single point and structural, on the risk of developing ASD.
We apply such a cluster-detection method to three independent ASD datasets. We identify LRP2 in an ASD-linked region on chromosome 2q as being associated with ASD in two of the datasets. Furthermore, we show that rare risk variants cluster significantly in affected individuals in highly overlapping regions for all three datasets.
Material and Methods
The underlying idea of scan-statistic methodology is to slide a window of fixed size w along the length of the region and compute a statistic Sw. For example, when testing whether points on a line are uniformly distributed, Sw could be the maximum number of points along the line in any window of size w. Wallenstein and Neff26 derived the approximate distribution for Sw under the simplified assumption that points are independent and uniformly distributed across a region. However, it is well known that genetic-variant positions can cluster in a nonuniform fashion on the basis of purely biological reasons, and such a clustering might not be related to disease. Therefore, any reasonable method needs to take into account the underlying spatial distribution of variants in the population. Kulldorff15 described a LR statistic, and we follow a similar approach here.
Scan Statistic for the Identification of Clusters of Rare DRVs
Let us assume that N unrelated individuals, both affected and unaffected, have been sequenced in a region or gene of interest G. Furthermore, let us assume that there are M rare-variant positions in the region of interest. A rare variant is identified as a variant with a minor allele frequency (MAF) that is less than a fixed threshold (e.g., 0.01) in controls. At each position i with i ≤ M, let ni be the number of individuals that carry a rare variant and let yi be those that are affected. Therefore, yi is binomial (ni, pi), where pi is related to the relative risk at position i. We are working under the assumption that there is a window Wdis such that for and for . Under the null hypothesis, , whereas the alternative hypothesis is that . For a fixed window size, we employ a sliding-window approach and calculate a LR statistic.
Bernoulli Model
To calculate the LR statistic, we first condition on the window W and calculate for each window W of fixed size w the following LR score:
where
Note that and are the maximum likelihood estimators (MLEs) under the alternative hypothesis, whereas is the MLE under the null hypothesis. A pseudocount of 1 is added when the proportions pW, qW, and rG are estimated.
The LR statistic for window size w is then computed as
The window W with the highest value for the LRW is the most likely region to harbor a cluster of DRVs.
Definition of Windows W
The definition of the windows W for consideration is flexible and depends on the region under investigation, such as its length. The unbiased, agnostic approach is to consider all contiguous (and overlapping) windows of a fixed size w. Another possibility is to define windows on the basis of known biological features, such as known functional domains. This could be more powerful than the agnostic approach because it might lead to increased signal in the windows being tested and also reduced penalty for multiple-testing correction.
In the agnostic approach, the size of the sliding window, w, is not known a priori; therefore, we can consider several distinct window sizes and evaluate the overall significance by permutation. More precisely, we can define the generalized LR statistic as the following:
We call this the variable window (VW) approach because multiple window sizes are considered. The maximum window size considered is, at most, 50% of the total region length.
Statistical Significance
For the purposes of inference, we compute the above LRW statistics for all windows W that we choose to consider. Let.
Standard asymptotic-theory results do not apply here (1) because of the implicit assumption of independence among different rare variants in the likelihood calculation and (2) because the parameter Wdis disappears under the null hypothesis and is only present under the alternative.27 Therefore, we use Monte Carlo simulations to compute the p value for . We permute the affection-status labels and then recalculate the maximum LR statistic across all windows as was done for the original study. A similar permutation procedure is performed for the VW approach, which maximizes over multiple window sizes. Note that the resulting p values are adjusted for multiple testing (i.e., for all overlapping windows that are being considered).
Results
Simulated Data
Type-1 Error and Power
We use simulations to investigate the underlying properties of the proposed approaches. We simulated one 1 Mb genomic region under a coalescent model by using the software package COSI.28 The model used in the simulation was the calibrated model for the European population and was an option available in the COSI package (the best-fit model). A total of 10,000 haplotypes were generated. We then randomly sampled small regions of the size of individual genes (between 1.5 and 200 kb).
To evaluate the type-1 error, we derived datasets of 300 cases and 300 controls under the null hypothesis of no association between any of the variants and disease.
To evaluate the power of the approach, we assume that a subregion is enriched with rare DRVs. The percentage of DRVs in a simulated gene is assumed to be 20% for genes of length 10 kb and 20 kb and 3%–10% for larger genes (i.e., 50–200 kb). We have also considered smaller genes of sizes 1.5 kb and 3 kb and assumed that 20%–50% of variants are DRVs. DRVs are chosen to be variants that have a frequency less than 0.01 and that reside in a small subregion of the gene. Assuming D DRVs, then dichotomous phenotypes are simulated from
where . We can specify the effect size at each DRV by setting for the jth disease variant. We take c = 0.549, which results in an odds ratio (OR) of 9 for variants with MAF = 10−4 and an OR of 5.2 for variants with MAF = 10−3. For a large 200 kb gene, we take c = 0.400, which results in an OR of 4.9 for variants with MAF = 10−4 and an OR of 3.3 for variants with MAF = 10−3.
Type-1 Error
In Table 1, we report the empirical type-1 error for the clustering approach described above when it is applied to data simulated under the null hypothesis of no association between any of the variants in the region and disease. Different window sizes are considered between 2 and 8 kb. As shown, the empirical type-1 error agrees well with the nominal one.
Table 1.
Simulated Data
| α |
Type-1 Error Rates |
|||
|---|---|---|---|---|
| w = 2 kb | w = 5 kb | w = 8 kb | VW | |
| 0.05 | 0.049 | 0.061 | 0.055 | 0.055 |
| 0.01 | 0.008 | 0.012 | 0.014 | 0.012 |
Reported in the table are empirical type-1 error rates corresponding to nominal α levels of 0.05 and 0.01. The size, w, of the sliding window can take three possible values between 2 and 8 kb. There are 300 cases and 300 controls. The variable window (VW) approach corresponds to maximizing over windows of length between 2 and 8 kb.
Power
In Table 2, we report power estimates by using simulated data. Power is averaged over randomly chosen regions with lengths between 10 and 20 kb. Similar results are shown in Table A1 for regions of larger size, i.e., 50–200 kb.
Table 2.
Simulated Data
| Gene Length (kb) | Cluster Length (kb) | % DRVs |
Power |
|||
|---|---|---|---|---|---|---|
| w = 2 kb | w = 5 kb | w = 8 kb | VW | |||
| 10 | 2.4 | 20% | 0.77 | 0.59 | 0.28 | 0.73 |
| 10 | 4.8 | 20% | 0.37 | 0.47 | 0.31 | 0.49 |
| 20 | 4.8 | 20% | 0.84 | 0.96 | 0.85 | 0.95 |
| 20 | 9.5 | 20% | 0.52 | 0.70 | 0.80 | 0.64 |
Power is at α = 0.05. There are 300 cases and 300 controls. Gene length refers to the length of the gene, and cluster length refers to the length of the cluster of DRVs. Power is averaged over randomly selected genes of fixed length. 20% of variants in a gene are assumed to be DRVs.
Table A1.
Simulated Data for Large Genes
| Gene Length (kb) | Cluster Length (kb) | % DRVs |
Power |
||||
|---|---|---|---|---|---|---|---|
| w = 5 kb | w = 10 kb | w = 20 kb | w = 30 kb | VW | |||
| 50 | 2.9 | 5% | 0.92 | 0.68 | 0.35 | − | 0.95 |
| 50 | 6.0 | 10% | 1.00 | 0.97 | 0.80 | − | 0.99 |
| 200 | 22 | 3% | 0.66 | − | 0.68 | 0.63 | 0.63 |
| 200 | 25 | 5% | 0.85 | − | 0.99 | 0.95 | 0.90 |
Power is at α = 0.05. There are 300 cases and 300 controls. Gene length refers to the length of the gene, and cluster length refers to the length of the cluster of DRVs. Power is averaged over randomly selected genes of fixed length. 3% – 10% of variants in a gene are assumed to be DRVs. The following abbreviations are used: DRV, disease risk variant; w, window size; and VW, variable-window approach.
The power of the cluster-detection approach depends critically on the length of the cluster window. As shown in Table 2, the power decreases when the size of the cluster window increases relative to the entire region. This is expected because the larger the size of the cluster, the weaker the evidence that DRVs cluster in any particular small region. The size of the scanning window is also important, and the power can vary dramatically depending on that. In particular, the power decreases substantially when the scanning window is too large. Intuitively, the optimal size is the cluster's true size, which is unknown to us. Therefore, we have proposed maximizing over multiple window sizes (the VW approach), an approach which compares well to the optimal power, as we show in simulations (Tables 2, A1, and A3).
Table A3.
Simulated Data for Small Genes
| Gene Length (kb) | Cluster Length (kb) | % DRVs |
Power |
|||||
|---|---|---|---|---|---|---|---|---|
| w = 0.2 kb | w = 0.5 kb | w = 0.8 kb | w = 1.0 kb | w = 1.5 kb | VW | |||
| 3.0 | 0.7 | 20% | − | 0.22 | − | 0.42 | 0.25 | 0.46 |
| 3.0 | 1.7 | 50% | − | 0.08 | − | 0.32 | 0.26 | 0.26 |
| 1.5 | 0.3 | 20% | 0.28 | 0.30 | 0.20 | − | − | 0.14 |
| 1.5 | 0.8 | 50% | 0.14 | 0.15 | 0.32 | − | − | 0.15 |
Power is at α = 0.05. There are 300 cases and 300 controls. Gene length refers to the length of the gene, and cluster length refers to the length of the cluster of DRVs. Power is averaged over randomly selected genes of fixed length. 20% – 50% of variants in a gene are assumed to be DRVs. The following abbreviations are used: DRV, disease risk variant; w, window size; and VW, variable-window approach.
Power will generally be low for genes with little variation, as might be the case with small genes. We have looked at genes of sizes 1.5 kb and 3 kb and show that power can be quite low even if a large percentage (50%) of variants are in fact disease related (Table A3). In such cases, the clustering problem becomes less interesting because of the small number of observed variants in such small genes, and a simple gene-based association test will be more powerful.
Estimation of Cluster Location
Another important measure of performance for the proposed method is the overlap between the true simulated cluster region (T) and the estimated cluster region (E), namely the window with the maximum LR score. One natural measure of overlap between two regions T and E is the Jaccard index of overlap, defined as the size of the intersection divided by the size of the union of the two regions:
If the two regions are disjoint, then , and if the two regions coincide, then .
In Table 3, we report the overlap between the true and estimated cluster regions for the same scenarios for which power was reported in Table 2 (also see Tables A2 and A4). As with power, the highest overlap is achieved when the scanning-window size is close to the true cluster size. We also note that, as with power, the VW approach results in good overlap with the true region (values for the Jaccard index of overlap are over 0.50 in the simulated scenarios).
Table 3.
Simulated Data
| Gene Length (kb) | Cluster Length (kb) | % DRVs |
Jaccard Index of Overlap |
|||
|---|---|---|---|---|---|---|
| w = 2 kb | w = 5 kb | w = 8 kb | VW | |||
| 10 | 2.4 | 20% | 0.69 | 0.41 | 0.22 | 0.66 |
| 10 | 4.8 | 20% | 0.35 | 0.74 | 0.49 | 0.60 |
| 20 | 4.8 | 20% | 0.37 | 0.83 | 0.57 | 0.75 |
| 20 | 9.5 | 20% | 0.19 | 0.47 | 0.72 | 0.54 |
Shown is the overlap between the true cluster region and the estimated cluster region as measured by the Jaccard index of overlap. There are 300 cases and 300 controls. Gene length refers to the length of the gene, and cluster length refers to the length of the cluster of DRVs. The index of overlap is averaged over randomly selected genes of fixed length. 20% of variants in a gene are assumed to be DRVs.
Table A2.
Simulated Data for Large Genes
| Gene Length (kb) | Cluster Length (kb) | % DRVs |
Jaccard Index of Overlap |
||||
|---|---|---|---|---|---|---|---|
| w = 5 kb | w = 10 kb | w = 20 kb | w = 30 kb | VW | |||
| 50 | 2.9 | 5% | 0.57 | 0.23 | 0.09 | − | 0.49 |
| 50 | 6.0 | 10% | 0.69 | 0.55 | 0.28 | − | 0.68 |
| 200 | 22 | 3% | 0.18 | − | 0.59 | 0.58 | 0.55 |
| 200 | 25 | 5% | 0.17 | − | 0.72 | 0.63 | 0.72 |
Shown is the overlap between the true cluster region and the estimated cluster region as measured by the Jaccard index of overlap. There are 300 cases and 300 controls. Gene length refers to the length of the gene, and cluster length refers to the length of the cluster of DRVs. The index of overlap is averaged over randomly selected genes of fixed length. 3% – 10% of variants in a gene are assumed to be DRVs. The following abbreviations are used: DRV, disease risk variant; w, window size; and VW, variable-window approach.
Table A4.
Simulated Data for Small Genes
| Gene Length (kb) | Cluster Length (kb) | % DRVs |
Jaccard Index of Overlap |
|||||
|---|---|---|---|---|---|---|---|---|
| w = 0.2 kb | w = 0.5 kb | w = 0.8 kb | w = 1.0 kb | w = 1.5 kb | VW | |||
| 3.0 | 0.7 | 20% | − | 0.41 | − | 0.46 | 0.32 | 0.48 |
| 3.0 | 1.7 | 50% | − | 0.25 | − | 0.44 | 0.61 | 0.55 |
| 1.5 | 0.3 | 20% | 0.31 | 0.29 | 0.20 | − | − | 0.32 |
| 1.5 | 0.8 | 50% | 0.20 | 0.47 | 0.49 | − | − | 0.37 |
Shown is the overlap between the true cluster region and the estimated cluster region as measured by the Jaccard index of overlap. There are 300 cases and 300 controls. Gene length refers to the length of the gene, and cluster length refers to the length of the cluster of DRVs. The index of overlap is averaged over randomly selected genes of fixed length. 20% – 50% of variants in a gene are assumed to be DRVs. The following abbreviations are used: DRV, disease risk variant; w, window size; and VW, variable-window approach.
Clustering Versus Self-Contained Tests
Such a cluster-detection approach is ideal in situations in which multiple DRVs cluster in a small window of a gene. An alternative statistic for each window would be any of the sequence-based association statistics (e.g., burden statistics) already proposed in the literature comparing affected and unaffected individuals sequenced in a region of interest. The latter test is called a self-contained test in that, unlike the proposed procedure, it does not compare the association signal in a window with the association signal that is outside.
The two types of tests are designed for different goals. In particular, the null hypotheses for the two tests are different. For the proposed test, the null hypothesis is that the DRVs are distributed as expected on the basis of the spatial distribution of variants in the population for that gene, whereas for the self-contained test, the null hypothesis is that there is no association between any of the variants in the gene and disease. If the latter is true, i.e., no association, then the former is true too, i.e., no clustering. The converse, however, is not true. It is possible that variants associated with disease do not cluster. It is only the proposed test that can identify significant clustering of rare DRVs, whereas the self-contained test can only identify significant association in a window, but that does not imply there is significant clustering of rare DRVs in that window.
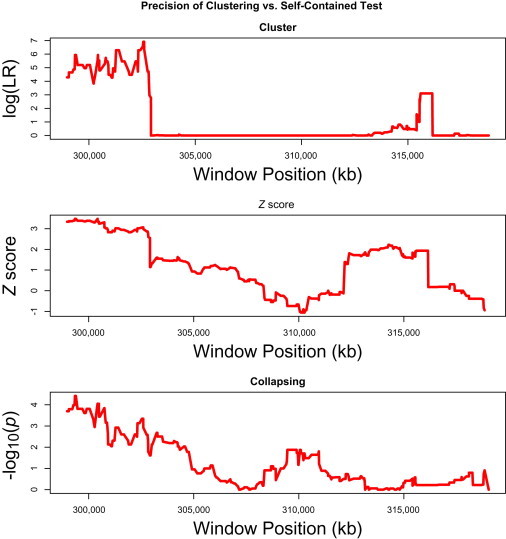
Another important difference between the two methods is in the precision of estimation of cluster boundaries. We have compared the proposed clustering approach with two self-contained tests by using simulated data. We have simulated a gene of size 20 kb and assumed that 20% of all the variants in the gene are DRVs; 66% of DRVs cluster in a 3.5 kb window, whereas the rest are uniformly distributed. We then used a scanning window of size w = 4 kb, and for each such window, we calculated three statistics: (1) the log(LR) statistic proposed here, (2) the Z score from the burden test, and (3) the p value from the collapsing method,2 all of which are restricted to variants with MAF ≤ 0.01. We show in Figure 1 that the clustering-based approach correctly identifies the true cluster window of size 3.5 kb, whereas the burden test and the collapsing test lead to noisier results (more results are shown in the Supplemental Data). Furthermore, it is not clear from the results of the burden or collapsing tests whether there is significant clustering or not; this is naturally so given that such self-contained tests are designed to test for association and not clustering.
Figure 1.
Clustering Versus Self-Contained Tests
Precision of estimation of the cluster boundaries for a simulated cluster region. A 20 kb gene is simulated with DRVs clustered in a 3.5 kb window at the start of the gene. From top to bottom, the graphs depict a cluster test, a burden test, and a collapsing test.
Application to ASD
Discovery Dataset
For the discovery stage, we have used sequence data generated in Faham et al.29 In that study, the authors sequenced (by using mismatch-repair detection on tag arrays) approximately 397 ASD patients and 450 controls; they mostly targeted coding regions of 68 genes within a 20 Mb chromosome 2q linkage peak that has been implicated in ASD by multiple whole-genome linkage scans.
First, we applied the variable threshold (VT) association test4 and tested each of the 68 genes in the linked region on chromosome 2q. By using the VT method and maximizing over several MAF thresholds between 0.01 and 0.50, two genes, namely LRP2 (p = 7.4 × 10⁻⁵) and CMYA3 (p = 10−5 [MIM 609778]) are region-wide significant (Figure 2). The p values for LRP2 and CMYA3 were calculated with several MAF thresholds (Table A5).
Figure 2.
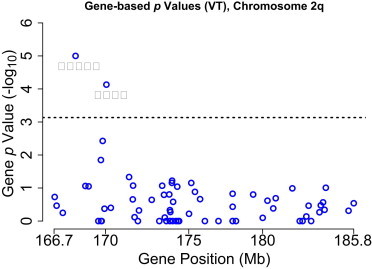
Empirical p Values for 68 Genes Sequenced in the Linked Region on Chromosome 2q29
Two genes, namely LRP2 and CMYA3, remain significant after multiple-testing correction.
Table A5.
Discovery Dataset
| Gene |
p Value |
||
|---|---|---|---|
| MAF 0.01 | MAF 0.10 | VT | |
| LRP2 | 1.2 × 10⁻² | 4.4 × 10⁻⁴ | 7.4 × 10⁻⁵ |
| CMYA3 | 3.8 × 10⁻¹ | 8.0 × 10⁻² | 1.0 × 10⁻⁵ |
LRP2 and CMYA3 p values calculated with minor allele frequency (MAF) ≤ {0.01, 0.10} and with the variable threshold (VT) approach maximizing over multiple MAF thresholds.
LRP2 is a long gene (∼235 kb), and we have performed a clustering analysis to investigate whether rare DRVs cluster preponderantly in a small window of the gene. We have calculated the LR statistic for all overlapping windows of lengths between 5 and 30 kb and have identified one 25 kb window (170,072,764 –170,097,764; hg19) that is enriched with rare risk variants (the p value adjusted for all 25 kb windows is 0.003; Figure 3). The p values for other window sizes are shown in Table 4. The p value adjusted for testing all windows with lengths between 5 and 30 kb is 0.01. The variant amplicons in this window, together with observed frequency counts in cases and controls, are shown in Table A6. Note that for the clustering analysis, variant amplicons with a frequency less than 0.10 in controls were included in the analysis. With a frequency threshold of 0.01, the same peak region is identified, and the p value (adjusted for all windows with sizes between 5 and 30 kb) is 0.054, whereas for a frequency threshold of 0.05, the p value is 0.040.
Figure 3.
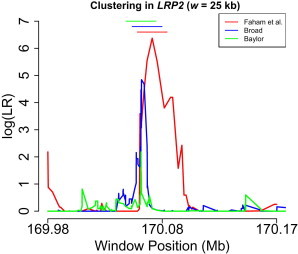
Clustering of Rare DRVs in LRP2 for Three Datasets
For each window, the midpoint is plotted on the x axis. The 25 kb windows with maximum LR score are also shown for the three datasets. Scanning-window length is w = 25 kb.
Table 4.
LRP2 Results
| Dataset |
p Value |
|||||
|---|---|---|---|---|---|---|
| w = 5 kb | w = 10 kb | w = 20 kb | w = 25 kb | w = 30 kb | VW | |
| Discovery | 0.019 | 0.007 | 0.005 | 0.003 | 0.002 | 0.010 |
| ARRA-Broad | 0.134 | 0.070 | 0.035 | 0.038 | 0.200 | 0.099 |
| ARRA-Broad-NS | 0.151 | 0.080 | 0.011 | 0.002 | 0.008 | 0.010 |
Shown are p values for the LR statistic when window size w is between 5 and 30 kb, and variants with MAF ƒ ≤ 0.1 (Discovery) and ƒ ≤ 0.01 (ARRA-Broad) are considered. VW corresponds to the variable-window approach of maximizing over multiple window sizes between 5 and 30 kb. The following abbreviation is used: NS, nonsynonymous only.
Table A6.
LRP2 Variants in the 25 kb Window of Maximum LRW from the Discovery Dataset
| Position | Amplicon Length | Gene | fA | fU |
|---|---|---|---|---|
| 170,072,764 | 259 | LRP2 | 0.005 | 0.000 |
| 170,076,965 | 198 | LRP2 | 0.006 | 0.000 |
| 170,081,821 | 219 | LRP2 | 0.001 | 0.000 |
| 170,082,933 | 257 | LRP2 | 0.009 | 0.007 |
| 170,088,225 | 199 | LRP2 | 0.093 | 0.115 |
| 170,089,922 | 258 | LRP2 | 0.020 | 0.006 |
| 170,094,602 | 274 | LRP2 | 0.003 | 0.005 |
| 170,097,689 | 258 | LRP2 | 0.026 | 0.011 |
LRP2 is a member of the low density lipoprotein receptor (LDLR [MIM 606945]) gene family, and, like LDLR, LRP2 can bind ApoE as well as a large variety of additional ligands. The expression of LRP2 in the brain and the functional importance of some LRP2 ligands have indicated that LRP2 plays a role in neuronal development and regeneration.30 Recently, a de novo deleterious mutation in LRP2 was found by whole-exome sequencing in one ASD case.31 Defects in LRP2 are known to cause Donnai-Barrow (aka, facio-oculo-acoustico-renal) syndrome,32 a rare neurological disease. Furthermore, mutations in LRP2 have been shown to disrupt cortical development in mice.33 LRP2 is also known to play a role in brain development,34 including forebrain development, through its effects on sonic hedgehog (Shh) signaling.35 Specifically, LRP2 binds BMP4, leading to its internalization and catabolism, and reduced levels of LRP2 are associated with elevated BMP4 and disruption of normal brain development.35,36 Also, LRP2 has been shown to be an auxiliary receptor for Sonic hedgehog by regulating the tracking of the SHH/PTCH1 complex.37 Gene-dosage abnormalities at PTCH1 lead to a syndrome that includes developmental delay and/or intellectual disability, as well as occasionally autism along with other features.38, 39, 40 In van der Zwaag et al.41 the authors used knowledge on functional gene networks to perform a topology-corrected Prioritizer analysis42 and report the top ten genes out of 109 genes in the 2q linked region. LRP2 ranks first among these 109 genes with a p value of 0.007.
The cluster window maps to a region that includes four tandem epidermal growth factor (EGF) precursor homology domains, particularly the two most NH-terminal domains. This is just downstream of the domain that binds RAP, and the fact that there is evidence that BMP4 and RAP share binding sites in LRP235 suggests that alterations in the interaction of LRP2 with BMP4 caused by various mechanisms, including changes in protein levels or primary amino acid sequence, can lead to subtle changes in forebrain development, an area of great importance in autism-related phenotypes.
The original Faham et al.29 study concentrated on more common variants and only reported the association with variants in CMYA3, although an independent replication attempt failed at that time. There are only 13 variants observed in this gene, which makes a clustering analysis for this gene not meaningful.
Replication Datasets
We have used an independent dataset to replicate the finding on the risk-variant cluster within LRP2. Hence, we have applied the cluster-detection approach to a second dataset (ARRA-Broad; see Appendix A for more information) consisting of 430 cases and 379 controls sequenced in the exonic regions of LRP2. We have identified a 25 kb window of significant clustering resulting in a p value (adjusted for all 25 kb windows) of 0.038, and the window with the maximum LR statistic is 170,068,479–170,093,479. If only nonsynonymous variants are considered, the adjusted p value for all 25 kb windows is 0.02 and the p value adjusted for all overlapping windows with lengths between 5 and 30 kb is 0.01 (Table 4). The variants in this window, together with functional annotations and observed frequency counts in cases and controls, are shown in Table A7. Note that this window overlaps substantially with the window detected in the discovery dataset (i.e., 170,072,764–170,097,764; the Jaccard index of overlap is 0.71). In Figure 3, we plot for each window W of size 25 kb the corresponding values for the two datasets. There is substantial overlap between the windows of maximum LR score in the two datasets, although the signal is, as expected, stronger in the discovery dataset than in the replication dataset. Also, because of the smaller number of variants in the discovery dataset, the peak for the discovery dataset is also broader in that case.
Table A7.
LRP2 Variants in the 25 kb Window of Maximum LRW from the ARRA Broad Study
| Position | ID | fA | fU | refAA | varAA | Function |
|---|---|---|---|---|---|---|
| 170,068,479 | − | 0.0011 | 0 | Gln | Gln | silent |
| 170,068,502 | rs146149181 | 0.0023 | 0 | Thr | Ser | missense |
| 170,068,598 | rs138269726 | 0.0046 | 0 | Asp | Asn | missense |
| 170,068,628 | rs142266106 | 0 | 0.0013 | Ala | Thr | missense |
| 170,068,709 | − | 0.0011 | 0 | Glu | Lys | missense |
| 170,068,710 | rs144449508 | 0.0034 | 0.0013 | Ala | Ala | silent |
| 170,068,713 | rs34834388 | 0.039 | 0.025 | Ala | Ala | silent |
| 170,070,172 | rs4667596 | 0.017 | 0.022 | Arg | Lys | missense |
| 170,070,225 | − | 0.0011 | 0 | Lys | Lys | silent |
| 170,070,275 | − | 0.0011 | 0 | Glu | Gln | missense |
| 170,070,348 | rs11886219 | 0.051 | 0.050 | Arg | Arg | silent |
| 170,070,365 | rs41268689 | 0.0011 | 0 | Val | Met | missense |
| 170,072,797 | − | 0.0011 | 0 | Gln | Arg | missense |
| 170,077,014 | − | 0 | 0.0013 | Thr | Thr | silent |
| 170,082,013 | rs2075246 | 0.43 | 0.38 | − | − | − |
| 170,082,936 | rs138070797 | 0.0069 | 0.0013 | Asn | Ser | missense |
| 170,088,351 | rs2302694 | 0.104 | 0.106 | Ser | Ser | silent |
| 170,089,934 | rs145384264 | 0.020 | 0.011 | Ser | Ser | silent |
| 170,090,040 | − | 0.0011 | 0 | Arg | His | missense |
| 170,090,041 | − | 0.0011 | 0 | Arg | Cys | missense |
| 170,090,105 | − | 0 | 0.0013 | − | − | − |
| 170,090,139 | rs78750385 | 0.0069 | 0.0065 | − | − | − |
| 170,092,386 | − | 0 | 0.0013 | Asn | Lys | missense |
| 170,092,395 | rs2229267 | 0.26 | 0.21 | Cys | Cys | silent |
| 170,092,439 | rs151079411 | 0.0023 | 0.0013 | Leu | Leu | silent |
| 170,092,467 | rs141068435 | 0 | 0.0013 | Cys | Cys | silent |
| 170,092,504 | − | 0.0011 | 0 | Arg | His | missense |
| 170,092,613 | rs74457112 | 0.0011 | 0 | − | − | − |
If we perform an overall test of association at the gene level, variants in LRP2 are significantly associated with ASD (VT-test p value of 0.011). The combined VT-test p value based on the two datasets is 1.2 × 10⁻⁵. Restriction to only nonsynonymous variants did not result in significant results (probably as a result of the ensuing exclusion of common variants, some of which are associated with ASD as we show below). Also, there is no evidence of association in this dataset with variants in CMYA3.
Common Variant Analysis in LRP2
We have also tested for association between the common variants in LRP2 (MAF ≥ 0.05) and ASD by using the software package PLINK. Of 32 variants with MAF ≥ 0.05, ten of them have p values (Cochran-Armitage test) less than 0.05 (although they are not all independent signals), and all of them are in the same direction (Table A8). Compared with the unassociated variants, these associated variants are substantially closer to the enriched window above; all of the ten associated variants are within 10 kb of the 25 kb window identified above. In addition, we have performed a gene-based test in PLINK for the common variants, and the p value is 0.03.
Table A8.
p Values from the Cochran-Armitage Trend Test for the Common LRP2 Variants Significantlya Associated with ASD
| Chr | Position | fA | fU | p Trend | OR |
|---|---|---|---|---|---|
| 2 | 170,103,351 | 0.49 | 0.41 | 0.0007 | 1.40 |
| 2 | 170,099,895 | 0.49 | 0.42 | 0.0037 | 1.33 |
| 2 | 170,099,473 | 0.48 | 0.41 | 0.0040 | 1.33 |
| 2 | 170,099,899 | 0.48 | 0.41 | 0.0044 | 1.33 |
| 2 | 170,099,446 | 0.48 | 0.41 | 0.0045 | 1.33 |
| 2 | 170,103,336 | 0.48 | 0.41 | 0.0045 | 1.33 |
| 2 | 170,092,395 | 0.26 | 0.21 | 0.0084 | 1.33 |
| 2 | 170,096,018 | 0.33 | 0.27 | 0.011 | 1.31 |
| 2 | 170,115,588 | 0.49 | 0.43 | 0.014 | 1.27 |
| 2 | 170,066,022 | 0.20 | 0.17 | 0.045 | 1.29 |
The following abbreviations are used: Chr, chromosome; and OR, odds ratio.
p < 0.05.
Second Replication Dataset
We have used a second replication dataset (ARRA-Baylor; see Appendix A for more information) consisting of 502 cases and 489 controls. When the scanning window size w is 25 kb (as above), we find that the window of maximum LR score is 170,063,380–170,088,380, which again highly overlaps with the cluster windows in the previous two datasets (Figure 3). The p values for enrichment in this window compared with that in the rest of the gene are 0.015 (for all variants) and 0.010 (for nonsynonymous variants only). Although these p values are specific to that window and do not survive correction for multiple testing for all overlapping 25 kb windows (as was the case for the previous two datasets), the evidence of significant clustering in the same region adds to the evidence from the first two datasets. Results remain significant (p < 0.05) if other window sizes (between 5 and 30 kb) are considered as well.
Randomized Sampling
To show more evidence that the observed cluster windows in the three datasets are likely to represent bona fide regions enriched with rare DRVs, we have performed simple randomization experiments. In one example, cases and controls were randomly mixed and the cluster-detection method was then applied to the resulting datasets. As shown in Figure A1, the results are consistent with the null model of no clustering. In particular, the windows in which the maximum LR score is achieved for the three datasets are all disjoint. Similar results hold when cases and controls are completely interchanged.
Discussion
By using a scan-statistic approach, we have identified clusters of rare DRVs in LRP2, which resides in a replicated ASD linkage region within chromosomal region 2q31.1 and which we have also shown to be associated with ASD on the basis of two independent datasets. Our applications to three independent ASD datasets revealed three highly overlapping 25 kb LRP2 regions that are more significantly enriched with rare DRVs than is the rest of the gene.
Such a cluster-detection approach is ideal in cases where multiple rare DRVs cluster in a small region of a gene. When the gene under consideration is large, as is the case with LRP2, replication of association signals at the gene level can be challenging, and identification of such overlapping cluster regions can be important evidence of replicable signal. Furthermore, identifying such a cluster of genetic risk factors, when it exists, is important because it might provide insights into the underlying biological mechanism for the disease. The cluster region identified in our studies is involved in ligand binding. One mechanism that is consistent with the results is that subtle alterations in either LRP2 expression or LRP2 primary sequence modulate the uptake of LRP2 ligands. BMP4 is a ligand of particular interest given its role in forebrain development. Disruption of LRP2 has been shown to lead to excess levels of BMP4 and disrupted development of the prosencephalon. Even modest changes in BMP4 binding might subtly affect development and could lead to autism-associated phenotypes.
Some of the problems that affect association tests in general are also relevant for the cluster method discussed here. Like the burden tests of association, the proposed method assumes that the effects of variants are all in the same direction. In some cases, it is possible that a mixture of risk and protective variants is present in a region, especially if the region under consideration is large. Although it is probably less likely for this scenario to happen in a small cluster region that might correspond to a functional domain, when this happens, the power for identifying a cluster will decrease. Population stratification is also a potential concern for the proposed method. However, because the enrichment of rare disease variants in a window is contrasted with that outside of the window, the stratification would generate a clustering effect only if a small portion of the larger region were to be affected by population stratification.
The proposed cluster-detection method is designed specifically to identify small windows (within a larger region) that have significantly more rare DRVs than the rest of the region. As such, it is very different from existing association tests that test for association between variants in a contained genetic region and disease and which cannot, by definition, implicate clustering of rare disease variants in any part of the region under consideration. Therefore, the proposed method complements existing region-based association tests and can be useful in identifying the parts of a gene or region that are involved in disease etiology.
Acknowledgments
The research was partially supported by National Science Foundation grant DMS-1100279 and National Institutes of Health grants R01MH095797 and 1R03HG005908 to I.I.-L. and a Seaver Foundation grant and National Institutes of Health grant MH089025 to J.D.B. The lead investigators for the ARRA Autism Sequencing Consortium are the following: Eric Boerwinkle, Joseph D. Buxbaum, Edwin H. Cook, Jr., Mark J. Daly (communicating principal investigator), Bernie Devlin, Richard Gibbs, Kathryn Roeder, Aniko Sabo, Gerard D. Schellenberg, and James S. Sutcliffe. The full list of investigators is in the Supplemental Data.
Contributor Information
Iuliana Ionita-Laza, Email: ii2135@columbia.edu.
Joseph D. Buxbaum, Email: joseph.buxbaum@mssm.edu.
Appendix A: Data Generation and Processing for the AASC Data
The replication datasets have been sequenced as part of the ARRA Autism Sequencing Collaboration. Whole-exome sequencing of the samples was carried out at the Broad Institute and at the Baylor College of Medicine via standard approaches.
Sequence-data processing and variant calling were performed with similar workflows at both sites. Data were processed with Picard43 (see Web Resources) and BWA44 for mapping reads to hg19. Variants were called with the use of several approaches (including the Genome Analysis Toolkit45 and Atlas-SNP46), and only those variants that passed standard quality-control filters were analyzed.
Figure A1.
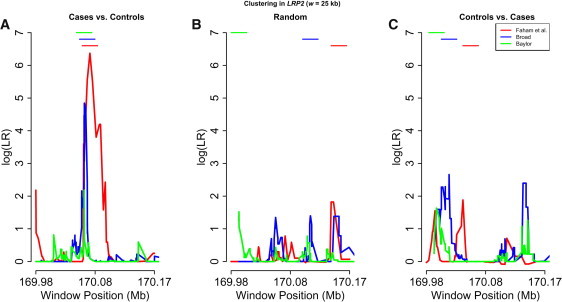
Clustering of Rare DRVs in LRP2 for Three Datasets
(A) Cases versus controls.
(B) Random mix of cases and controls.
(C) Controls versus cases.
Scanning window length is w = 25 kb. The 25 kb windows with maximum LR score are also shown for the three datasets.
Supplemental Data
Web Resources
The URLs for data presented herein are as follows:
Online Mendelian Inheritance in Man (OMIM), http://www.omim.org
Picard, http://picard.sourceforge.net/
References
- 1.Metzker M.L. Sequencing technologies - the next generation. Nat. Rev. Genet. 2010;11:31–46. doi: 10.1038/nrg2626. [DOI] [PubMed] [Google Scholar]
- 2.Li B., Leal S.M. Methods for detecting associations with rare variants for common diseases: Application to analysis of sequence data. Am. J. Hum. Genet. 2008;83:311–321. doi: 10.1016/j.ajhg.2008.06.024. [DOI] [PMC free article] [PubMed] [Google Scholar]
- 3.Madsen B.E., Browning S.R. A groupwise association test for rare mutations using a weighted sum statistic. PLoS Genet. 2009;5:e1000384. doi: 10.1371/journal.pgen.1000384. [DOI] [PMC free article] [PubMed] [Google Scholar]
- 4.Price A.L., Kryukov G.V., de Bakker P.I., Purcell S.M., Staples J., Wei L.J., Sunyaev S.R. Pooled association tests for rare variants in exon-resequencing studies. Am. J. Hum. Genet. 2010;86:832–838. doi: 10.1016/j.ajhg.2010.04.005. [DOI] [PMC free article] [PubMed] [Google Scholar]
- 5.Liu D.J., Leal S.M. A novel adaptive method for the analysis of next-generation sequencing data to detect complex trait associations with rare variants due to gene main effects and interactions. PLoS Genet. 2010;6:e1001156. doi: 10.1371/journal.pgen.1001156. [DOI] [PMC free article] [PubMed] [Google Scholar]
- 6.King C.R., Rathouz P.J., Nicolae D.L. An evolutionary framework for association testing in resequencing studies. PLoS Genet. 2010;6:e1001202. doi: 10.1371/journal.pgen.1001202. [DOI] [PMC free article] [PubMed] [Google Scholar]
- 7.Bhatia G., Bansal V., Harismendy O., Schork N.J., Topol E.J., Frazer K., Bafna V. A covering method for detecting genetic associations between rare variants and common phenotypes. PLoS Comput. Biol. 2010;6:e1000954. doi: 10.1371/journal.pcbi.1000954. [DOI] [PMC free article] [PubMed] [Google Scholar]
- 8.Han F., Pan W. A data-adaptive sum test for disease association with multiple common or rare variants. Hum. Hered. 2010;70:42–54. doi: 10.1159/000288704. [DOI] [PMC free article] [PubMed] [Google Scholar]
- 9.Ionita-Laza I., Buxbaum J.D., Laird N.M., Lange C. A new testing strategy to identify rare variants with either risk or protective effect on disease. PLoS Genet. 2011;7:e1001289. doi: 10.1371/journal.pgen.1001289. [DOI] [PMC free article] [PubMed] [Google Scholar]
- 10.Neale B.M., Rivas M.A., Voight B.F., Altshuler D., Devlin B., Orho-Melander M., Kathiresan S., Purcell S.M., Roeder K., Daly M.J. Testing for an unusual distribution of rare variants. PLoS Genet. 2011;7:e1001322. doi: 10.1371/journal.pgen.1001322. [DOI] [PMC free article] [PubMed] [Google Scholar]
- 11.Wu M.C., Lee S., Cai T., Li Y., Boehnke M., Lin X. Rare-variant association testing for sequencing data with the sequence kernel association test. Am. J. Hum. Genet. 2011;89:82–93. doi: 10.1016/j.ajhg.2011.05.029. [DOI] [PMC free article] [PubMed] [Google Scholar]
- 12.Lin D.Y., Tang Z.Z. A general framework for detecting disease associations with rare variants in sequencing studies. Am. J. Hum. Genet. 2011;89:354–367. doi: 10.1016/j.ajhg.2011.07.015. [DOI] [PMC free article] [PubMed] [Google Scholar]
- 13.Tzeng J.Y., Zhang D., Pongpanich M., Smith C., McCarthy M.I., Sale M.M., Worrall B.B., Hsu F.C., Thomas D.C., Sullivan P.F. Studying gene and gene-environment effects of uncommon and common variants on continuous traits: a marker-set approach using gene-trait similarity regression. Am. J. Hum. Genet. 2011;89:277–288. doi: 10.1016/j.ajhg.2011.07.007. [DOI] [PMC free article] [PubMed] [Google Scholar]
- 14.Naus J.I. The distribution of the size of the maximum cluster of points on a line. J. Am. Stat. Assoc. 1965;60:532–538. [Google Scholar]
- 15.Kulldorff M. A spatial scan statistic. Commun Stat Theory Methods. 1997;26:1481–1496. Published online June 27, 2007. [Google Scholar]
- 16.Robertson S.P., Twigg S.R., Sutherland-Smith A.J., Biancalana V., Gorlin R.J., Horn D., Kenwrick S.J., Kim C.A., Morava E., Newbury-Ecob R., OPD-spectrum Disorders Clinical Collaborative Group Localized mutations in the gene encoding the cytoskeletal protein filamin A cause diverse malformations in humans. Nat. Genet. 2003;33:487–491. doi: 10.1038/ng1119. [DOI] [PubMed] [Google Scholar]
- 17.Henderson D.M., Lee A., Ervasti J.M. Disease-causing missense mutations in actin binding domain 1 of dystrophin induce thermodynamic instability and protein aggregation. Proc. Natl. Acad. Sci. USA. 2010;107:9632–9637. doi: 10.1073/pnas.1001517107. [DOI] [PMC free article] [PubMed] [Google Scholar]
- 18.Laccone F., Huppke P., Hanefeld F., Meins M. Mutation spectrum in patients with Rett syndrome in the German population: Evidence of hot spot regions. Hum. Mutat. 2001;17:183–190. doi: 10.1002/humu.3. [DOI] [PubMed] [Google Scholar]
- 19.Bissler J.J., Cicardi M., Donaldson V.H., Gatenby P.A., Rosen F.S., Sheffer A.L., Davis A.E., 3rd A cluster of mutations within a short triplet repeat in the C1 inhibitor gene. Proc. Natl. Acad. Sci. USA. 1994;91:9622–9625. doi: 10.1073/pnas.91.20.9622. [DOI] [PMC free article] [PubMed] [Google Scholar]
- 20.Schneppenheim R., Michiels J.J., Obser T., Oyen F., Pieconka A., Schneppenheim S., Will K., Zieger B., Budde U. A cluster of mutations in the D3 domain of von Willebrand factor correlates with a distinct subgroup of von Willebrand disease: type 2A/IIE. Blood. 2010;115:4894–4901. doi: 10.1182/blood-2009-07-226324. [DOI] [PubMed] [Google Scholar]
- 21.Yue P., Forrest W.F., Kaminker J.S., Lohr S., Zhang Z., Cavet G. Inferring the functional effects of mutation through clusters of mutations in homologous proteins. Hum. Mutat. 2010;31:264–271. doi: 10.1002/humu.21194. [DOI] [PubMed] [Google Scholar]
- 22.Frank R.A., McRae A.F., Pocklington A.J., van de Lagemaat L.N., Navarro P., Croning M.D., Komiyama N.H., Bradley S.J., Challiss R.A., Armstrong J.D. Clustered coding variants in the glutamate receptor complexes of individuals with schizophrenia and bipolar disorder. PLoS ONE. 2011;6:e19011. doi: 10.1371/journal.pone.0019011. [DOI] [PMC free article] [PubMed] [Google Scholar]
- 23.Buxbaum J.D., Silverman J.M., Smith C.J., Kilifarski M., Reichert J., Hollander E., Lawlor B.A., Fitzgerald M., Greenberg D.A., Davis K.L. Evidence for a susceptibility gene for autism on chromosome 2 and for genetic heterogeneity. Am. J. Hum. Genet. 2001;68:1514–1520. doi: 10.1086/320588. [DOI] [PMC free article] [PubMed] [Google Scholar]
- 24.Shao Y., Raiford K.L., Wolpert C.M., Cope H.A., Ravan S.A., Ashley-Koch A.A., Abramson R.K., Wright H.H., DeLong R.G., Gilbert J.R. Phenotypic homogeneity provides increased support for linkage on chromosome 2 in autistic disorder. Am. J. Hum. Genet. 2002;70:1058–1061. doi: 10.1086/339765. [DOI] [PMC free article] [PubMed] [Google Scholar]
- 25.Szatmari P., Paterson A.D., Zwaigenbaum L., Roberts W., Brian J., Liu X.Q., Vincent J.B., Skaug J.L., Thompson A.P., Senman L., Autism Genome Project Consortium Mapping autism risk loci using genetic linkage and chromosomal rearrangements. Nat. Genet. 2007;39:319–328. doi: 10.1038/ng1985. [DOI] [PMC free article] [PubMed] [Google Scholar]
- 26.Wallenstein S., Neff N. An approximation for the distribution of the scan statistic. Stat. Med. 1987;6:197–207. doi: 10.1002/sim.4780060212. [DOI] [PubMed] [Google Scholar]
- 27.Davies R.B. Hypothesis testing when a nuisance parameter is present only under the alternative. Biometrika. 1977;64:247–254. doi: 10.1111/j.0006-341X.2005.030531.x. [DOI] [PubMed] [Google Scholar]
- 28.Schaffner S.F., Foo C., Gabriel S., Reich D., Daly M.J., Altshuler D. Calibrating a coalescent simulation of human genome sequence variation. Genome Res. 2005;15:1576–1583. doi: 10.1101/gr.3709305. [DOI] [PMC free article] [PubMed] [Google Scholar]
- 29.Faham M., Zheng J., Moorhead M., Fakhrai-Rad H., Namsaraev E., Wong K., Wang Z., Chow S.G., Lee L., Suyenaga K. Multiplexed variation scanning for 1,000 amplicons in hundreds of patients using mismatch repair detection (MRD) on tag arrays. Proc. Natl. Acad. Sci. USA. 2005;102:14717–14722. doi: 10.1073/pnas.0506677102. [DOI] [PMC free article] [PubMed] [Google Scholar]
- 30.May P., Woldt E., Matz R.L., Boucher P. The LDL receptor-related protein (LRP) family: An old family of proteins with new physiological functions. Ann. Med. 2007;39:219–228. doi: 10.1080/07853890701214881. [DOI] [PubMed] [Google Scholar]
- 31.Iossifov I., Ronemus M., Levy D., Wang Z., Hakker I., Rosenbaum J., Yamrom B., Lee Y., Narzisi G., Leotta A. De Novo Gene Disruptions in Children on the Autistic Spectrum. Neuron. 2012;74:285–299. doi: 10.1016/j.neuron.2012.04.009. [DOI] [PMC free article] [PubMed] [Google Scholar]
- 32.Kantarci S., Al-Gazali L., Hill R.S., Donnai D., Black G.C., Bieth E., Chassaing N., Lacombe D., Devriendt K., Teebi A. Mutations in LRP2, which encodes the multiligand receptor megalin, cause Donnai-Barrow and facio-oculo-acoustico-renal syndromes. Nat. Genet. 2007;39:957–959. doi: 10.1038/ng2063. [DOI] [PMC free article] [PubMed] [Google Scholar]
- 33.Zarbalis K., May S.R., Shen Y., Ekker M., Rubenstein J.L., Peterson A.S. A focused and efficient genetic screening strategy in the mouse: Identification of mutations that disrupt cortical development. PLoS Biol. 2004;2:E219. doi: 10.1371/journal.pbio.0020219. [DOI] [PMC free article] [PubMed] [Google Scholar]
- 34.Willnow T.E., Armstrong S.A., Hammer R.E., Herz J. Functional expression of low density lipoprotein receptor-related protein is controlled by receptor-associated protein in vivo. Proc. Natl. Acad. Sci. USA. 1995;92:4537–4541. doi: 10.1073/pnas.92.10.4537. [DOI] [PMC free article] [PubMed] [Google Scholar]
- 35.Spoelgen R., Hammes A., Anzenberger U., Zechner D., Andersen O.M., Jerchow B., Willnow T.E. LRP2/megalin is required for patterning of the ventral telencephalon. Development. 2005;132:405–414. doi: 10.1242/dev.01580. [DOI] [PubMed] [Google Scholar]
- 36.Gajera C.R., Emich H., Lioubinski O., Christ A., Beckervordersandforth-Bonk R., Yoshikawa K., Bachmann S., Christensen E.I., Götz M., Kempermann G. LRP2 in ependymal cells regulates BMP signaling in the adult neurogenic niche. J. Cell Sci. 2010;123:1922–1930. doi: 10.1242/jcs.065912. [DOI] [PubMed] [Google Scholar]
- 37.Christ A., Christa A., Kur E., Lioubinski O., Bachmann S., Willnow T.E., Hammes A. LRP2 is an auxiliary SHH receptor required to condition the forebrain ventral midline for inductive signals. Dev. Cell. 2012;22:268–278. doi: 10.1016/j.devcel.2011.11.023. [DOI] [PubMed] [Google Scholar]
- 38.Joshi P.S., Deshmukh V., Golgire S. Gorlin-Goltz syndrome. Dent Res J (Isfahan) 2012;9:100–106. doi: 10.4103/1735-3327.92963. [DOI] [PMC free article] [PubMed] [Google Scholar]
- 39.Derwińska K., Smyk M., Cooper M.L., Bader P., Cheung S.W., Stankiewicz P. PTCH1 duplication in a family with microcephaly and mild developmental delay. Eur. J. Hum. Genet. 2009;17:267–271. doi: 10.1038/ejhg.2008.176. [DOI] [PMC free article] [PubMed] [Google Scholar]
- 40.Muller E.A., Aradhya S., Atkin J.F., Carmany E.P., Elliott A.M., Chudley A.E., Clark R.D., Everman D.B., Garner S., Hall B.D. Microdeletion 9q22.3 syndrome includes metopic craniosynostosis, hydrocephalus, macrosomia, and developmental delay. Am. J. Med. Genet. A. 2012;158A:391–399. doi: 10.1002/ajmg.a.34216. [DOI] [PubMed] [Google Scholar]
- 41.van der Zwaag B., Franke L., Poot M., Hochstenbach R., Spierenburg H.A., Vorstman J.A., van Daalen E., de Jonge M.V., Verbeek N.E., Brilstra E.H. Gene-network analysis identifies susceptibility genes related to glycobiology in autism. PLoS ONE. 2009;4:e5324. doi: 10.1371/journal.pone.0005324. [DOI] [PMC free article] [PubMed] [Google Scholar]
- 42.Franke L., van Bakel H., Fokkens L., de Jong E.D., Egmont-Petersen M., Wijmenga C. Reconstruction of a functional human gene network, with an application for prioritizing positional candidate genes. Am. J. Hum. Genet. 2006;78:1011–1025. doi: 10.1086/504300. [DOI] [PMC free article] [PubMed] [Google Scholar]
- 43.DePristo M.A., Banks E., Poplin R., Garimella K.V., Maguire J.R., Hartl C., Philippakis A.A., del Angel G., Rivas M.A., Hanna M. A framework for variation discovery and genotyping using next-generation DNA sequencing data. Nat. Genet. 2011;43:491–498. doi: 10.1038/ng.806. [DOI] [PMC free article] [PubMed] [Google Scholar]
- 44.Li H., Durbin R. Fast and accurate long-read alignment with Burrows-Wheeler transform. Bioinformatics. 2010;26:589–595. doi: 10.1093/bioinformatics/btp698. [DOI] [PMC free article] [PubMed] [Google Scholar]
- 45.McKenna A., Hanna M., Banks E., Sivachenko A., Cibulskis K., Kernytsky A., Garimella K., Altshuler D., Gabriel S., Daly M., DePristo M.A. The Genome Analysis Toolkit: A MapReduce framework for analyzing next-generation DNA sequencing data. Genome Res. 2010;20:1297–1303. doi: 10.1101/gr.107524.110. [DOI] [PMC free article] [PubMed] [Google Scholar]
- 46.Shen Y., Wan Z., Coarfa C., Drabek R., Chen L., Ostrowski E.A., Liu Y., Weinstock G.M., Wheeler D.A., Gibbs R.A., Yu F. A SNP discovery method to assess variant allele probability from next-generation resequencing data. Genome Res. 2010;20:273–280. doi: 10.1101/gr.096388.109. [DOI] [PMC free article] [PubMed] [Google Scholar]
Associated Data
This section collects any data citations, data availability statements, or supplementary materials included in this article.