

Abstract
Genome-wide association studies have identified hundreds of common genetic variants associated with the risk of multifactorial diseases. However, their impact on discrimination and risk prediction is limited. It has been suggested that the identification of gene-gene (G-G) and gene-environment (G-E) interactions would improve disease prediction and facilitate prevention. We conducted a simulation study to explore the potential improvement in discrimination if G-G and G-E interactions exist and are known. We used three diseases (breast cancer, type 2 diabetes, and rheumatoid arthritis) as motivating examples. We show that the inclusion of G-G and G-E interaction effects in risk-prediction models is unlikely to dramatically improve the discrimination ability of these models.
Introduction
Genome-wide association studies (GWASs) have discovered hundreds of common genetic variants associated with multifactorial diseases. These variants can be added to classical clinical and environmental risk factors for the improvement of risk-prediction assessment. However, for most common diseases, the addition of genetic variants to traditional risk factors has produced only modest improvements.1–9 The subsequent genetic-risk profiles generated are still unlikely to provide sufficient discrimination to warrant individualized prevention except when the risks and costs associated with preventive interventions are low (but not so low that the benefits of intervention outweigh the costs for every individual).10–12 It has been suggested that the identification of statistical interaction between genetic variants (G-G) or interaction between genetic variants and environmental risk factors (G-E) would improve the predictive accuracy of risk models and facilitate prevention.2,12–14
We explored the potential improvement in the discrimination of genetic-risk models for common complex diseases by using common markers and common exposures after incorporating G-G and G-E interactions. We considered the scenario in which multiple statistical interactions between common exposures and common risk markers exist and are known. We also allowed for the possibility that some genetic markers might be involved in G-G and G-E interactions yet have no marginal association with disease; hence, they would not have been detected with the standard one-marker-at-a-time GWAS approach. This is arguably a best-case scenario because few replicated interactions between common genetic markers and other genetic and environmental factors have been identified to date;15–18 also, after potential interactions are allowed for, very few novel markers that have undetectable marginal effect but that show evidence of association have been identified.19
Because the effectiveness of genetic-risk models will vary across diseases with different genetic architectures (defined by the number of associated loci and the distribution of the effect magnitude across loci), we considered three different hypothetical architectures motivated by breast cancer (BRCA, [MIM 114480]), type 2 diabetes (T2D, [MIM 125853]) and rheumatoid arthritis (RA, [MIM 180300]). We generated a broad range of hypothetical G-G and G-E interaction effects for each disease and constrained these models to be consistent with reported marginal effects for known genetic, clinical, and environmental risk factors. We then estimated the increase in discrimination ability of risk models that include the interactions and compared it to that of models that do not include the interactions.
Material and Methods
Simulation Scheme
We simulated hypothetical models in which the disease status was defined as a function of the marginal effects of known genetic and nongenetic risk factors (see Appendix A) and a random number of two-way G-G and G-E interaction effects. The interactions were defined such that the marginal effects of the known risk factors reflect the previously reported effect regardless of the number and the magnitude of the interactions that were simulated. We studied models in which statistical interactions exist only between the known risk factors as well as models in which statistical interactions exist between the known risk factors and unknown risk SNPs that have no marginal effect. In each scenario, we generated 1,000 replicates of 100,000 women for whom the genotypes of the known SNPs and environmental risk were simulated independently, and we generated disease status by assuming a prevalence of 10% for BRCA, 9% for T2D, and 2% for RA.
The probability of disease given genotypes and exposures (penetrance) was generated with a constrained log-linear model:20
| (Equation 1) |
Here, βj and σl are the marginal effects of SNP Gi and exposure El, respectively; γj,k and γl,m are the interaction effects between SNPs j and k and between the exposure El and SNP Gm, respectively. Ijk and Ilm represent the presence (when equal to 1) or absence (when equal to 0) of interaction between Gj and Gk and between El and Gm, respectively. A is population-average log penetrance. Gj is the weight for the genetic main effect, Ei is the weight for the environmental main effect, wj,k, is the weight of the interaction between SNPs j and k, and wl,m is the weight of the interaction between exposure El and SNP Gm (Appendix B). These weights are chosen so that the marginal effect of SNP j—that is, the difference in the log penetrance averaged over other genes and exposures between subjects carrying one versus zero (or two versus one) copies of the minor allele for SNP j—equals βj and so that the marginal effect of exposure l is σl. In particular, the expected effect of each interaction term is equal to 0 within strata defined by either of the following interacting factors:
This model is identical to the model generated by the commonly used parameterization
| (Equation 2) |
where Gj∗ is the count of minor alleles for SNP j and El∗ is an indicator variable for whether a subject is exposed (Appendix B). Moreover, the interaction parameters γ∗,∗ in Equations 1 and 2 are equivalent and have the same interpretation. We chose Equation 1 over Equation 2 because of the equivalence between the marginal effects and the parameters βj and σl. This allowed us to easily constrain the simulated models to have locus-specific marginal effects and exposure marginal effects similar to those observed empirically. The simulated models cover a wide range of interaction patterns, including classical supermultiplicative and submultiplicative effects and more exotic models close to those described by Evans et al.21
We varied the number of pairwise interactions from one to five G-G and one to five G-E effects. The interaction effects γj,k and γl,m were sampled from a normal distribution such that |γ| < ln(2) with 95% probability. We chose the range of interaction odds ratios to be consistent with (1) reported G-E interaction odds ratios, which are mostly smaller than 2.5;22–27(2) the lack of consistently replicated large G-G and G-E interactions involving common variants; and (3) the magnitude of the marginal effects seen in GWASs. Depending on the scenario we considered, the SNPs noted with subscripts k and m represent either some of the known risk SNPs or some hypothetical unidentified risk SNPs that have no marginal effect.
(We recognize that some of the “environmental” risk factors that we have chosen—e.g. body mass index (BMI) or family history of disease—are endogenous factors that might themselves be under genetic influence or correlated with the risk alleles. Our simulation model assumes that the risk alleles are not correlated with the environmental risk factors and that any loci influencing the “environmental” risk factors have no unmediated influence on disease risk. This would be the case for many exogenous exposures that are not correlated with genotypes at the disease susceptibility loci or for loci whose effect is solely mediated through the endogenous environment, as might be the case for FTO, BMI, and T2D. We did not explore situations in which loci influencing the “environmental” risk factors also have an unmediated influence on disease given that for most complex diseases, the overlap between currently known risk loci and loci associated with “environmental” risk factors is small. We stress that our simulations focus on the best-case scenario in which the penetrance model is known; in particular, markers that have no effect on disease risk conditional on the “environmental” exposure are not included in the penetrance model, and all relevant endogenous exposures are included in the penetrance model.).
Estimation of Improvement in Risk Prediction
The improvement in discrimination ability was calculated as the difference in the area under the receiver operating characteristic curve (AUC), also called the C-statistic, between the model that includes only the marginal effect of the known risk factors and the model that includes the main effects of risk factors and the simulated interaction effects. The improvement in estimation of absolute risk was assessed by the continuous net reclassification index (cNRI)28 before and after the addition of the interaction effects. The cNRI quantifies the proportion of individuals who have improved absolute-risk estimates (i.e., cases that tend to have a higher absolute risk and controls that tend to have a smaller absolute risk), although the cNRI does not consider the magnitude of the changes in risk estimates. Unlike the net reclassification index (NRI),29 the cNRI does not require the specification of risk categories and thus allows for direct comparison across different diseases. It is defined as follows:
where Pr(event) and Pr(nonevent) are the probabilities of being a case or a control, respectively, and Pr(down) and Pr(up) are the probabilities of having lower or higher risk estimates, respectively, after the addition of interaction effects in the model. The cNRI and AUC are independent of disease prevalence, allowing these measures to be directly compared across diseases.
Results
Disease Models and Marginal Risk Prediction
For the BRCA risk model, we included 15 common SNPs with marginal relative risks (RRs) ranging from 1.07 to 1.28 and risk-allele frequencies ranging from 0.15 to 0.85 (Table S1, available online). Four of the five components of the Gail model 30 were added; these were age at menarche, the number of previous breast biopsies, age at first child, and the number of first-degree relatives who have developed BRCA (age < 50 was not taken into account because we considered a situation in which all women were older than 50). We modeled the joint frequencies of these risk factors by using their empirical distribution in the Nurses' Health Study (NHS) (see Material and Methods and Table S2). For T2D, we included 31 SNPs and four clinical risk factors. The marginal allelic RRs of the SNPs ranged from 1.09 to 1.40, and risk-allele frequencies were between 0.10 and 0.93 (Table S3). The clinical risk factors were obesity (BMI ≥ 30), smoking status, physical activity, and family history of T2D. We used the NHS to model the joint frequency of these factors (Table S4). With a RR of 5.1 and a frequency of 0.25, obesity was the strongest risk factor of T2D. The three others have RRs between 1.11 and 3.03 and frequencies between 0.16 and 0.56. The RA model included 31 SNPs with RRs ranging from 1.02 to 1.75 and risk-allele frequencies ranging from 0.08 to 0.90 (Table S5). Other than the 31 common GWAS-identified SNPs, we included eight HLA-DRB alleles. The largest effect was for DRB∗0401, which has a frequency of 0.09 for a RR of 3.30, whereas the other variants had either a low frequency or a low RR. For ease of computation, all HLA risk alleles were merged into a single variant that had an average RR of 2.33 for a frequency of 0.24. We included only two nongenetic risk factors, smoking and breast feeding, which have RRs equal to 1.69 and 0.79, respectively. The frequencies of these risk factors were also taken from the NHS (Table S6).
For each disease, we generated 1,000 replicates of 100,000 women and assigned them a disease status on the basis of the effects described above. To provide a benchmark for later simulations, we initially assumed that there were no G-G or G-E interactions. The smallest discrimination ability as estimated by our simulation was observed for the BRCA model: the average AUC for the model that combined genetic and nongenetic factors was 0.616 (standard deviation [SD] = 0.010). Conversely, T2D had the highest discrimination ability—it had an AUC of 0.786 (SD = 0.006) for the combined model. The AUC for RA was 0.704 (SD = 0.008) and was driven by its genetic component, which was proportionally much higher than that of the two other models. Overall, the AUCs of the genetic, nongenetic, and combined models obtained by simulation (Table 1) were in agreement with the AUCs reported on real data in the literature (see Appendix B).
Table 1.
Expected Discrimination Ability for BRCA, RA, and T2D Based on Reported Estimated Effect of Genetic and Nongenetic Risk Factors
| Disease |
AUC (SD) |
Sensitivity by Specificitya(SD) |
||||
|---|---|---|---|---|---|---|
| Genetic Model | Nongenetic Model | Combined Model | Genetic Model | Nongenetic Model | Combined Model | |
| BRCA | 0.591 (0.008) | 0.558 (0.008) | 0.616 (0.010) | 0.023 (0.005) | 0.017 (0.004) | 0.033 (0.010) |
| RAb | 0.687 (0.007) | 0.571 (0.009) | 0.704 (0.008) | 0.055 (0.007) | 0.014 (0.004) | 0.066 (0.009) |
| T2D | 0.623 (0.009) | 0.754 (0.007) | 0.786 (0.006) | 0.030 (0.005) | 0.088 (0.007) | 0.122 (0.012) |
The following abbreviations are used: AUC, area under the receiver operating characteristic curve; SD, standard deviation; BRCA, breast cancer; RA, rheumatoid arthritis; and T2D, type 2 diabetes.
For a specificity threshold of 0.99.
RA genetic model and combined model include both SNPs and HLA variants.
Increase in Discrimination if G-G and G-E Interactions Exist between Known Risk Factors
We added between two and ten G-G and G-E interaction effects to the simulation models so that the final marginal effects of known genetic risk variants and clinical and environmental risk factors were equal to their previously reported effects (see Material and Methods and Appendix B). We compared the models that included the simulated interactions with models that included only the marginal effects (referred to hereafter as “marginal models”) in terms of their ability to discriminate and appropriately reclassify cases and controls.
The addition of interaction effects to the risk model improved the performance of genetic-risk-prediction models, although the improvement as measured by AUC and cNRI was modest. (Because we simulated a large cohort, the improvement in model fit was almost always statistically significant [the median likelihood-ratio p value ≈ 10−23] whether measured by the differences in the log likelihood or changes in AUC or cNRI. Our focus is on the magnitude of these differences.) The cNRI increased linearly with the number (Figure 1) and the magnitude (Figure 2) of the simulated interactions. The average cNRI over all simulations was similar across all three disease models: 0.230 (SD = 0.096), 0.210 (SD = 0.092), and 0.200 (SD = 0.096) for BRCA, RA, and T2D, respectively. The contribution of controls to the cNRI was slightly higher than the contribution of cases. Approximately 54% of cases had higher risk estimates after interactions were incorporated, whereas 56% of controls had lower estimates. The highest cNRI was observed when ten interactions were simulated (0.312 [SD = 0.083], 0.305 [SD = 0.085], and 0.286 [SD = 0.074] for BRCA, RA, and T2D, respectively); the proportions of cases and controls that had improved risk estimates in this situation were 57% and 59%, respectively.
Figure 1.
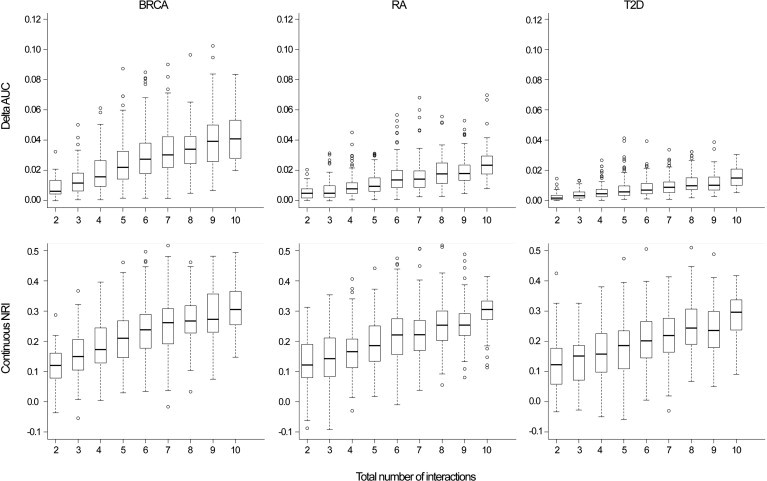
Absolute Increase in AUC and cNRI by the Number of Interactions Simulated
Breast cancer (BRCA), rheumatoid arthritis (RA), and type 2 diabetes (T2D).
Figure 2.
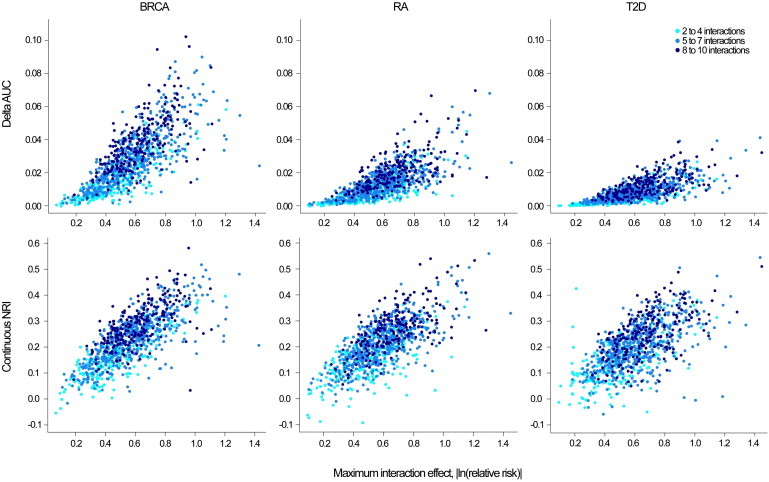
Absolute Increase in AUC and cNRI by the Maximum Interaction Effect Simulated
Breast cancer (BRCA), rheumatoid arthritis (RA), and type 2 diabetes (T2D).
The improvement in discrimination ability as measured by the AUC differed by risk model (Figures 1 and 2). The average absolute increase in AUC was 2.82% (SD = 1.74), 1.40% (SD = 1.00), and 0.85% (SD = 0.63) for BRCA, RA, and T2D, respectively. These differences reflect the increasing difficulty in producing the same absolute change in AUC as the baseline AUC increases. The increase in the difference in mean predicted risk between cases and controls after the addition of interactions was similar for all three disease models; however, the variance of predicted values of cases and controls was higher for models with a higher baseline AUC, resulting in a lower increase in the AUC of these models.31
We limited the magnitude of the interaction in the simulations presented in Figures 1, 2, and 4 to relatively small effects (0.5 < RRinteraction < 2 with 95% chances) given that few larger interaction effects involving known risk factors for complex diseases have been detected by large-scale studies conducted on humans to date. In Figure S1, we explore the impact of larger interaction effects (relative risk up to 10) and a larger number of interactions (up to 20, including interactions with SNPs that have no marginal effect). The improvement in AUC increased with increasing interaction effect; the magnitude of this increase again differed by disease. For example, for 4–20 interactions, the average absolute improvement in AUC for 0.2 < RRinteraction < 5 was equal to 13.79% (SD = 4.64), 8.21% (SD = 3.19), and 5.35% (SD = 2.37) for BRCA, RA, and T2D, respectively.
Figure 4.
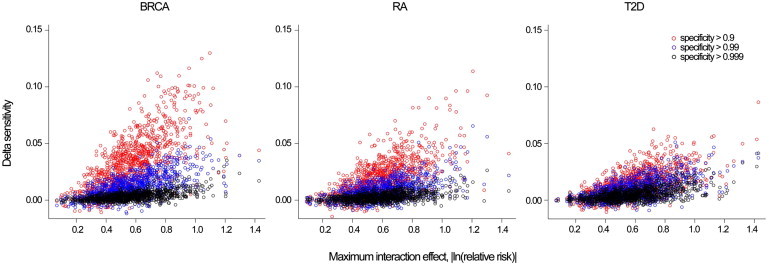
Absolute Increase in Sensitivity by Maximum Interaction Effect and Specify Threshold
Breast cancer (BRCA), rheumatoid arthritis (RA), and type 2 diabetes (T2D).
Increase in Discrimination if Interactions Exist between Known Risk Factors and SNPs with No Marginal Effect
We estimated the improvement when interactions between known risk factors and SNPs that have no marginal effect might also exist. We reconducted the same simulations but replaced the known SNPs with SNPs that we generated to have risk-allele frequencies in the interval [0.05, 0.95] and no marginal effect on the diseases studied. These simulations show similar results to the previous scenario, but the improvement was, on average, slightly lower when compared with the model that included interaction between known risk factors only. The average absolute improvement in AUC was equal to 2.32% (SD = 1.46), 1.10% (SD = 0.69), and 0.76% (SD = 0.56) for BRCA, RA, and T2D, respectively; when interactions only involved known risk SNPs, the average absolute improvement in AUC was 2.82%, 1.40%, and 0.85% for BRCA, RA, and T2D, respectively.
Number of Interactions versus Size of the Interaction
We further investigated whether model improvement was more sensitive to the size of the interaction effects (as measured by the log-interaction RR denoted as γ) or to the number of interactions. We compared two additional models. In the first, we fixed the number of interactions at ten and limited the size of the interactions (|γ| < ln(1.2) with 95% probability); in the second, we fixed the number of interactions at two and simulated only medium-to-strong interactions (ln(1.5) < |γ| < ln(2) with 95% probability). The comparison of the increase in AUC between these two models for each of the diseases when 1,000 series of each model were simulated is presented in Figure 3. For all models, the magnitude of interaction leads to a slightly better AUC improvement than does the number of interactions. As before, the increase in AUC decreased as the discrimination of the marginal model increased, and the highest difference was observed for BRCA. For this model, the absolute increase in AUC was on average 2.32% (SD = 0.93) for two strong interactions and 0.63% (SD = 0.30) for ten low interactions. For RA, the increases for two and ten interactions were, respectively, 1.00% (SD = 0.44) and 0.64% (SD = 0.31); for T2D, the increases were 0.27% (SD = 0.14) and 0.15% (SD = 0.08), respectively.
Figure 3.
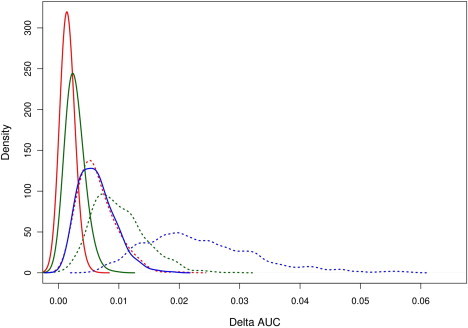
Comparison of Increase in AUC between Models that Include a Low Number of Strong-Interaction Effects with Models that Include a Large Number of Low-Interaction Effects
We compared the absolute increase in AUC between models that include two strong interactions (dashed line) and models that include ten low interactions (solid line) for BRCA (blue), RA (green), and T2D (red). Probability density functions were estimated from 1,000 simulations for each scenario.
Impact on Public Health and Clinical Utility
Interpreting the AUC and cNRI can be difficult in terms of public-health impact because they do not consider different benefits and costs associated with true, false-positive, and negative results.32 Other measures can be used depending on context.33–35 Here, we consider sensitivity for a fixed specificity threshold, which corresponds to a single point on the receiver operating characteristic (ROC) curve. This measure is relevant when a driving consideration is the control of false-positive test results, such as in the case of a population-screening program in which the intervention that follows a positive test for a rare disease carries substantial risk. The sensitivity increase due to the inclusion of interactions for different specificity thresholds is presented in Figure 4. The average absolute increase in sensitivity (the percentage of cases above the risk threshold) was below 0.01 for all disease models at a high level of specificity (≥0.99), whereas for lower specificity thresholds (≥0.90), the improvement was moderate: 0.033 (SD = 0.001), 0.019 (SD = 0.000), and 0.014 (SD = 0.000) for BRCA, RA, and T2D, respectively. This suggests that there might be modest sensitivity gains for intermediate risk thresholds with higher false-positive proportions (>10%), but the gains for high risk thresholds with small false-positive proportions (<1%) might be low.
Discussion
Although multiple biologic interactions among GWAS-identified risk loci and clinical risk factors are likely to contribute to the etiology of many common diseases, this study suggests that the identification of statistical interactions among these factors might have a modest impact on risk prediction and discrimination for common complex diseases. Moreover, the improvement in risk prediction was estimated in this study in a best-case scenario in which the true main effect and interaction effect are known and are homogeneous across all individuals (this might not be the case in practice). The discriminatory and predictive accuracy of any model trained in a finite (and perhaps relatively small) dataset will be diminished as a result of model-selection uncertainty (e.g., incorrectly excluding or including true risk factors or interactions) and variability in parameter estimates. Our quantitative results are in agreement with the claim made by Gail2 that G-G interactions might have a low effect on discrimination accuracy.
The evidence to date suggests that strong pairwise-interaction effects (e.g., RR > 2) between known risk SNPs and classical clinical risk factors are unlikely to be common for complex diseases. For example, three large studies of interactions among GWAS-identified BRCA markers and established risk factors failed to find any compelling evidence for interaction despite having greater than 90% power for the detection of interaction RR as low as 1.06,15,18,36 and there are few validated interactions among established genetic or dietary risk factors for T2D.37 We chose the distribution of the magnitude of simulated interaction effects to be consistent with these equivocal results.
The paucity of replicated statistical G-G and G-E interactions from observational studies in humans contrasts with the rich literature on these interactions in experimental and free-living model organisms.38,39 A number of factors might contribute to this contrast, and these include (but are not limited to) low power for the detection of statistical interactions as a result of the tagging-SNP approach adopted by GWASs and many candidate-gene studies,40 limited genetic and environmental diversity in the human studies to date,41,42 or the actual absence of detectable statistical interactions in many human populations. Our extended simulations show that the inclusion of many interactions (>10) with modest to large effects (interaction odds ratios >2) might meaningfully increase model discrimination. It remains an open empirical question whether such interactions exist.
Large pairwise or higher-order interaction effects involving rare causal variants, rare exposures, or rare allelic combinations of common risk variants might exist but were outside of the scope of this study. Pharmacogenetics is one setting in which large interactions have been observed.43,44 The odds ratio for adverse drug reactions for some variants can be relatively large (well over 5), and, considering that the adverse reaction is typically not present among those who do not receive the drug, the gene-drug interaction odds ratio can be thought of as infinite. However, our focus was on risk screening in the general population, not on tailoring therapy.
Large interactions involving rare exposures or rare alleles might help identify individuals who are at particularly high risk, but because they are rare and the prior probability for particular interactions will often be low, reliably identifying them will be difficult. The impact of a strategy that focuses on high-risk individuals might offer substantial benefits for those individuals. However, because most cases arise among the many at lower risk rather than among the few who are at high risk, the potential impact on the total burden of disease in the population might be limited.45
There are many measures that can be used for summarizing the clinical and public-health utility of risk-prediction models.33,46 We used the AUC. Other measures such as risk-reclassification tables or the NRI can be used;29 however, a recent study by Mihaescu et al. has shown that these reclassification measures increase as the AUC increases.47 Most reclassification measurements depend on risk thresholds that place individuals into risk categories; different thresholds yield different measures and can change the relative ranking of risk-prediction models. Consequently, we used the cNRI, which is a threshold-free reclassification tool. The cNRI simply measures the proportion of individuals who have better risk estimates (cases whose predicted risk increases after the inclusion of interactions and controls whose predicted risk decreases) without quantifying the magnitude of the change in risk estimates. Finally, we also considered the increase in sensitivity for high-specificity thresholds, a more interpretable measure for public-health recommendation. The inclusion of G-G and G-E interactions did not dramatically improve any of these measures.
The identification of G-G and G-E interactions remains of major interest because it can provide important clues regarding the biological mechanism of many common complex diseases.48–50 However, indentifying replicable statistical interactions between common genetic and nongenetic risk factors is a very challenging task. Such interactions might only modestly improve risk models designed for use in the general population (such the Gail score or the Framingham risk score). Whether such modest improvements are clinically important will depend on context. Our results suggest that the improvement of risk-prediction models (as measured by the change in average sensitivity) with the use of risk factors with modest effects primarily depends on the number of risk factors included in the model; including nonlinear terms generally provides little improvement. This suggests that identifying new risk loci and new environmental risk factors might lead to greater improvements in risk modeling than incorporating interactions among known risk factors. We note, however, that G-G and G-E interactions can be leveraged for the identification of new risk loci and new modifiable environmental risk factors.19,50–54 Finally, we stress that although G-G and G-E interactions might have modest impacts on risk prediction, an understanding of the interplay between genes and the environment can provide insights into disease etiology; this understanding, in turn, can lead to improved treatment and prevention strategies.
Acknowledgments
This study was supported by grants R21 DK084529, 2P01CA87969-11, AR049880, and P60 AR047782 and by the Fondation Bettencourt Schueller.
Appendix A
The BRCA risk model included SNPs that GWASs have found to be associated with BRCA at highly stringent levels of statistical significance in populations of European ancestry and that were confirmed in at least one independent set of cases and controls (Table S1). On the basis of the catalog of published GWASs,55 we identified 12 SNPs that match these criteria at the time we were conducting this study. We also considered three additional SNPs that match similar criteria but that have been identified in post-GWAS analysis involving multiple independent populations. We added these 15 SNPs to the model that we simulated by using their previously reported estimated marginal effects. We simulated these SNPs by using the frequencies obtained from the HapMap CEU56 (Utah residents with northern and Western European ancestry from the CEPH collection) samples and the reported per-allele RRs from discovery studies. We combined these SNPs with the four components of the Gail score for women older than 50; these components were age at menarche, age at first child, number of first-degree relatives with BRCA, and the number of previous breast biopsies (Table S2). The odd ratios of these risk factors were extracted from Gail et al.30 The frequencies were taken from 1,142 control samples from a BRCA case-control study nested within the NHS.57
The T2D risk model included loci that have been found to be associated with T2D at highly stringent levels of statistical significance; these loci were identified or replicated by the Diabetes Genetics Replication and Meta-Analysis (DIAGRAM) consortium, a widespread collaboration that studies populations of European descent (the most recent report includes 42,542 case subjects with T2D and 98,912 control subjects). We used the most significant SNPs of each loci from the DIAGRAM consortium and the corresponding reported estimated effects, and we used frequencies extracted from the HapMap CEU56 (Table S3) samples. We considered four established clinical risk factors: obesity (BMI ≥ 25), smoking status, physical activity, and family history of T2D (Table S4). Given that no established risk score exists for T2D, estimated effects of these risk factors were extracted from the NHS. Their joint frequencies were taken from control samples in a case-control study of T2D in the NHS.58
The RA risk model included established risk factors of seropositive RA. Selected genetic variants include eight HLA-DRB1 alleles, SNPs newly identified in GWASs, and SNPs from candidate genes that have been confirmed in GWASs to be at a genome-wide significance level. The estimated effects were derived from the largest GWASs and a recent meta-analysis of all published studies59 (Table S5). We simulated these SNPs by using the HapMap CEU56 frequencies, and we simulated the DRB loci by using frequencies extracted from a sample of NHS controls.60 We considered two established clinical risk factors—breast feeding and smoking status (Table S6). The frequencies of these risk factors were extracted from the NHS case-control study of RA,61 whereas the estimated effects were extracted from the discovery studies.62,63
Appendix B
To evaluate the relevance of the simulated models, we estimated, as an example, the discrimination ability of the marginal model used for BRCA in a real dataset. For this aim, we used 1,139 BRCA cases and 1,140 controls from the NHS study.64 All women considered were postmenopausal and older than 50. The 15 SNPs of interest were either genotyped as part of the Cancer Genetic Markers of Susceptibility Study (CGEMS)65 with the Illumina 550K or imputed with the software MACH66 and the HapMap (rel22) CEU data.56 The four Gail components were extracted from the detailed NHS follow-up questionnaires that have been mailed biennially to the full NHS cohort for updating exposure information and any major medical events.
The genetic model including the 15 SNPs yielded an AUC of 0.597 (standard error of the mean [SEM] = 0.012), the nongenetic model including the four Gail component yielded an AUC of 0.583 (SEM = 012), and the combined Gail and SNP model shows an increase in prediction ability and yielded an AUC of 0.629 (SEM = 0.012). These results are in agreement with a previous study that showed similar results for the Gail model and slightly lower results for the Gail and SNP models when using a lower number of SNPs (AUC = 0.618 when Gail and ten SNPs were used in Wacholder et al.;4 AUC = 0.594 when Gail and seven SNPs were used in Mealiffe et al.3). In comparison, our simulated model with the same estimates yielded an average AUC of 0.558 (SD = 0.008), 0.591 (SD = 0.008), and 0.616 (SD = 0.010) for the Gail model, the genetic model, and the combined model, respectively, when no interaction was simulated.
We simulated the interaction effects while constraining the model to have locus-specific and exposure marginal effects similar to those observed empirically. Rather than using the popular parameterization that is based on counts of minor alleles for SNPs and indicator variables for exposures and that includes product interaction terms (Equation 2), we used a coding scheme that ensures that the SNP and exposure main-effect parameters βj and σl are equivalent to the desired marginal effects (Equation 1). We stress, however, that the two parameterizations yield identical models and, moreover, that the interaction terms γ∗,∗ are equivalent.
We illustrate these two parameterizations in the simple case in which there is one haploid SNP and one binary exposure. (The results extend naturally to multiple diploid SNPs and multiple exposures when it is assumed that the population is in Hardy-Weinberg equilibrium, the SNPs are unlinked, and there is no correlation between the SNPs and exposures.) Table A1 presents the coding for terms G, E, and w from Equation 1 and terms G∗ and E∗ from Equation 2 over the four possible genotype-exposure combinations along with each combination's frequency derived with the SNP minor allele frequency q and the exposure frequency π. These codings ensure that the expectations for E and w are 0 within genotype strata and that the expectations for G and w are also 0 within exposure strata. From this and Equation 1, it follows that the difference in average log penetrance between carriers and noncarriers of the minor allele is β and that the difference in average log penetrance between exposed and unexposed subjects is σ. The equivalence between the interaction parameter γ in both models can be seen by the solution of the system of equations described in Table A2. This yields β∗ = β − γπ, σ∗ = σ − γq, and γ∗ = γ.
Table A1.
Coding for Terms G, E, and w from Equation 1 and Terms G∗ and E∗ from Equation 2
| Stratum | G∗ | E∗ | G | E | w | Frequency |
|---|---|---|---|---|---|---|
| Noncarrier, unexposed | 0 | 0 | −q | −π | qπ | (1 − q)(1 − π) |
| Carrier, unexposed | 1 | 0 | (1 − q) | −π | − (1 − q)π | q(1 − π) |
| Noncarrier, exposed | 0 | 1 | −q | (1 − π) | −q(1 − π) | (1 − π)q |
| Carrier, exposed | 1 | 1 | (1 − q) | (1 − π) | (1 − q)(1 − π) | qπ |
Parameters q and π are the minor allele frequency of the SNP G and the frequency of the exposure E, respectively.
Table A2.
Equivalence between Penetrance Models from Equations 1 and 2
|
Penetrance |
|||
|---|---|---|---|
| Stratum | According toEquation 1 | According toEquation 2 | |
| Noncarrier, unexposed | A − βq − σπ + γqπ | = | α |
| Carrier, unexposed | A + β(1 − q) − σπ − γ(1 − q)π | = | α + β∗ |
| Noncarrier, exposed | A − βq + σ(1 − π) − γq(1 − π) | = | α + σ∗ |
| Carrier, exposed | A + β(1 − q) + σ(1 − π) + γ(1 − q)(1 − π) | = | α + β∗ + σ∗ + γ∗ |
Parameters q and π are the minor allele frequency of the SNP G and the frequency of the exposure E, respectively.
We validated our simulation model by comparing the estimated marginal effects of the known risk factors while either simulating or not simulating interactions. As an indicator of the goodness of fit, the mean of the average absolute distance between the estimated marginal additive effects and the true marginal additive effects for the BRCA model was equal to 0.030 (0.024 and 0.044 for the SNPs and the four Gail covariates, respectively) when G-G and G-E interactions between known risk factors were simulated.
Supplemental Data
Web Resources
The URL for data presented herein is as follows:
Online Mendelian Inheritance in Man (OMIM), http://www.omim.org
References
- 1.Janssens A.C., van Duijn C.M. Genome-based prediction of common diseases: Advances and prospects. Hum. Mol. Genet. 2008;17(R2):R166–R173. doi: 10.1093/hmg/ddn250. [DOI] [PubMed] [Google Scholar]
- 2.Gail M.H. Discriminatory accuracy from single-nucleotide polymorphisms in models to predict breast cancer risk. J. Natl. Cancer Inst. 2008;100:1037–1041. doi: 10.1093/jnci/djn180. [DOI] [PMC free article] [PubMed] [Google Scholar]
- 3.Mealiffe M.E., Stokowski R.P., Rhees B.K., Prentice R.L., Pettinger M., Hinds D.A. Assessment of clinical validity of a breast cancer risk model combining genetic and clinical information. J. Natl. Cancer Inst. 2010;102:1618–1627. doi: 10.1093/jnci/djq388. [DOI] [PMC free article] [PubMed] [Google Scholar]
- 4.Wacholder S., Hartge P., Prentice R., Garcia-Closas M., Feigelson H.S., Diver W.R., Thun M.J., Cox D.G., Hankinson S.E., Kraft P. Performance of common genetic variants in breast-cancer risk models. N. Engl. J. Med. 2010;362:986–993. doi: 10.1056/NEJMoa0907727. [DOI] [PMC free article] [PubMed] [Google Scholar]
- 5.Cornelis M.C., Qi L., Zhang C., Kraft P., Manson J., Cai T., Hunter D.J., Hu F.B. Joint effects of common genetic variants on the risk for type 2 diabetes in U.S. men and women of European ancestry. Ann. Intern. Med. 2009;150:541–550. doi: 10.7326/0003-4819-150-8-200904210-00008. [DOI] [PMC free article] [PubMed] [Google Scholar]
- 6.Talmud P.J., Hingorani A.D., Cooper J.A., Marmot M.G., Brunner E.J., Kumari M., Kivimäki M., Humphries S.E. Utility of genetic and non-genetic risk factors in prediction of type 2 diabetes: Whitehall II prospective cohort study. BMJ. 2010;340:b4838. doi: 10.1136/bmj.b4838. [DOI] [PMC free article] [PubMed] [Google Scholar]
- 7.Paynter N.P., Chasman D.I., Paré G., Buring J.E., Cook N.R., Miletich J.P., Ridker P.M. Association between a literature-based genetic risk score and cardiovascular events in women. JAMA. 2010;303:631–637. doi: 10.1001/jama.2010.119. [DOI] [PMC free article] [PubMed] [Google Scholar]
- 8.Spitz M.R., Amos C.I., D'Amelio A., Jr., Dong Q., Etzel C. Re: Discriminatory accuracy from single-nucleotide polymorphisms in models to predict breast cancer risk. J. Natl. Cancer Inst. 2009;101:1731–1732. doi: 10.1093/jnci/djp394. author reply 1732. [DOI] [PMC free article] [PubMed] [Google Scholar]
- 9.Thomas G., Jacobs K.B., Yeager M., Kraft P., Wacholder S., Orr N., Yu K., Chatterjee N., Welch R., Hutchinson A. Multiple loci identified in a genome-wide association study of prostate cancer. Nat. Genet. 2008;40:310–315. doi: 10.1038/ng.91. [DOI] [PubMed] [Google Scholar]
- 10.Haga S.B., Khoury M.J., Burke W. Genomic profiling to promote a healthy lifestyle: Not ready for prime time. Nat. Genet. 2003;34:347–350. doi: 10.1038/ng0803-347. [DOI] [PubMed] [Google Scholar]
- 11.Rose G. Sick individuals and sick populations. Int. J. Epidemiol. 1985;14:32–38. doi: 10.1093/ije/14.1.32. [DOI] [PubMed] [Google Scholar]
- 12.Khoury M.J., Yang Q., Gwinn M., Little J., Dana Flanders W. An epidemiologic assessment of genomic profiling for measuring susceptibility to common diseases and targeting interventions. Genet. Med. 2004;6:38–47. doi: 10.1097/01.gim.0000105751.71430.79. [DOI] [PubMed] [Google Scholar]
- 13.Pharoah P.D., Antoniou A.C., Easton D.F., Ponder B.A. Polygenes, risk prediction, and targeted prevention of breast cancer. N. Engl. J. Med. 2008;358:2796–2803. doi: 10.1056/NEJMsa0708739. [DOI] [PubMed] [Google Scholar]
- 14.Moore J.H., Williams S.M. Epistasis and its implications for personal genetics. Am. J. Hum. Genet. 2009;85:309–320. doi: 10.1016/j.ajhg.2009.08.006. [DOI] [PMC free article] [PubMed] [Google Scholar]
- 15.Campa D., Kaaks R., Le Marchand L., Haiman C.A., Travis R.C., Berg C.D., Buring J.E., Chanock S.J., Diver W.R., Dostal L. Interactions between genetic variants and breast cancer risk factors in the breast and prostate cancer cohort consortium. J. Natl. Cancer Inst. 2011;103:1252–1263. doi: 10.1093/jnci/djr265. [DOI] [PMC free article] [PubMed] [Google Scholar]
- 16.Lindstrom S., Schumacher F., Siddiq A., Travis R.C., Campa D., Berndt S.I., Diver W.R., Severi G., Allen N., Andriole G. Characterizing associations and SNP-environment interactions for GWAS-identified prostate cancer risk markers—results from BPC3. PLoS ONE. 2011;6:e17142. doi: 10.1371/journal.pone.0017142. [DOI] [PMC free article] [PubMed] [Google Scholar]
- 17.Padyukov L., Silva C., Stolt P., Alfredsson L., Klareskog L. A gene-environment interaction between smoking and shared epitope genes in HLA-DR provides a high risk of seropositive rheumatoid arthritis. Arthritis Rheum. 2004;50:3085–3092. doi: 10.1002/art.20553. [DOI] [PubMed] [Google Scholar]
- 18.Travis R.C., Reeves G.K., Green J., Bull D., Tipper S.J., Baker K., Beral V., Peto R., Bell J., Zelenika D., Lathrop M., Million Women Study Collaborators Gene-environment interactions in 7610 women with breast cancer: Prospective evidence from the Million Women Study. Lancet. 2010;375:2143–2151. doi: 10.1016/S0140-6736(10)60636-8. [DOI] [PMC free article] [PubMed] [Google Scholar]
- 19.Hamza T.H., Chen H., Hill-Burns E.M., Rhodes S.L., Montimurro J., Kay D.M., Tenesa A., Kusel V.I., Sheehan P., Eaaswarkhanth M. Genome-wide gene-environment study identifies glutamate receptor gene GRIN2A as a Parkinson's disease modifier gene via interaction with coffee. PLoS Genet. 2011;7:e1002237. doi: 10.1371/journal.pgen.1002237. [DOI] [PMC free article] [PubMed] [Google Scholar]
- 20.Wray N.R., Goddard M.E. Multi-locus models of genetic risk of disease. Genome Med. 2010;2:10. doi: 10.1186/gm131. [DOI] [PMC free article] [PubMed] [Google Scholar]
- 21.Evans D.M., Marchini J., Morris A.P., Cardon L.R. Two-stage two-locus models in genome-wide association. PLoS Genet. 2006;2:e157. doi: 10.1371/journal.pgen.0020157. [DOI] [PMC free article] [PubMed] [Google Scholar]
- 22.Lewis S.J., Smith G.D. Alcohol, ALDH2, and esophageal cancer: A meta-analysis which illustrates the potentials and limitations of a Mendelian randomization approach. Cancer Epidemiol. Biomarkers Prev. 2005;14:1967–1971. doi: 10.1158/1055-9965.EPI-05-0196. [DOI] [PubMed] [Google Scholar]
- 23.Wu C., Hu Z., He Z., Jia W., Wang F., Zhou Y., Liu Z., Zhan Q., Liu Y., Yu D. Genome-wide association study identifies three new susceptibility loci for esophageal squamous-cell carcinoma in Chinese populations. Nat. Genet. 2011;43:679–684. doi: 10.1038/ng.849. [DOI] [PubMed] [Google Scholar]
- 24.García-Closas M., Malats N., Silverman D., Dosemeci M., Kogevinas M., Hein D.W., Tardón A., Serra C., Carrato A., García-Closas R. NAT2 slow acetylation, GSTM1 null genotype, and risk of bladder cancer: Results from the Spanish Bladder Cancer Study and meta-analyses. Lancet. 2005;366:649–659. doi: 10.1016/S0140-6736(05)67137-1. [DOI] [PMC free article] [PubMed] [Google Scholar]
- 25.Kilpeläinen T.O., Qi L., Brage S., Sharp S.J., Sonestedt E., Demerath E., Ahmad T., Mora S., Kaakinen M., Sandholt C.H. Physical activity attenuates the influence of FTO variants on obesity risk: A meta-analysis of 218,166 adults and 19,268 children. PLoS Med. 2011;8:e1001116. doi: 10.1371/journal.pmed.1001116. [DOI] [PMC free article] [PubMed] [Google Scholar]
- 26.Moore S.C., Gunter M.J., Daniel C.R., Reddy K.S., George P.S., Yurgalevitch S., Devasenapathy N., Ramakrishnan L., Chatterjee N., Chanock S.J. Common Genetic Variants and Central Adiposity Among Asian-Indians. Obesity (Silver Spring). 2011 doi: 10.1038/oby.2011.238. Published online July 28, 2011. [DOI] [PMC free article] [PubMed] [Google Scholar]
- 27.Kallberg H., Padyukov L., Plenge R.M., Ronnelid J., Gregersen P.K., van der Helm-van Mil A.H., Toes R.E., Huizinga T.W., Klareskog L., Alfredsson L., Epidemiological Investigation of Rheumatoid Arthritis study group Gene-gene and gene-environment interactions involving HLA-DRB1, PTPN22, and smoking in two subsets of rheumatoid arthritis. Am. J. Hum. Genet. 2007;80:867–875. doi: 10.1086/516736. [DOI] [PMC free article] [PubMed] [Google Scholar]
- 28.Pencina M.J., D'Agostino R.B., Sr., Steyerberg E.W. Extensions of net reclassification improvement calculations to measure usefulness of new biomarkers. Stat. Med. 2011;30:11–21. doi: 10.1002/sim.4085. [DOI] [PMC free article] [PubMed] [Google Scholar]
- 29.Pencina M.J., D'Agostino R.B., Sr., D'Agostino R.B., Jr., Vasan R.S. Evaluating the added predictive ability of a new marker: From area under the ROC curve to reclassification and beyond. Stat. Med. 2008;27:157–172. doi: 10.1002/sim.2929. discussion 207–212. [DOI] [PubMed] [Google Scholar]
- 30.Gail M.H., Brinton L.A., Byar D.P., Corle D.K., Green S.B., Schairer C., Mulvihill J.J. Projecting individualized probabilities of developing breast cancer for white females who are being examined annually. J. Natl. Cancer Inst. 1989;81:1879–1886. doi: 10.1093/jnci/81.24.1879. [DOI] [PubMed] [Google Scholar]
- 31.Pepe M.S. Oxford University Press; New York: 2003. The Statistical Evaluation of Medical Tests for Classification and Prediction. [Google Scholar]
- 32.Cook N.R. Use and misuse of the receiver operating characteristic curve in risk prediction. Circulation. 2007;115:928–935. doi: 10.1161/CIRCULATIONAHA.106.672402. [DOI] [PubMed] [Google Scholar]
- 33.Gail M.H., Pfeiffer R.M. On criteria for evaluating models of absolute risk. Biostatistics. 2005;6:227–239. doi: 10.1093/biostatistics/kxi005. [DOI] [PubMed] [Google Scholar]
- 34.Pepe M.S., Janes H.E. Gauging the performance of SNPs, biomarkers, and clinical factors for predicting risk of breast cancer. J. Natl. Cancer Inst. 2008;100:978–979. doi: 10.1093/jnci/djn215. [DOI] [PMC free article] [PubMed] [Google Scholar]
- 35.Greenland S. The need for reorientation toward cost-effective prediction: comments on ‘Evaluating the added predictive ability of a new marker: From area under the ROC curve to reclassification and beyond’ by M. J. Pencina et al., Statistics in Medicine (DOI: 10.1002/sim.2929) Stat. Med. 2008;27:199–206. doi: 10.1002/sim.2995. [DOI] [PubMed] [Google Scholar]
- 36.Milne R.L., Gaudet M.M., Spurdle A.B., Fasching P.A., Couch F.J., Benítez J., Arias Pérez J.I., Zamora M.P., Malats N., Dos Santos Silva I., GENICA Network. kConFab. AOCS Assessing interactions between the associations of common genetic susceptibility variants, reproductive history and body mass index with breast cancer risk in the breast cancer association consortium: a combined case-control study. Breast Cancer Res. 2010;12:R110. doi: 10.1186/bcr2797. [DOI] [PMC free article] [PubMed] [Google Scholar]
- 37.Qi L., Liang J. Interactions between genetic factors that predict diabetes and dietary factors that ultimately impact on risk of diabetes. Curr. Opin. Lipidol. 2010;21:31–37. doi: 10.1097/MOL.0b013e3283346cb6. [DOI] [PMC free article] [PubMed] [Google Scholar]
- 38.Carlborg O., Haley C.S. Epistasis: Too often neglected in complex trait studies? Nat. Rev. Genet. 2004;5:618–625. doi: 10.1038/nrg1407. [DOI] [PubMed] [Google Scholar]
- 39.Shao H., Burrage L.C., Sinasac D.S., Hill A.E., Ernest S.R., O'Brien W., Courtland H.W., Jepsen K.J., Kirby A., Kulbokas E.J. Genetic architecture of complex traits: Large phenotypic effects and pervasive epistasis. Proc. Natl. Acad. Sci. USA. 2008;105:19910–19914. doi: 10.1073/pnas.0810388105. [DOI] [PMC free article] [PubMed] [Google Scholar]
- 40.Bouzigon E., Corda E., Aschard H., Dizier M.H., Boland A., Bousquet J., Chateigner N., Gormand F., Just J., Le Moual N. Effect of 17q21 variants and smoking exposure in early-onset asthma. N. Engl. J. Med. 2008;359:1985–1994. doi: 10.1056/NEJMoa0806604. [DOI] [PubMed] [Google Scholar]
- 41.Mechanic L.E., Chen H.S., Amos C.I., Chatterjee N., Cox N.J., Divi R.L., Fan R., Harris E.L., Jacobs K., Kraft P. Next generation analytic tools for large scale genetic epidemiology studies of complex diseases. Genet. Epidemiol. 2011 doi: 10.1002/gepi.20652. [DOI] [PMC free article] [PubMed] [Google Scholar]
- 42.Bookman E.B., McAllister K., Gillanders E., Wanke K., Balshaw D., Rutter J., Reedy J., Shaughnessy D., Agurs-Collins T., Paltoo D., for the NIH G × E Interplay Workshop participants Gene-environment interplay in common complex diseases: Forging an integrative model-recommendations from an NIH workshop. Genet. Epidemiol. 2011 doi: 10.1002/gepi.20571. [DOI] [PMC free article] [PubMed] [Google Scholar]
- 43.Hughes D.A., Vilar F.J., Ward C.C., Alfirevic A., Park B.K., Pirmohamed M. Cost-effectiveness analysis of HLA B∗5701 genotyping in preventing abacavir hypersensitivity. Pharmacogenetics. 2004;14:335–342. doi: 10.1097/00008571-200406000-00002. [DOI] [PubMed] [Google Scholar]
- 44.Eichelbaum M., Ingelman-Sundberg M., Evans W.E. Pharmacogenomics and individualized drug therapy. Annu. Rev. Med. 2006;57:119–137. doi: 10.1146/annurev.med.56.082103.104724. [DOI] [PubMed] [Google Scholar]
- 45.Rose G. Oxford University Press; Oxford: 1992. The strategy of preventive medicine. [Google Scholar]
- 46.So H.C., Sham P.C. A unifying framework for evaluating the predictive power of genetic variants based on the level of heritability explained. PLoS Genet. 2010;6:e1001230. doi: 10.1371/journal.pgen.1001230. [DOI] [PMC free article] [PubMed] [Google Scholar]
- 47.Mihaescu R., van Zitteren M., van Hoek M., Sijbrands E.J., Uitterlinden A.G., Witteman J.C., Hofman A., Hunink M.G., van Duijn C.M., Janssens A.C. Improvement of risk prediction by genomic profiling: reclassification measures versus the area under the receiver operating characteristic curve. Am. J. Epidemiol. 2010;172:353–361. doi: 10.1093/aje/kwq122. [DOI] [PubMed] [Google Scholar]
- 48.Cordell H.J. Detecting gene-gene interactions that underlie human diseases. Nat. Rev. Genet. 2009;10:392–404. doi: 10.1038/nrg2579. [DOI] [PMC free article] [PubMed] [Google Scholar]
- 49.Siemiatycki J., Thomas D.C. Biological models and statistical interactions: An example from multistage carcinogenesis. Int. J. Epidemiol. 1981;10:383–387. doi: 10.1093/ije/10.4.383. [DOI] [PubMed] [Google Scholar]
- 50.Kraft P., Yen Y.C., Stram D.O., Morrison J., Gauderman W.J. Exploiting gene-environment interaction to detect genetic associations. Hum. Hered. 2007;63:111–119. doi: 10.1159/000099183. [DOI] [PubMed] [Google Scholar]
- 51.Murcray C.E., Lewinger J.P., Gauderman W.J. Gene-environment interaction in genome-wide association studies. Am. J. Epidemiol. 2009;169:219–226. doi: 10.1093/aje/kwn353. [DOI] [PMC free article] [PubMed] [Google Scholar]
- 52.Thomas D.C., Lewinger J.P., Murcray C.E., Gauderman W.J. Invited commentary: GE-Whiz! Ratcheting gene-environment studies up to the whole genome and the whole exposome. Am. J. Epidemiol. 2012;175:203–207. doi: 10.1093/aje/kwr365. discussion 208–209. [DOI] [PMC free article] [PubMed] [Google Scholar]
- 53.Mukherjee B., Ahn J., Gruber S.B., Chatterjee N. Testing gene-environment interaction in large-scale case-control association studies: Possible choices and comparisons. Am. J. Epidemiol. 2012;175:177–190. doi: 10.1093/aje/kwr367. [DOI] [PMC free article] [PubMed] [Google Scholar]
- 54.Cornelis M.C., Tchetgen E.J., Liang L., Qi L., Chatterjee N., Hu F.B., Kraft P. Gene-environment interactions in genome-wide association studies: A comparative study of tests applied to empirical studies of type 2 diabetes. Am. J. Epidemiol. 2012;175:191–202. doi: 10.1093/aje/kwr368. [DOI] [PMC free article] [PubMed] [Google Scholar]
- 55.Hindorff L.A., Sethupathy P., Junkins H.A., Ramos E.M., Mehta J.P., Collins F.S., Manolio T.A. Potential etiologic and functional implications of genome-wide association loci for human diseases and traits. Proc. Natl. Acad. Sci. USA. 2009;106:9362–9367. doi: 10.1073/pnas.0903103106. [DOI] [PMC free article] [PubMed] [Google Scholar]
- 56.International HapMap Consortium The International HapMap Project. Nature. 2003;426:789–796. doi: 10.1038/nature02168. [DOI] [PubMed] [Google Scholar]
- 57.Hunter D.J., Kraft P., Jacobs K.B., Cox D.G., Yeager M., Hankinson S.E., Wacholder S., Wang Z., Welch R., Hutchinson A. A genome-wide association study identifies alleles in FGFR2 associated with risk of sporadic postmenopausal breast cancer. Nat. Genet. 2007;39:870–874. doi: 10.1038/ng2075. [DOI] [PMC free article] [PubMed] [Google Scholar]
- 58.Qi L., Cornelis M.C., Kraft P., Stanya K.J., Linda Kao W.H., Pankow J.S., Dupuis J., Florez J.C., Fox C.S., Paré G., Meta-Analysis of Glucose and Insulin-related traits Consortium (MAGIC) Diabetes Genetics Replication and Meta-analysis (DIAGRAM) Consortium Genetic variants at 2q24 are associated with susceptibility to type 2 diabetes. Hum. Mol. Genet. 2010;19:2706–2715. doi: 10.1093/hmg/ddq156. [DOI] [PMC free article] [PubMed] [Google Scholar]
- 59.Fernando M.M., Stevens C.R., Walsh E.C., De Jager P.L., Goyette P., Plenge R.M., Vyse T.J., Rioux J.D. Defining the role of the MHC in autoimmunity: A review and pooled analysis. PLoS Genet. 2008;4:e1000024. doi: 10.1371/journal.pgen.1000024. [DOI] [PMC free article] [PubMed] [Google Scholar]
- 60.Karlson E.W., Chibnik L.B., Kraft P., Cui J., Keenan B.T., Ding B., Raychaudhuri S., Klareskog L., Alfredsson L., Plenge R.M. Cumulative association of 22 genetic variants with seropositive rheumatoid arthritis risk. Ann. Rheum. Dis. 2010;69:1077–1085. doi: 10.1136/ard.2009.120170. [DOI] [PMC free article] [PubMed] [Google Scholar]
- 61.Karlson E.W., Chibnik L.B., Tworoger S.S., Lee I.M., Buring J.E., Shadick N.A., Manson J.E., Costenbader K.H. Biomarkers of inflammation and development of rheumatoid arthritis in women from two prospective cohort studies. Arthritis Rheum. 2009;60:641–652. doi: 10.1002/art.24350. [DOI] [PMC free article] [PubMed] [Google Scholar]
- 62.Karlson E.W., Mandl L.A., Hankinson S.E., Grodstein F. Do breast-feeding and other reproductive factors influence future risk of rheumatoid arthritis? Results from the Nurses' Health Study. Arthritis Rheum. 2004;50:3458–3467. doi: 10.1002/art.20621. [DOI] [PubMed] [Google Scholar]
- 63.Costenbader K.H., Feskanich D., Mandl L.A., Karlson E.W. Smoking intensity, duration, and cessation, and the risk of rheumatoid arthritis in women. Am. J. Med. 2006;119:503.e1–503.e9. doi: 10.1016/j.amjmed.2005.09.053. [DOI] [PubMed] [Google Scholar]
- 64.Willett W.C., Stampfer M.J., Colditz G.A., Rosner B.A., Hennekens C.H., Speizer F.E. Moderate alcohol consumption and the risk of breast cancer. N. Engl. J. Med. 1987;316:1174–1180. doi: 10.1056/NEJM198705073161902. [DOI] [PubMed] [Google Scholar]
- 65.Thomas G., Jacobs K.B., Kraft P., Yeager M., Wacholder S., Cox D.G., Hankinson S.E., Hutchinson A., Wang Z., Yu K. A multistage genome-wide association study in breast cancer identifies two new risk alleles at 1p11.2 and 14q24.1 (RAD51L1) Nat. Genet. 2009;41:579–584. doi: 10.1038/ng.353. [DOI] [PMC free article] [PubMed] [Google Scholar]
- 66.Li Y., Willer C.J., Ding J., Scheet P., Abecasis G.R. MaCH: Using sequence and genotype data to estimate haplotypes and unobserved genotypes. Genet. Epidemiol. 2010;34:816–834. doi: 10.1002/gepi.20533. [DOI] [PMC free article] [PubMed] [Google Scholar]
Associated Data
This section collects any data citations, data availability statements, or supplementary materials included in this article.