

Abstract
An individual's disease risk is determined by the compounded action of both common variants, inherited from remote ancestors, that segregated within the population and rare variants, inherited from recent ancestors, that segregated mainly within pedigrees. Next-generation sequencing (NGS) technologies generate high-dimensional data that allow a nearly complete evaluation of genetic variation. Despite their promise, NGS technologies also suffer from remarkable limitations: high error rates, enrichment of rare variants, and a large proportion of missing values, as well as the fact that most current analytical methods are designed for population-based association studies. To meet the analytical challenges raised by NGS, we propose a general framework for sequence-based association studies that can use various types of family and unrelated-individual data sampled from any population structure and a universal procedure that can transform any population-based association test statistic for use in family-based association tests. We develop family-based functional principal-component analysis (FPCA) with or without smoothing, a generalized T2, combined multivariate and collapsing (CMC) method, and single-marker association test statistics. Through intensive simulations, we demonstrate that the family-based smoothed FPCA (SFPCA) has the correct type I error rates and much more power to detect association of (1) common variants, (2) rare variants, (3) both common and rare variants, and (4) variants with opposite directions of effect from other population-based or family-based association analysis methods. The proposed statistics are applied to two data sets with pedigree structures. The results show that the smoothed FPCA has a much smaller p value than other statistics.
Introduction
Resequencing of exomes—and ultimately, whole genomes—generate unprecedentedly massive, high-dimensional genetic-variation data that allow a nearly complete evaluation of genetic variation, including several million common (>5% population frequency), low-frequency (>1% and < 5% population frequency), and rare variants (<1% population frequency) in typical human genomes, and provides a powerful tool for the comprehensive cataloging of human genetic variation and the identification of the association of the entire allele-frequency spectrum of genetic variation.1,2 Limitations of next-generation sequencing (NGS) technologies include high error rates, enrichment of rare variants, and a large proportion of missing values.3–7
It is hypothesized that common variants are derived from distant ancestors and rare variants are of recent origin.8 An individual's disease risk is likely to arise from the compounded action of common variants that segregated in the population and rare variants that arose recently in extended pedigrees. There has been a gradual realization that common variants play a less-significant role in causing disease than that played by rare variants that are of recent origin; accordingly, during the past several years, genetic studies of complex diseases have undergone a paradigm shift from identifying common risk variants to identifying either rare risk variants or both common and rare risk variants.9 The current popular statistical method for testing the association of rare variants is the population-based association test. However, rare variants arise from recent mutations in pedigrees.8,10,11 Given that an individual rare variant would have a relatively small impact on the common disease and that rare variants have very low population frequencies, the power the current analytical platforms have in testing the association of rare variants is limited, regardless of whether they are traditional variant-by-variant analysis methods or the recently developed group tests. An outstanding question is how to meet the analytical challenges raised by NGS through integration of all risk-associated common and rare variants that segregate in populations or pedigrees over several generations, and, in so doing, efficiently use NGS for the identification of the association of rare variants with disease.
To achieve this goal, we propose a general framework for association studies that uses data sampled from pedigrees with a complex structure and unrelated individuals from structured populations as well as an entire allelic spectrum of genetic variants.12 Typical pedigrees include: parent-offspring trios, sibling pairs, extended pedigrees with multiple affected and unaffected individuals, multigenerational families, and families and related individuals from structured populations.
The proposed approach has several remarkable features. First, it can be applied to various types of genetic data. Specifically, it does not require assumptions as to how the individuals might be related and allows for unknown or partially known pedigree structures. The individuals can come from structured populations, such as consanguineous populations and admixed populations. The genetic variants can be common, rare, or both common and rare. Second, the mathematical disadvantage of traditional linkage analysis is its use of the likelihood approach. Specification of likelihood functions for complex genetic data with multiple pedigrees, large numbers of unrelated individuals, and multiple rare and common variants in a genomic region is difficult, as is the development of algorithms for estimation of the parameters from such complex likelihood functions. We present a statistical method that is simple, easy to implement, and therefore computationally feasible for NGS data. Third, the inclusion of families in association studies has the potential to enhance our ability to enrich for rare risk or for protective variants that occur in the pedigrees over several generations, and hence substantially increase their power. Fourth, joint analysis of linkage and association can effectively use the observed transmission (linkage) information in the pedigrees, the linkage disequilibrium (LD) information hidden in the history of populations, rare variants segregating in the pedigrees, and common variants segregating in the population. Fifth, the transmission pattern in the pedigrees allows for easy correction of sequencing errors. Sixth, the genotype data of other members of the pedigrees provide useful information for inferring the missing genotypes of the individuals in the pedigrees. Seventh, family data allow for control of heterogeneity and population substructures. Eighth, this approach can use both pedigree and unrelated individual data; hence, it provides a highly flexible general framework for association studies of complex disease.
Extension of the population-basedassociation-analysis methods designed for NGS to the family-based or mixed family-based and population-based association studies for NGS is a core of the proposed general framework for association studies. The key to such extensions is calculation of the covariance matrix of multiple genetic variants in the genome region or the functional principal scores between related individuals. Therefore, motivated by case-control association testing for related individuals who have population substructure,13–16 we first derive the formulas for calculation of the covariance matrices of genetic variance and the functional principal-component scores. Then, with the aid of these formulas, we extend the combined multivariate and collapsing (CMC) method,9 generalized T2,17 and functional principal-component analysis (FPCA)18 statistics for population-based association studies to family-based or mixed family-based and population-based association studies. To evaluate the statistics' performance, we use large-scale simulations to calculate the type I error rates and compare the power of several statistics with simulated data containing both pedigrees and unrelated individuals. For further evaluation of their performance, statistics developed in this report are applied to the Framingham Heart Study (FHS) data set and childhood-onset asthma studies. A program for implementing the developed statistical methods can be downloaded from our website (see Web Resources).
Material and Methods
We extend four population-based association tests for NGS to a general case that has multiple families and unrelated individuals present in the samples.
The Generalized T2 Test for Families and Unrelated Individuals
Consider n sampled individuals from multiple families or unrelated individuals. Assume that each individual has T genetic variants. Suppose that the genotypes of the ith individual at the tth genetic variant site are denoted by , and , respectively. Assume that is a risk allele. Define an indicator variable for the genotype as
Let
Define and , a column vector of 1 of length n, where
Define
| (Equation 1) |
where is the number of affected individuals, is a T dimensional identity matrix, and ⊗ denotes the Kronecker product of two matrices.
The generalized statistic with pedigree structures is defined as
| (Equation 2) |
where .
Let
| (Equation 3) |
where .
It can be shown that (Appendix A)
| (Equation 4) |
where Φ is the kinship matrix and defined as
| (Equation 5) |
is the inbreeding coefficient of individual i, and is the kinship coefficient between individuals i and j.
The matrix can be estimated by
| (Equation 6) |
where
The covariance matrix Γ is calculated as follows:
| (Equation 7) |
To establish the relationship between the test statistic for general pedigrees and the statistic for the population-based association test, we need to simplify HZ. It is easy to see that
| (Equation 8) |
where are averages of the indicator variables for the genotypes at the tth variant site in cases and controls, respectively.
From Equation 8 it follows that
| (Equation 9) |
Therefore, the test statistic can be simplified to
| (Equation 10) |
where is the generalized statistic for the population-based association tests and is the correction factor to be applied to the generalized statistic to have a valid test in the presence of pedigree structures. The correction factor depends on kinship coefficients and the number of affected and unaffected individuals. Under the null hypothesis of no association of the genomic region with the disease, is distributed as a central distribution with T degrees of freedom.
CMC Test for Families
Now we extend the population-based CMC test to the families with known or unknown population structure. We previously extended the population-based generalized test to the families. Combining the collapsing test and the generalized test for families, we can obtain the CMC test for families in the samples. Specifically, suppose that T variants can be classified as k groups of rare variants and m individual variant sites.
Define indicator variables for the k group of rare variants:
s = 1..,k, and Ps = P(presence of the rare variants in the s - th group).
The variance of the indicator variable can be estimated by
Let
Define
where the parameters in the above equations are defined as before. The vector η consists of two parts: one is for collapsed variants and other one is for uncollapsed variants.
We define a diagonal matrix:
| (Equation 11) |
The covariance matrix is given by (Y.Y. Shugart, Y.Z., W. Guo, and M.X., unpublished data)
| (Equation 12) |
Thus, the covariance matrix of η is given by
| (Equation 13) |
where
Then, by the similar argument as before, the covariance matrix of is given by
| (Equation 14) |
Thus, the family-based CMC statistic can be defined as
| (Equation 15) |
where are the averages of the indicator variables in cases and controls, respectively; is the CMC statistic for the population-based association test; and the correction factor is defined as before. The test statistic follows a distribution with (k + m) degrees of freedom, asymptotically, under the null hypothesis of no association of the genomic region being tested.
The FPCA and Smoothed FPCA for Families
The FPCA and smoothed FPCA (SFPCA) can be applied to the population-based association studies.18 Now we extend them to a general case where multiple families and additional population structures are presented in the samples. Let be a set of eigenfunctions that are formed from the genotype data of the sampled individuals under the SFPCA model. Let be a genotypic function of the ith individual, where t is the genomic position, and defined as
| (Equation 16) |
Suppose that the genotypic function is expanded by eigenfunctions that are formed by the SFPCA as
| (Equation 17) |
where
and . λ is a penalty parameter, which is referred to as the smoothed functional-component scores. When λ is equal to zero, expansion of Equation 17 will be reduced to the FPCA expansion.
Our purpose is to use the functional principal-component scores to develop test statistics that can be applied to pedigrees. To achieve this, we first calculate the covariance matrix of the functional principal-component scores. Let
Define
| (Equation 18) |
and
The matrix can be estimated by
| (Equation 19) |
Then, it can be shown that (Appendix B)
| (Equation 20) |
Define
| (Equation 21) |
and .
It follows from Equation 20 that
| (Equation 22) |
The family-based SFPCA statistic is then defined as
| (Equation 23) |
When , the family-based SFPCA statistic in Equation 23 is reduced to the family-based FPCA statistic without smoothing.
Let be the vector of averages of the functional principal-component scores in cases and controls, respectively. It can be show that the statistic can be simplified to (Appendix B)
| (Equation 24) |
where is the population-based SFPCA statistic (L. Luo, Y.Z., and M.X., unpublished data) and is the correction factor as defined previously.
When penalty parameter λ is equal to zero, the family-based SFPCA is reduced to the family-based FPCA statistic:
| (Equation 25) |
Under the null hypothesis of no association of the genomic region, the statistics will be asymptotically distributed as a central distribution where k is the number of functional principal components in the eigenequation expansion of genotypic functions.
Estimation of Kinship Matrix
All previous covariance matrices involve the kinship matrix. Although the genealogical relationship between individuals in the same pedigrees can be directly specified, the relationships between individuals in the different pedigrees are usually unknown. Given the presence of hidden population substructures and cryptic relatedness in the samples, the genealogical relationships between individuals in the different pedigrees cannot be ignored. The kinship matrix includes both the pedigree relationships of the related individuals and of the population structures. In general, the kinship matrix Φ is unknown and can be estimated by the genetic variants in the data. Consider m markers. Let be the indicator variable for the jth SNP of the ith individual, as defined before, and be the frequency of its reference allele. The genealogical matrix can be estimated by19
| (Equation 26) |
Because the allele frequencies are unknown, they are estimated as follows:16
Step 1 (initial): use the average allele frequency in the population as to estimate ;
Step 2 (iteration): let t be the tth SNP in the genomic region. For the ith iteration, we
-
•
use to estimate , , where 1 is a vector of 1 and is a vector of indicator variable for the genotypes at the tth SNP in the genomic region, as defined before;
-
•
use this to estimate ; and
-
•
stop upon convergence or the meeting of maximum iteration limits.
Results
Null Distribution of Test Statistics
To assess the type I error rates of the test statistics and the impact of the use of known and estimated kinship coefficients on the family-based association studies, we performed a series of simulation studies. We used the software ForSim20 to simulate three different design settings. In the first sitting, we sampled 40 outbred pedigrees that have three generations, each pedigree having approximately 17 individuals, and 60 pedigrees that have two generations, each pedigree having approximately five individuals, from a homozygous population. In each pedigree, roughly half of the individuals were randomly labeled as affected individuals; the remaining individuals were assigned as unaffected. The second setting was similar to the first, except that 70% of the pedigrees were sampled from subpopulation 1 and the remaining 30% of the pedigrees were sampled from subpopulation 2. Two subpopulations were generated by dividing a population into two subpopulations through phenotypic selection at the fifth generation (The total number of generations in the simulations was 100). The phenotype of an individual was determined by natural selection. In subpopulation 1 we selected individuals within 0.4 SD of the mean phenotype, and in subpopulation 2 we selected individuals within 0.6 SD of the mean phenotype. Two subpopulations were then evolved in 95 generations via population genetics models. The third setting was also similar to the first, with the difference of the inclusion of an additional 500 unrelated cases and 500 unrelated controls in the study. In all three settings, each individual had 168 rare variants with minor allele frequencies (MAF) less than 0.01. A total of 5,000 simulations were repeated.
Tables 1, 2, and 3 summarize the type I error rates of the five statistics: the SFPCA statistic, the FPCA statistic, the CMC method,9 the generalized T2,17 and the corrected individual test (where we averaged the type I error rates of multiple variants) for the first, second, and third study designs, respectively. We considered three scenarios for relatedness of individuals. For the first scenario, we used theoretical kinship coefficients between pairs of individuals in the same pedigrees as our kinship coefficients and assumed that kinship coefficients between pairs of individuals in differing pedigrees were zero. For the second scenario, we assumed that individuals between different pedigrees were related. The theoretical kinship coefficients were again taken as our kinship coefficients between pairs of individuals in the same pedigrees, and the kinship coefficients between pairs of individuals in differing pedigrees were estimated by the typed SNPs. For the third scenario, we estimated all kinship coefficients between pairs of individuals by the typed SNPs, regardless of whether the paired individuals were in the same or in differing pedigrees. Tables 1, 2, and 3 show that the empirical type I error rates of the test statistics were close to each other, whether we use all theoretical kinship coefficients or all estimated kinship coefficients in all three study designs. In this case, the type I error rates of the SFPCA and FPCA statistics were not significantly deviated from the nominal levels, although they are slightly deflated at the significance level In contrast, type I errors of the other statistics were more deflated than the SFPCA and FPCA statistics. Tables 1 and 2 also show that we found this result when taking theoretical kinship coefficients between pairs of individuals in the same pedigree as our kinship coefficients and estimating the kinship coefficients between pairs of individuals in the different pedigrees. Type I error rates of all test statistics deviated significantly from the nominal levels (inflated at the significance level ) for the first and second study designs, and the statistics of the individual test, FPCA, and SFPCA also showed inflated type I error rates at the significance level for the first study design. The reason for this is as follows. The estimated kinship coefficients depend on the selected markers. In general, the estimated kinship coefficients will not be equal to the theoretical kinship coefficients. In our experience, the estimated kinship coefficients are often smaller than the theoretical kinship coefficients. Approximately, the estimated kinship coefficients are equal to the theoretical kinship coefficients multiplied by a constant. Let be the correction factors that are obtained by the estimated and theoretical kinship coefficients, respectively. Thus, we have , which implies that , where are the test statistics based on the estimated and theoretical kinship coefficients, respectively. The empirical distribution of the test statistic based on the estimated kinship coefficients in simulations will be shifted by a constant from the empirical distribution of the test statistic based on theoretical kinship coefficients in the simulations. Therefore, the type I error rates of both statistics will be the same. However, when the theoretical kinship coefficients are used to measure the genetic relationships among individuals in the same pedigrees and the estimated kinship coefficients are used to measure the genetic relationships among individuals in differing pedigrees, because the genotypes of individuals in each simulation will be changed, the correction coefficient that is dependent on the simulations will change in complicated way, which in turn will affect the empirical distribution of the test statistics and type I error rates.
Table 1.
Type I Error Rates of Five Statistics for the First Study Design
| Nominal Level | 0.05 | 0.01 | 0.001 |
|---|---|---|---|
| Theoretical Kinship Coefficient | |||
| 0.0349 | 0.0074 | 0.0006 | |
| CMC | 0.0397 | 0.0082 | 0.0006 |
| T2 | 0.0363 | 0.0078 | 0.0008 |
| FPCA | 0.0413 | 0.0086 | 0.0008 |
| SFPCA | 0.0413 | 0.0091 | 0.0008 |
| Estimated Kinship Coefficient | |||
| 0.0364 | 0.0072 | 0.0006 | |
| CMC | 0.0388 | 0.0084 | 0.0006 |
| T2 | 0.0368 | 0.0078 | 0.0008 |
| FPCA | 0.0414 | 0.0088 | 0.0008 |
| SFPCA | 0.0426 | 0.0092 | 0.0008 |
| Theoretical + Estimated Coefficient | |||
| 0.0563 | 0.0124 | 0.0015 | |
| CMC | 0.0591 | 0.0109 | 0.0009 |
| T2 | 0.0719 | 0.0105 | 0.0017 |
| FPCA | 0.0857 | 0.0180 | 0.0010 |
| SFPCA | 0.0803 | 0.0135 | 0.0018 |
, individual test; CMC, combined multivariate and collapsing method; T2, generalized T2 test; FPCA, functional principal-component analysis; SFPCA, smoothed FPCA.
Table 2.
Type I Error Rates of Five Statistics for the Second Study Design
| Nominal Level | 0.05 | 0.01 | 0.001 |
|---|---|---|---|
| Theoretical Kinship Coefficient | |||
| 0.0365 | 0.0070 | 0.0006 | |
| CMC | 0.0375 | 0.0087 | 0.0006 |
| T2 | 0.0389 | 0.0083 | 0.0008 |
| FPCA | 0.0423 | 0.0091 | 0.0008 |
| SFPCA | 0.0428 | 0.0099 | 0.0008 |
| Estimated Kinship Coefficient | |||
| 0.0389 | 0.0075 | 0.0006 | |
| CMC | 0.0390 | 0.0092 | 0.0006 |
| T2 | 0.0402 | 0.0086 | 0.0008 |
| FPCA | 0.0434 | 0.0095 | 0.0008 |
| SFPCA | 0.0438 | 0.0100 | 0.0008 |
| Theoretical + Estimated Coefficient | |||
| 0.0573 | 0.0103 | 0.0008 | |
| CMC | 0.0553 | 0.0141 | 0.0006 |
| T2 | 0.0554 | 0.0114 | 0.0012 |
| FPCA | 0.0667 | 0.0102 | 0.0008 |
| SFPCA | 0.0618 | 0.0118 | 0.0008 |
, individual test; CMC, combined multivariate and collapsing method; T2, generalized T2 test; FPCA, functional principal-component analysis; SFPCA, smoothed FPCA.
Table 3.
Type I Error Rates of Five Statistics for the Third Study Design
| Nominal Level | 0.05 | 0.01 | 0.001 |
|---|---|---|---|
| Theoretical Kinship Coefficient | |||
| 0.0344 | 0.0073 | 0.0007 | |
| CMC | 0.0390 | 0.0096 | 0.0006 |
| T2 | 0.0382 | 0.0096 | 0.0009 |
| FPCA | 0.0454 | 0.0118 | 0.0008 |
| SFPCA | 0.0475 | 0.0122 | 0.0008 |
| Estimated Kinship Coefficient | |||
| 0.0343 | 0.0070 | 0.0006 | |
| CMC | 0.0347 | 0.0083 | 0.0006 |
| T2 | 0.0395 | 0.0081 | 0.0008 |
| FPCA | 0.0412 | 0.0095 | 0.0007 |
| SFPCA | 0.0418 | 0.0099 | 0.0008 |
| Theoretical + Estimated Coefficient | |||
| 0.0348 | 0.0074 | 0.0007 | |
| CMC | 0.0406 | 0.0097 | 0.0006 |
| T2 | 0.0370 | 0.0089 | 0.0009 |
| FPCA | 0.0445 | 0.0123 | 0.0008 |
| SFPCA | 0.0458 | 0.0118 | 0.0009 |
, individual test; CMC, combined multivariate and collapsing method; T2, generalized T2 test; FPCA, functional principal-component analysis; SFPCA, smoothed FPCA.
Power Evaluation
To evaluate the performance of the proposed statistics for testing the association of variants, we used simulated data to estimate their power to detect true associations. We used the software ForSim20 to simulate pedigrees. Each individual in the pedigree had 189 variant sites; the MAF of all sites was less than 0.01, but more than 0.0001.
An individual's disease status was determined on the basis of the individual's genotype and its penetrance at each locus. Let be a rare risk allele at the ith variant site. Let be the genotypes , , and , respectively, and let be the penetrance of genotypes at the ith locus. The relative risk (RR) at the ith variant site is defined as and , where is the baseline penetrance of the wild-type genotype at the ith variant site. We assumed that for the additive disease model, ; for the dominant disease model, ; for the recessive disease model, ; and for the multiplicative disease model, . The genotype RR was assumed to be inversely proportional to the MAF, where the population attributable risk of each group was assumed to be 0.006.21 We assumed that the baseline penetrance of the wild-type genotype was equal across all variant sites and that the variants influenced disease susceptibility independently (i.e., without epistasis). We considered four disease models: additive, dominant, recessive, and multiplicative. Due to space limitation, we only present the power of the tests under the dominant disease models. However, the pattern of power of the tests under other disease models will be mentioned. The disease status of an individual in the pedigree was randomly assigned according to the disease models. The process of sampling required pedigrees from the population of pedigrees was repeated until the desired pedigrees were obtained for each disease model.
We considered three family structures: nuclear family with two parents and two offspring, sibling pair (sib-pair), and three-generational family (each family with about 20 individuals). We further divided the nuclear families into nuclear family 1, in which we considered one affected parent and one affected offspring, and nuclear family 2, in which we considered one affected parent and two affected offspring. Sib-pairs were also divided into two groups. Sib-pair 1 consisted of one affected sibling and one unaffected sibling. In sib-pair 2, we considered a total of 2/3 of the sib-pairs with two affected siblings and 1/3 of the sib-pairs with one affected sibling and one unaffected sibling. Again, three-generational families were also divided into two subgroups. In group 1, we assume that each family had an equal number of affected and unaffected individuals. In group 2, 2/3 of the individuals in each family were affected, and 1/3 of the individuals in each family were unaffected. To study the sensitivity of the developed methods to the number of affected individuals, we considered three-generational family group 3, wherein only 1/3 of individuals were affected. We assumed that the total number of individuals in each family structure was approximately equal. Power calculations were performed by simulations. For each case, 2,000 simulated replicates were performed.
Figures 1 and 2 show the power curves of the family-based CMC (variants with frequencies ≤ 0.005 were collapsed), FPCA, SFPCA, and the corrected single-marker statistics as a function of the total number of individuals in the test, at the significance level and under seven settings: unrelated individuals in cases-controls study, nuclear family groups 1 and 2, sib-pair groups 1 and 2, and three-generational family groups 1 and 2, with the assumption of a homogeneous population, the dominant model, 20% of risk variants, and a baseline penetrance of 0.01. Several remarkable features emerged from these results. First, as expected, in general, family-based association studies had much higher power than population-based association studies. Particularly, the corrected single-marker test, wherein permutation was used to adjust for multiple testing, is designed to adapt the standard test for accounting for relatedness among individuals.13,14 The corrected single-marker test is a traditional linkage- and association-analysis method without defined pedigrees. The corrected single-marker test also clearly demonstrated that family-based association tests had a higher power than population-based association tests (Figure 1B). Second, when the pedigrees have more complex structures, the rare risk variants will be more enriched in the pedigrees; therefore, such pedigrees will provide more information of coinheritance of rare risk variants with diseases in families, and hence, they will have more power to detect associations. Third, we also observed that the three-generational family group 2, nuclear family group 2, and sib-pair group 2 had higher power than the corresponding three-generational family group 1, nuclear family group 1, and sib-pair group 1, where each family in group 2 had more affected individuals than in group 1. We also observed the same patterns in Figures 3 and 4, which show the power of four statistics as a function of the proportion of risk variants, assuming 1,800 sampled individuals.
Figure 1.
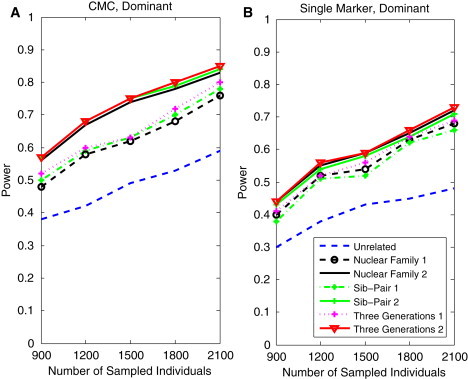
Power Curves of the Family-Based CMC and Single-Marker Statistics as a Function of Sample Size
(A) The power curves of the family-based CMC (variants with frequencies ≤ 0.005 were collapsed) statistic as a function of the total number of individuals at the significance level in the test under seven settings: unrelated individuals in cases-controls study, nuclear family groups 1 and 2, sib-pair groups 1 and 2, and three-generational family groups 1 and 2, assuming the dominant model, 20% of the risk variants, and a baseline penetrance of 0.01.
(B) The power curves of the corrected single-marker statistic as a function of the total number of individuals at the significance level in the test under seven settings: unrelated individuals in cases-controls study, nuclear family groups 1 and 2, sib-pair groups 1 and 2, and three-generational family groups 1 and 2, assuming the dominant model, 20% of the risk variants, and a baseline penetrance of 0.01.
Figure 2.
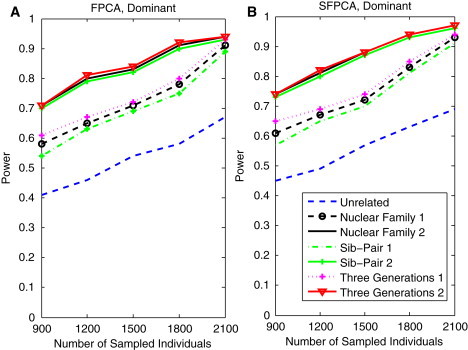
Power Curves of the Family-Based FPCA and SFPCA Statistics as a Function of Sample Size
(A) The power curves of the family-based FPCA statistic as a function of the total number of individuals at the significance level in the test under seven settings: unrelated individuals in cases-controls study, nuclear family groups 1 and 2, sib-pair groups 1 and 2, and three-generational family groups 1 and 2, assuming the dominant model, 20% of the risk variants and a baseline penetrance of 0.01.
(B) The power curves of the family-based SFPCA statistic as a function of the total number of individuals at the significance level in the test under seven settings: unrelated individuals in cases-controls study, nuclear family groups 1 and 2, sib-pair groups 1 and 2, and three-generational family groups 1 and 2, assuming the dominant model, 20% of the risk variants, and a baseline penetrance of 0.01.
Figure 3.
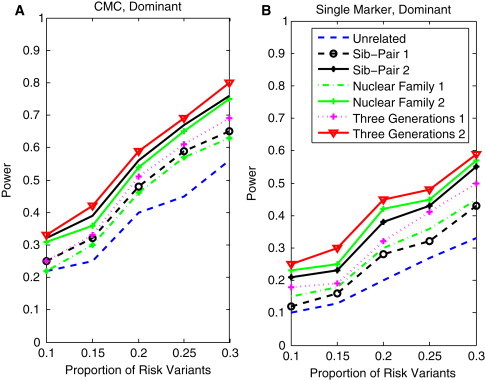
Power of Family-Based CMC and Single-Marker Statistics as a Function of the Proportion of Risk Variants
(A) The power curves of the family-based CMC (variants with frequencies ≤ 0.005 were collapsed) statistic as a function of the proportion of risk variants at the significance level in the test under seven settings: unrelated individuals in cases-controls study, nuclear family groups 1 and 2, sib-pair groups 1 and 2, and three-generational family groups 1 and 2, assuming the dominant model, a total of 1,800 sampled individuals, and a baseline penetrance of 0.01.
(B) The power curves of the corrected single-marker statistic as a function of the proportion of rare variants at the significance level in the test under seven settings: unrelated individuals in cases-controls study, nuclear family groups 1 and 2, sib-pair groups 1 and 2, and three-generational family groups 1 and 2, assuming the dominant model, a total of 1,800 sampled individuals, and a baseline penetrance of 0.01.
Figure 4.
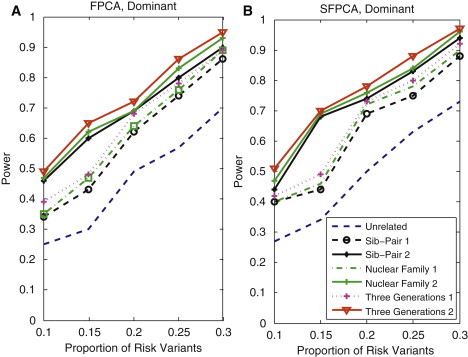
Power Curves of Family-Based FPCA and SFPCA Statistics as a Function of the Proportion of Risk Variants
(A) The power curves of the family-based FPCA statistic as a function of the proportion of risk variants at the significance level in the test under seven settings: unrelated individuals in cases-controls study, nuclear family groups 1 and 2, sib-pair groups 1 and 2, and three-generational family groups 1 and 2, assuming the dominant model, a total of 1,800 sampled individuals, and a baseline penetrance of 0.01.
(B) The power curves of the family-based SFPCA statistic as a function of the proportion of rare variants at the significance level in the test under seven settings: unrelated individuals in cases-controls study, nuclear family groups 1 and 2, sib-pair groups 1 and 2, and three-generational family groups 1 and 2, assuming the dominant model, a total of 1,800 sampled individuals, and a baseline penetrance of 0.01.
To compare the power of five family-based statistics, SFPCA, FPCA, CMC, the generalized , and the single-marker , wherein we used permutation to adjust for multiple testing of three family structures, we present Figures 5 and 6, which show the power curves of five statistics as a function of the total number of sampled individuals in the pedigrees for three-generational family group 1, sib-pair group 1, nuclear family group 1 and three-generational family group 3 that has 1/3 affected individuals in its pedigrees. The power of the five statistics for the three-generational family group 2, sib-pair group 2, nuclear family group 2, and unrelated individuals are shown in Figures S1–S4 (available online), respectively. From these results, we observed that the family-based SFPCA had the highest power for any family structure and sample size. We also observed that the corrected single-marker test had the lowest power in all settings. This demonstrates that, similar to population-based association studies, the classical variant-by-variant paradigm of linkage and association analysis designed for common variants may also have low power to test the association of rare variants in family-based association studies.
Figure 5.
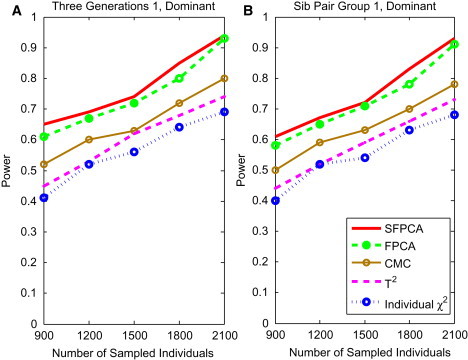
Power of Tests as a Function of Sample Sizes for Group 1 Three-Generational Family and Sib-Pair
(A) The power curve of five family-based statistics: SFPCA, FPCA, CMC, generalized , and individual statistic for three-generational family group 1 as a function of the total number of individuals at the significance level under the dominant model, assuming 20% of risk variants and a baseline penetrance of 0.01.
(B) The power curve of five family-based statistics: S FPCA, FPCA, CMC, generalized , and individual statistic for sib-pair group 1 as a function of the total number of individuals at the significance level under the dominant model, assuming 20% of risk variants and a baseline penetrance of 0.01.
Figure 6.
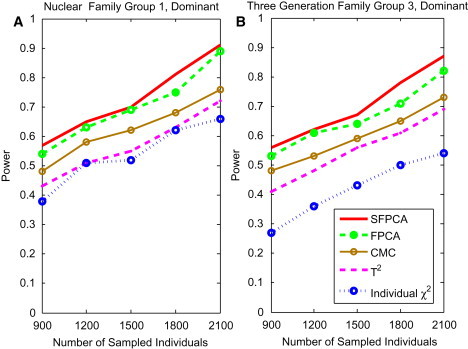
Power of Tests as a Function of Sample Sizes for Group 1 Nuclear Family and Group 2 Three-Generational Family
(A) The power curve of five family-based statistics: SFPCA, FPCA, CMC, generalized , and individual statistic for nuclear family group 1 as a function of the total number of individuals at the significance level under the dominant model, assuming 20% of risk variants and a baseline penetrance of 0.01.
(B) The power curve of five family-based statistics: SFPCA, FPCA, CMC, generalized , and individual statistic for the three-generational family group 3 as a function of the number of sampled individuals at the significance level under the dominant model, assuming 20% of risk variants and a baseline penetrance of 0.01.
To study the sensitivity of these methods to the number of affected individuals, we performed simulations for three-generational family group 3 (wherein only 1/3 of individuals in the family were affected). The results are shown in Figure 6B. Although the power of the test statistics was reduced, the power pattern of all statistics did not change. This is also true for other types of families (data not shown).
Next, we studied the impact of the proportion of risk variants on the power. Figures 7 and 8A show the power curves of five statistics, SFPCA, FPCA, CMC, the generalized , and the corrected single-marker , as a function of the proportion of risk-increasing variants for testing the association of 189 rare variants with disease, under the dominant disease model and at the significance level , for three-generational family group 1, sib-pair group 1, and nuclear family group 1 with 1,800 individuals assigned as affected and 1,800 individuals assigned as unaffected. The power of five statistics for the three-generational family group 2, sib-pair group 2, nuclear family group 2, and unrelated individuals are shown in Figures S5–S8, respectively. Similar to data shown in Figures 5, 6, and S1–S4, we observed that the family-based SFPCA had the highest power in every situation considered. We also observed that power differences between the SFPCA statistic and the corrected single-marker test were much larger than those between the CMC method and the corrected single-marker test. The difference in power between the newly developed statistics such as FPCA and CMC, originally designed for testing association of rare variants, and the corrected single-marker test, originally proposed for testing association of common variants in population-based association studies, tends to become larger as the proportion of risk variants increases in family-based association studies, in general.
Figure 7.
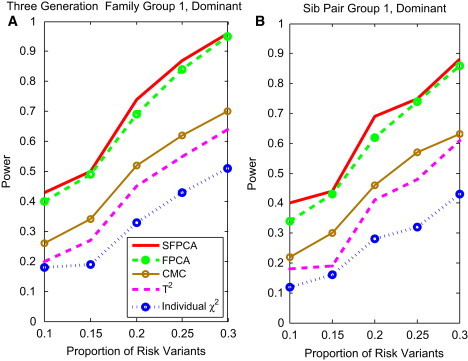
Power of Tests as a Function of the Proportion of Risk Variants for Group 1 Three-Generational Family and Sib-Pair
(A) The power curve of five family-based statistics: SFPCA, FPCA, CMC, generalized , and individual statistic for the three-generational family group 1 as a function of the proportion of risk variants at the significance level under the dominant model, assuming a total of 1,800 sampled individuals and a baseline penetrance of 0.01.
(B) The power curve of five family-based statistics: SFPCA, FPCA, CMC, generalized , and individual statistic for sib-pair group 1 as a function of the proportion of risk variants at the significance level under the dominant model, assuming a total of 1,800 sampled individuals and a baseline penetrance of 0.01.
Figure 8.
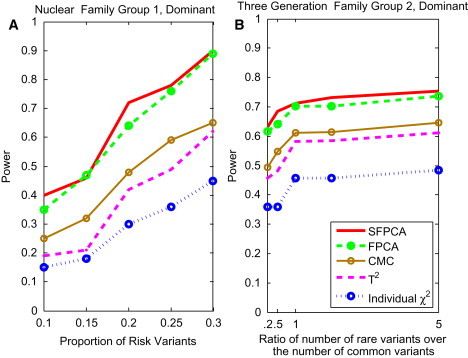
Power of Tests for the Proportion of Risk Variants for Group 1 Nuclear Family and Group 2 Three-Generational Family
(A) The power curve of five family-based statistics: SFPCA, FPCA, CMC, generalized , and individual statistic for nuclear family group 1 as a function of the proportion of risk variants at the significance level under the dominant model, assuming a total of 1,800 sampled individuals and a baseline penetrance of 0.01.
(B) The power curve of five family-based statistics: SFPCA, FPCA, CMC, generalized , and individual statistic for three-generational family group 2 as a function of the ratio of the number of rare risk variants over the number of common risk variants at the significance level under the dominant model, assuming a total of 1,500 sampled individuals and a baseline penetrance of 0.01.
To study how the distribution of variants affects the power, we plotted Figure 8B, which shows the power as a function of the ratio of the number of rare risk variants over the number of common risk variants for three-generational family group 2, wherein 1,500 individuals were sampled. Figure 8B shows that as the ratio of the number of rare risk variants over the number of common risk variants increases, the power of tests will increase. This shows that the contribution of rare variants is larger than that of common variants. This power pattern will hold for other scenarios.
To examine the impact of the direction of the association of rare alleles with disease risk on the power of the tests, we assumed that the genomic region being tested included both risk and protective variants. We randomly selected 10% of the variants as risk variants and 10% of the variants as protective variants. Figure 9 shows the power curves of the five statistics, S FPCA, FPCA, CMC, the generalized , and the corrected single-marker , for three-generational family group 2, under the dominant model and at the significance level , as a function of the total number of sampled individuals in the pedigrees. The power patterns of the five statistics for testing association of rare variants for other family structures were similar (data not shown). These results clearly demonstrated that the power of the SFPCA was the highest, followed by the classical nonsmooth FPCA. We also observed that as sample size increases, the SFPCA and FPCA statistics were less sensitive to the direction of the association of rare alleles than were other statistics.
Figure 9.
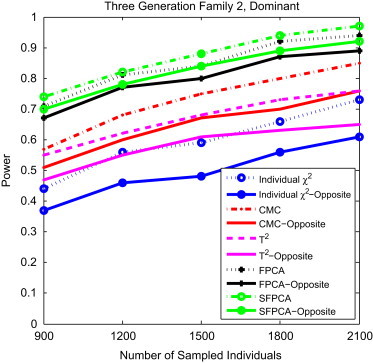
Power Comparison of Tests for Group 2 Three-Generational Family under Opposite Directions of Association
The power comparison of five family-based statistics: SFPCA, FPCA, CMC, generalized , and individual statistic for three-generational family group 2 under opposite directions of association as a function of the total number of individuals at the significance level under the dominant model, assuming 20% of the risk variants in one direction of association, 10% of risk variants and 10% of protective variants in two opposite directions of association, and a baseline penetrance of 0.01.
Application to a Real Data Example
For further evaluation of their performance, five family-based association test statistics were applied to the FHS for cardiovascular disease (CVD) that includes coronary heart disease, stroke, heart failure, and atrial fibrillation. FHS is a prospective epidemiological cohort study established in 1948 and designed to evaluate risk factors for CVD. A total of 5,226 individuals were genotyped with the Affymetrix GeneChip Human Mapping 500K ArraySet.We included 1,603 individuals (267 individuals with CVD and 1,336 controls) from 462 pedigrees in our analysis.22 The data were downloaded from dbGAP. We analyzed the association of genes with at least three SNPs with a MAF of less than 0.05. A total of 2,913 genes with 29,756 SNPs were analyzed. The p value for declaring association after Bonferroni correction was for multiple tests. The results of five family-based association tests, wherein the p value for the corrected single-marker statistic was obtained by permutation, are summarized in Table 4. We found that four genes reached genome-wide significance () with the SFPCA test. Table 4 shows that the SFPCA statistic had the lowest p values among the five tests, followed by the FPCA test statistic. It is also noted that each gene in Table 4 had at least one SNP with a small p value, but the SFPCA and FPCA tests that combine the single-marker test with the group test had a smaller p value than the single-marker test with correction for multiple tests. To further reveal the relationships between the structure of rare variants within the gene and the SFPCA test, we present Figure S9, which shows the LD pattern of nine rare variants within the gene CRY1 and their p values from individual tests for the association of a single SNP with disease by the family-based corrected single-marker test. Seven of these nine SNPs showed mild significance and formed two haplotype blocks with strong LD. The strong LD among the seven SNPs may imply that these variants are of recent origin. CRY1 is a circadian gene and is involved in breast cancer23 and chronic lymphocytic leukemia.24 NOX3 contributes to coronary endothelial dysfunction in the failing heart25 and is involved in inflammation.26 BOMB is associated with signals for lipids and apolipoproteins,27 and MRPS18C helps with protein synthesis within the mitochondrion and is involved in AIDS progression.28 FAM175A is involved in DNA repair29 and is a new candidate breast cancer-susceptibility gene.30
Table 4.
p Values of Five Family-Based Statistics for Testing Association with CVD
| Gene | Number of SNPs |
p Value |
|||||
|---|---|---|---|---|---|---|---|
| SFPCA | FPCA | CMC | T2 | Individual(Permutation) | Individual(Minimum) | ||
| CRY1 | 10 | 1.20 × 10−05 | 1.29 × 10−04 | 3.77 × 10−04 | 5.97 × 10−04 | 1.00 × 10−03 | 9.98 × 10−05 |
| NOX3 | 5 | 1.25 × 10−05 | 1.60 × 10−04 | 2.38 × 10−01 | 2.87 × 10−04 | 3.00 × 10−03 | 7.50 × 10−04 |
| BOMB | 5 | 1.60 × 10−05 | 2.07 × 10−03 | 2.26 × 10−03 | 2.26 × 10−03 | 1.00 × 10−03 | 1.02 × 10−03 |
| MRPS18C | 12 | 1.70 × 10−05 | 2.08 × 10−03 | 3.52 × 10−01 | 3.52 × 10−01 | 5.00 × 10−03 | 1.81 × 10−03 |
| FAM175A | 9 | 1.93 × 10−05 | 1.93 × 10−03 | 2.07 × 10−01 | 2.07 × 10−01 | 4.00 × 10−03 | 1.80 × 10−03 |
, individual test; CMC, combined multivariate and collapsing method; T2, generalized T2 test; FPCA, functional principal-component analysis; SFPCA, smoothed FPCA.
For illustration of the application of the family-based association tests for common variants, the proposed statistics were applied to childhood-onset asthma studies.31 A total of 206 nuclear families (MRC-A), which included 285 sib-pairs, seven half sib-pairs, and three singletons (counting all possible siblings), 420 individuals with childhood asthma, and 428 unaffected individuals, were sampled through a proband with severe childhood-onset asthma (data were kindly provided by Dr. Liming Liang, Department of Epidemiology and Biostatistics, Harvard University). The parents and children in the MRC-A panel were typed with the Illumina Sentrix Human-1 Genotyping 10K BeadChip. A total of ten SNPs with MAF ≥ 0.18 in Table 1 of the Moffatt et al. paper31 were included in this analysis. Table 5 summarizes p values of five family-based statistics for testing the association of ORMDL3, which harbors common variants with childhood-onset asthma. Given that all SNPs in the analysis were common variants, no SNPs in ORMDL3 should be grouped in the CMC test. Therefore, p values for both the CMC method and the T2 test were the same. Similar to in Table 4, we also observed that the SFPCA statistic had the lowest p values among the five tests, followed by the FPCA test statistic. Four of ten SNPs showed significant association, with all p values ≤ 0.015, as assessed by a family-based corrected single-marker test (data not shown). The association of ORMDL3 with childhood-onset asthma was discovered in the MRC-A study and also confirmed in an independent replication study.31 The association of ORMDL3 was also supported by a gene expression study. It was reported that the SNPs in ORMDL3 showed strong association (p < 10−22) in cis with expression levels of ORMDL3.31
Table 5.
p Values of Five Family-Based Statistics for Testing the Association of ORMDL3 with Childhood-Onset Asthma
| SFPCA | FPCA | CMC | T2 | Individual(Permutation) | Individual(Minimum) |
|---|---|---|---|---|---|
| 7.87 × 10−07 | 4.39 × 10−06 | 1.46 × 10−03 | 1.46 × 10−03 | 2.35 × 10−02 | 1.37 × 10−03 |
, individual test; CMC, combined multivariate and collapsing method; T2, generalized T2 test; FPCA, functional principal-component analysis; SFPCA, smoothed FPCA.
Discussion
Association studies can be carried out either by case-control studies of unrelated individuals or by family-based designs. Both designs have their merits and limitations. However, since it was demonstrated in 1996 that association studies are often more powerful than linkage analyses,32 population-based association studies have become the current paradigm for the genetic studies of complex diseases. In the past several years, several authors12,13,33 have challenged the current genetic-study practice that takes population-based association analysis as the only paradigm for genetic studies of complex diseases. There have been an increasing number of debates regarding which study design, population-based or family-based, is the choice design for identifying association of rare variants. One of the purposes of this report is to address several issues in devising optimal strategies for association analysis of rare variants.
The first issue is to develop a simple and general analytical framework that can unify both population-based and family-based case-control association analysis. The traditional linkage-analysis methods, whether parametric or nonparametric, are complex, difficult to collectively analyze across multiple variants, and require intensive computations. The current popular statistical methods for population-based association studies are simple, but often assume that the selected samples are independent. Thus, these methods are unable to analyze correlated family data with rare variants. Recently, case-control association tests have been extended to include related individuals from structured populations.16 Case-control association testing with population and pedigree structure, referred to herein as family-based case-control association testing, can be applied to (1) an isolated population in which individuals may be related, (2) an admixed population, (3) pedigrees sampled with a single population, and (4) pedigrees sampled from structured populations. However, the recently developed family-based case-control association analysis can test the association of a single variant or of multiple unlinked variants. It is mainly designed for testing association of common variants. To overcome these limitations, we extend family-based case-control association tests from a single variant to multiple linked or unlinked variants. An essential element in the family-based case-control association test statistics is calculation of the covariance matrix of genomic variants of the related individuals. The current methods can only calculate the covariance matrix of a single variant or multiple unlinked variants of the related individuals. We derive two new formulas to decompose the covariance matrix. One decomposes the covariance matrix of multiple linked variants of related individuals into the Kronecker product of their corresponding covariance matrix of unrelated individuals and the kinship matrix of related individuals. Another decomposes the covariance matrix of functional principal-component scores that are derived from genotype profiles of related individuals into the Kronecker product of their corresponding covariance matrix of the functional principal-component scores generated from unrelated individuals and the kinship matrix of the related individuals. This lays down the foundation for developing family-based statistics. Then, we extend the generalized test and FPCA from independent samples to dependent samples. In the presence of only unrelated individuals, the kinship matrix becomes an identity matrix. Therefore, all statistics for population-based case-control association studies are our special cases. We have successfully developed a general framework that can unify both population-based and family-based case-control association tests. The proposed methods can take the combination of data from pedigrees with different relationship structure and case-control samples from populations.
The second issue is to extend statistics for testing the association of rare variants from the population-based approach to the family-based approach. In the past several years, a number of new population-based statistics for testing the association of rare variants have been developed. We extend the generalized statistic, CMC method, FPCA, and SFPCA statistics that are developed for population samples to the pedigree data or mixed pedigree and unrelated individual data sampled from the populations. We show that statistics that compare differences in frequencies of alleles, collapsed variables, or functional principal-components scores between affected and unaffected individuals in pedigrees can be decomposed into the product of their corresponding statistics for population-based association tests and correction factor that accounts for pedigree and population structure. Thus, any population-based statistics for association studies can be extended to family-based association tests by multiplying their statistics by a common correction factor that depends on kinship coefficients and cryptic relatedness. This general approach provides a bridge between population-based association tests and family-based association tests.
The third issue is the validity of statistics for testing the association of variants in the presence of pedigree structure. Using large simulations, we show that the type I error rates of the FPCA and SFPCA statistics that use genotype data to estimate the relatedness of individuals were not significantly different from there nominal levels in the presence of pedigree structures and population structures, including admixed populations.
The fourth issue is the power of the tests and choice of the designs. The challenge that arises from testing the association of rare variants is the power of the tests. Due to the low frequency of rare variants, many statistics suffer from low power of detection of the association of rare variants. One strategy to improve the power of the tests is to enrich rare variants in the samples. As we expected, the rare risk variants are enriched in families. By using large simulations, we show that, given an equal number of sampled individuals, the family-based association studies have a much higher power than the population-based association studies for all statistics and in all settings. We also observe that the more complex the pedigree structure in the samples, the higher the power for testing the association of rare variants. The families with more affected individuals can provide more enrichment of rare risk variants and gain more power to detect association. Another remarkable feature of family-based association studies is that unlike in population-based association studies where the group tests will lose power if the opposite association directions exist among the collapsed rare variants, the simultaneous presence of risk and protective variants has less impact on the power of the family-based association tests.
The difficulties in identifying association of rare variants and the high cost of sequencing samples illustrate the need for more powerful statistical methods for detection of the association of variants. By using simulations, we compare the power of the corrected single-marker test, CMC, the generalized statistic, the FPCA, and the SFPCA statistics. We find that the SFPCA statistic had the highest power among five compared statistics in any setting, and the difference in power between the SFPCA statistic and other test statistics increased as the proportion of risk variants or sample sizes increased. The results in this report are quite preliminary. Due to space limitations, we have not presented the type I error rates and power of the developed statistics for testing the association of common variants or both rare and common variants. In our simulations, the empirical type I error rates of both smoothed and unsmoothed FPCA are not significantly deviated from nominal levels. Their power is still much higher than that of other tests (data not shown).
The fifth issue is how to reduce the sequencing errors and effectively deal with missing value problems that often arise from NGS. Given that the transmission pattern in the pedigrees easily allows the correction of sequencing errors, and the genotype data in other members of the pedigrees provide useful information to infer the missing genotypes of other individuals in the pedigrees, family-based association studies provide a powerful tool to overcome high sequencing-error rates and the problems with large proportions of missing values inherent in NGS technologies.
To demonstrate the feasibility of the family-based statistics for testing the association of rare variants with the disease, we apply the proposed methods to FHS and childhood-onset asthma studies. Our results showed that although variant-by-variant analysis could not identify the rare variants that were significantly associated with CVD, the family-based SFPCA identified five significantly associated genes after Bonferroni correction for multiple tests by collectively testing the association of multiple rare variants with mild association within the gene. However, the results presented need to be interpreted with caution. The number of SNPs within a gene is small due to poor coverage by microarray. To our knowledge, results of the FHS 500 K project have never been published. It is difficult to validate our findings, although five identified genes are biologically related with CVD according to the reports in the literature.27 In childhood-onset asthma studies, we confirmed the significant association of ORMDL3, which harbors common variants related to childhood-onset asthma. In the near future, exome- or whole-genome-sequencing data with pedigrees are expected to become available, and evaluation of our methods with sufficient sources will then be possible.
NGS has the potential to discover millions of rare variants and make it feasible to systematically search for the entire allelic spectrum of genetic variants associated with diseases. A great challenge raised by NGS is the development of analytical methods and study designs with sufficient power to identify association of variants with disease. The methods presented here are simple extensions of population-based-association-test statistics to family-based studies, on the basis of comparing differences in frequency of alleles or collapsed alleles, or functional principal-component scores. Other approaches to the extension of population-based association tests to family-based tests, such as the quasi-likelihood approach, may be more powerful. However, the presented general framework that can unify population-based and family-based association analysis provides a platform to compare different study designs. Computations of developed family-based association tests are almost as simple as the population-based association tests.
Recently, four Texas-based genome researchers8 proposed a unified genetic model for human diseases. They assumed that the common variants segregating within a population arise from remote ancestors and the rare variants segregating in the pedigree arise from recent ancestors. They hypothesized that genetic factors that cause diseases include common variants, rare variants, mutations inherent in the parents, and de novo variants. They also broke down the artificial boundaries between categories of human diseases and combined complex diseases, Mendelian diseases, chromosomal syndromes, and genomic disorders into one continuum disease model. The unified genetic model requires integration of various disease-risk variants in the population, pedigrees, and individuals. This raises a great analytical challenge for the use of the unified genetic model to unravel the genetic architecture of complex diseases. Our results in this report are preliminary. Our intention is to stimulate further discussion regarding the study designs and analytical methods of association studies with next-generation-sequencing data as well as the search for new analytical platforms with which to use the unified genetic model for identification of the genetic variants that underlie diseases.
Acknowledgments
The project was supported by grants 1R01AR057120-01, 1R01HL106034-01, and 1U01HG005728-01 from the National Institutes of Health. We thank the anonymous reviewers for their helpful comments.
The Framingham Heart Study is conducted and supported by the National Heart, Lung, and Blood Institute (NHLBI) in collaboration with Boston University (contract no. N01-HC-25195). This manuscript was not prepared in collaboration with investigators of the Framingham Heart Study and does not necessarily reflect the opinions or views of the Framingham Heart Study, Boston University, or NHLBI. Funding for SNP Health Association Resource (SHARe) genotyping was provided by NHLBI contract N02-HL-64278.
Appendix A
Let
We define similarly. Then, we have
Define
Let be the inbreeding coefficient of individual be the kinship coefficient between individuals Computing expectations by conditioning, we have
| (Equation A1) |
Similarly, we have
| (Equation A2) |
By definition of the covariance between variables , we obtain
| (Equation A3) |
Substituting Equations A1 and A2 into Equation A3, we obtain
| (Equation A4) |
Similarly, we have
| (Equation A5) |
Combining Equations A4 and A5, we obtain
| (Equation A6) |
where
| (Equation A7) |
Through a similar argument as that for Equation A4, we have
| (Equation A8) |
Combining Equations A6 and A8 leads to
| (Equation A9) |
where
Appendix B
First, we calculate . Computing expectation by conditioning, we obtain
| (Equation B1) |
where is a covariance function of the genotype indicator variables between genomic positions s and t.
Similarly, we have
| (Equation B2) |
| (Equation B3) |
and
| (Equation B4) |
From stochastic calculus,34 we can obtain
| (Equation B5A) |
| (Equation B5B) |
| (Equation B5C) |
| (Equation B5D) |
Combining Equations B5A–B5D, we obtain the covariance between functional principal-component scores for the same individual without inbreeding:
| (Equation B6) |
Using Equations B1–B4 and B6, we can obtain the covariance of the functional principal-component scores between a pair of individuals:
| (Equation B7) |
Similarly, considering inbreeding, we can prove that
| (Equation B8) |
Define the covariance matrix of the vector of functional principal-component score ξ as
However, we have
| (Equation B9) |
and
| (Equation B10) |
Let
Then, by combining Equations B9 and B10, we obtain
| (Equation B11) |
Let
Note that
Therefore, we have
| (Equation B12) |
Combining Equations B12, 22, and 23, we obtain
| (Equation B13) |
Supplemental Data
Web Resources
The URLs for data presented herein are as follows:
Bioconductor: Open Source Software for Bioinformatics, http://www.bioconductor.org/
FPCA for Association Studies, https://sph.uth.tmc.edu/hgc/faculty/xiong/software-A.html
NCBI Gene Expression Omnibus, http://www.ncbi.nlm.nih.gov/geo/
References
- 1.Rakyan V.K., Down T.A., Balding D.J., Beck S. Epigenome-wide association studies for common human diseases. Nat. Rev. Genet. 2011;12:529–541. doi: 10.1038/nrg3000. [DOI] [PMC free article] [PubMed] [Google Scholar]
- 2.Neale B.M., Rivas M.A., Voight B.F., Altshuler D., Devlin B., Orho-Melander M., Kathiresan S., Purcell S.M., Roeder K., Daly M.J. Testing for an unusual distribution of rare variants. PLoS Genet. 2011;7:e1001322. doi: 10.1371/journal.pgen.1001322. [DOI] [PMC free article] [PubMed] [Google Scholar]
- 3.Bansal V., Libiger O., Torkamani A., Schork N.J. Statistical analysis strategies for association studies involving rare variants. Nat. Rev. Genet. 2010;11:773–785. doi: 10.1038/nrg2867. [DOI] [PMC free article] [PubMed] [Google Scholar]
- 4.Chaisson M.J., Brinza D., Pevzner P.A. De novo fragment assembly with short mate-paired reads: Does the read length matter? Genome Res. 2009;19:336–346. doi: 10.1101/gr.079053.108. [DOI] [PMC free article] [PubMed] [Google Scholar]
- 5.Johnson P.L., Slatkin M. Accounting for bias from sequencing error in population genetic estimates. Mol. Biol. Evol. 2008;25:199–206. doi: 10.1093/molbev/msm239. [DOI] [PubMed] [Google Scholar]
- 6.Lynch M. Estimation of allele frequencies from high-coverage genome-sequencing projects. Genetics. 2009;182:295–301. doi: 10.1534/genetics.109.100479. [DOI] [PMC free article] [PubMed] [Google Scholar]
- 7.Pool J.E., Hellmann I., Jensen J.D., Nielsen R. Population genetic inference from genomic sequence variation. Genome Res. 2010;20:291–300. doi: 10.1101/gr.079509.108. [DOI] [PMC free article] [PubMed] [Google Scholar]
- 8.Lupski J.R., Belmont J.W., Boerwinkle E., Gibbs R.A. Clan genomics and the complex architecture of human disease. Cell. 2011;147:32–43. doi: 10.1016/j.cell.2011.09.008. [DOI] [PMC free article] [PubMed] [Google Scholar]
- 9.Li B., Leal S.M. Methods for detecting associations with rare variants for common diseases: application to analysis of sequence data. Am. J. Hum. Genet. 2008;83:311–321. doi: 10.1016/j.ajhg.2008.06.024. [DOI] [PMC free article] [PubMed] [Google Scholar]
- 10.Najmabadi H., Hu H., Garshasbi M., Zemojtel T., Abedini S.S., Chen W., Hosseini M., Behjati F., Haas S., Jamali P. Deep sequencing reveals 50 novel genes for recessive cognitive disorders. Nature. 2011;478:57–63. doi: 10.1038/nature10423. [DOI] [PubMed] [Google Scholar]
- 11.Chakravarti A. Genomics is not enough. Science. 2011;334:15. doi: 10.1126/science.1214458. [DOI] [PubMed] [Google Scholar]
- 12.Ott J., Kamatani Y., Lathrop M. Family-based designs for genome-wide association studies. Nat. Rev. Genet. 2011;12:465–474. doi: 10.1038/nrg2989. [DOI] [PubMed] [Google Scholar]
- 13.Choi Y., Wijsman E.M., Weir B.S. Case-control association testing in the presence of unknown relationships. Genet. Epidemiol. 2009;33:668–678. doi: 10.1002/gepi.20418. [DOI] [PMC free article] [PubMed] [Google Scholar]
- 14.Bourgain C., Hoffjan S., Nicolae R., Newman D., Steiner L., Walker K., Reynolds R., Ober C., McPeek M.S. Novel case-control test in a founder population identifies P-selectin as an atopy-susceptibility locus. Am. J. Hum. Genet. 2003;73:612–626. doi: 10.1086/378208. [DOI] [PMC free article] [PubMed] [Google Scholar]
- 15.Thornton T., McPeek M.S. Case-control association testing with related individuals: a more powerful quasi-likelihood score test. Am. J. Hum. Genet. 2007;81:321–337. doi: 10.1086/519497. [DOI] [PMC free article] [PubMed] [Google Scholar]
- 16.Thornton T., McPeek M.S. ROADTRIPS: case-control association testing with partially or completely unknown population and pedigree structure. Am. J. Hum. Genet. 2010;86:172–184. doi: 10.1016/j.ajhg.2010.01.001. [DOI] [PMC free article] [PubMed] [Google Scholar]
- 17.Xiong M., Zhao J., Boerwinkle E. Generalized T2 test for genome association studies. Am. J. Hum. Genet. 2002;70:1257–1268. doi: 10.1086/340392. [DOI] [PMC free article] [PubMed] [Google Scholar]
- 18.Luo L., Boerwinkle E., Xiong M. Association studies for next-generation sequencing. Genome Res. 2011;21:1099–1108. doi: 10.1101/gr.115998.110. [DOI] [PMC free article] [PubMed] [Google Scholar]
- 19.Yang J., Benyamin B., McEvoy B.P., Gordon S., Henders A.K., Nyholt D.R., Madden P.A., Heath A.C., Martin N.G., Montgomery G.W. Common SNPs explain a large proportion of the heritability for human height. Nat. Genet. 2010;42:565–569. doi: 10.1038/ng.608. [DOI] [PMC free article] [PubMed] [Google Scholar]
- 20.Lambert B.W., Terwilliger J.D., Weiss K.M. ForSim: a tool for exploring the genetic architecture of complex traits with controlled truth. Bioinformatics. 2008;24:1821–1822. doi: 10.1093/bioinformatics/btn317. [DOI] [PMC free article] [PubMed] [Google Scholar]
- 21.Li Y., Byrnes A.E., Li M. To identify associations with rare variants, just WHaIT: Weighted haplotype and imputation-based tests. Am. J. Hum. Genet. 2010;87:728–735. doi: 10.1016/j.ajhg.2010.10.014. [DOI] [PMC free article] [PubMed] [Google Scholar]
- 22.Larson M.G., Atwood L.D., Benjamin E.J., Cupples L.A., D'Agostino R.B., Sr., Fox C.S., Govindaraju D.R., Guo C.Y., Heard-Costa N.L., Hwang S.J. Framingham Heart Study 100K project: genome-wide associations for cardiovascular disease outcomes. BMC Med. Genet. 2007;8(Suppl 1):S5. doi: 10.1186/1471-2350-8-S1-S5. [DOI] [PMC free article] [PubMed] [Google Scholar]
- 23.Dai H., Zhang L., Cao M., Song F., Zheng H., Zhu X., Wei Q., Zhang W., Chen K. The role of polymorphisms in circadian pathway genes in breast tumorigenesis. Breast Cancer Res. Treat. 2011;127:531–540. doi: 10.1007/s10549-010-1231-2. [DOI] [PubMed] [Google Scholar]
- 24.Eisele L., Prinz R., Klein-Hitpass L., Nückel H., Lowinski K., Thomale J., Moeller L.C., Dührsen U., Dürig J. Combined PER2 and CRY1 expression predicts outcome in chronic lymphocytic leukemia. Eur. J. Haematol. 2009;83:320–327. doi: 10.1111/j.1600-0609.2009.01287.x. [DOI] [PubMed] [Google Scholar]
- 25.Zhang P., Hou M., Li Y., Xu X., Barsoum M., Chen Y.J., Bache R.J. NADPH oxidase contributes to coronary endothelial dysfunction in the failing heart. Am. J. Physiol. Heart Circ. Physiol. 2009;296:H840–H846. doi: 10.1152/ajpheart.00519.2008. [DOI] [PMC free article] [PubMed] [Google Scholar]
- 26.Kaur T., Mukherjea D., Sheehan K., Jajoo S., Rybak L.P., Ramkumar V. Short interfering RNA against STAT1 attenuates cisplatin-induced ototoxicity in the rat by suppressing inflammation. Cell Death Dis. 2011;2:e180. doi: 10.1038/cddis.2011.63. [DOI] [PMC free article] [PubMed] [Google Scholar]
- 27.Talmud P.J., Drenos F., Shah S., Shah T., Palmen J., Verzilli C., Gaunt T.R., Pallas J., Lovering R., Li K., ASCOT investigators. NORDIL investigators. BRIGHT Consortium Gene-centric association signals for lipids and apolipoproteins identified via the HumanCVD BeadChip. Am. J. Hum. Genet. 2009;85:628–642. doi: 10.1016/j.ajhg.2009.10.014. [DOI] [PMC free article] [PubMed] [Google Scholar]
- 28.Hendrickson S.L., Lautenberger J.A., Chinn L.W., Malasky M., Sezgin E., Kingsley L.A., Goedert J.J., Kirk G.D., Gomperts E.D., Buchbinder S.P. Genetic variants in nuclear-encoded mitochondrial genes influence AIDS progression. PLoS ONE. 2010;5:e12862. doi: 10.1371/journal.pone.0012862. [DOI] [PMC free article] [PubMed] [Google Scholar]
- 29.Yan J., Jetten A.M. RAP80 and RNF8, key players in the recruitment of repair proteins to DNA damage sites. Cancer Lett. 2008;271:179–190. doi: 10.1016/j.canlet.2008.04.046. [DOI] [PMC free article] [PubMed] [Google Scholar]
- 30.Osorio A., Barroso A., García M.J., Martínez-Delgado B., Urioste M., Benítez J. Evaluation of the BRCA1 interacting genes RAP80 and CCDC98 in familial breast cancer susceptibility. Breast Cancer Res. Treat. 2009;113:371–376. doi: 10.1007/s10549-008-9933-4. [DOI] [PubMed] [Google Scholar]
- 31.Moffatt M.F., Kabesch M., Liang L., Dixon A.L., Strachan D., Heath S., Depner M., von Berg A., Bufe A., Rietschel E. Genetic variants regulating ORMDL3 expression contribute to the risk of childhood asthma. Nature. 2007;448:470–473. doi: 10.1038/nature06014. [DOI] [PubMed] [Google Scholar]
- 32.Risch N., Merikangas K. The future of genetic studies of complex human diseases. Science. 1996;273:1516–1517. doi: 10.1126/science.273.5281.1516. [DOI] [PubMed] [Google Scholar]
- 33.Clerget-Darpoux F., Elston R.C. Are linkage analysis and the collection of family data dead? Prospects for family studies in the age of genome-wide association. Hum. Hered. 2007;64:91–96. doi: 10.1159/000101960. [DOI] [PubMed] [Google Scholar]
- 34.Henderson D., Plaschko P. World Scientific; New Jersey: 2006. Stochastic differential equations in science and engineering. [Google Scholar]
Associated Data
This section collects any data citations, data availability statements, or supplementary materials included in this article.