Abstract
In the current study, caffeic acid was an important metabolite in the highly copper-tolerant plant Elsholtzia splendens. Preparation and purification of caffeic acid were performed on the dried biomass of the plants by means of sonication/ethanol extraction, followed by purification using a macroporous resin (D101 type) column and silica gel chromatography. The faint-yellow caffeic acid product was yielded with a purity of 98.46%, and it was chemically identified from spectra of Fourier transform infrared spectroscopy (FTIR), proton nuclear magnetic resonance (1H NMR)/carbon nuclear magnetic resonance (13C NMR), and electrospray ionization mass spectrometry (ESI-MS). Caffeic acid is a possible product from the post-harvest processing of Elsholtzia splendens biomass.
Keywords: Caffeic acid, Purification, Post-processing, Copper tolerance, Elsholtzia splendens
1. Introduction
Caffeic acid is of particular interest due to its strong anti-oxidative properties in vitro (Zhao and Moghadasian, 2010; Sánchez-Alonso et al., 2011). It possesses both antioxidant and pro-oxidant properties and its pro-oxidant action may be an important mechanism of the anticancer and apoptosis inducing-properties (Maurya and Devasagayam, 2010). Studies indicate that caffeic acid also has a strong antitumor effect and may be a promising chemopreventive or chemotherapeutic agent (Chang et al., 2010). Antioxidants such as caffeic acid can be made to exert pro-oxidant effects in vitro under certain conditions involving the interaction with transition metal ions, thus reducing iron (III) and copper (II) ions to iron (II) and copper (I) ions, respectively. Elsholtzia splendens, belonging to the family Labiatae, was first recognized as a valuable copper indicator during a period of copper ore exploration in the 1950s in China (Xie and Xu, 1952). It is a dominant plant species on copper-enriched soils along the Yangtz River of China and could be regarded as a copper-adapted plant due to its rarity on normal soils (Tang et al., 1999; Peng et al., 2005). A small-scale phytoremediation trial (0.06 ha) of copper-contaminated soil in China (Peng and Yang, 2005; 2007) indicated that shoot biomass of 11 000‒16 000 kg/ha was reached in a growing season, and about 17 mg of copper per plant was removed from contaminated soil by the whole plant of E. splendens. A larger-scale phytoremediation (1.33 ha) of copper-contaminated soil in China has been ongoing using E. splendens. Moreover, E. splendens is traditionally used as a medicinal plant due to its pharmacological and anti-oxidative effects (Choi et al., 2007; Choi and Kim, 2008a; 2008b). Anti-oxidation and pro-oxidative actions of caffeic acid are hypothetically copper-dependent, and thus the metabolic process necessary to production of caffeic acid could be copper-dependent in E. splendens. Herein, high purity and high yield of caffeic acid product will be isolated from E. splendens biomass post-phytoremediation by means of sonication/ethanol extraction, followed by purification using a macroporous resin (D101 type) column and silica gel chromatography.
2. Materials and methods
2.1. Plant materials and extraction
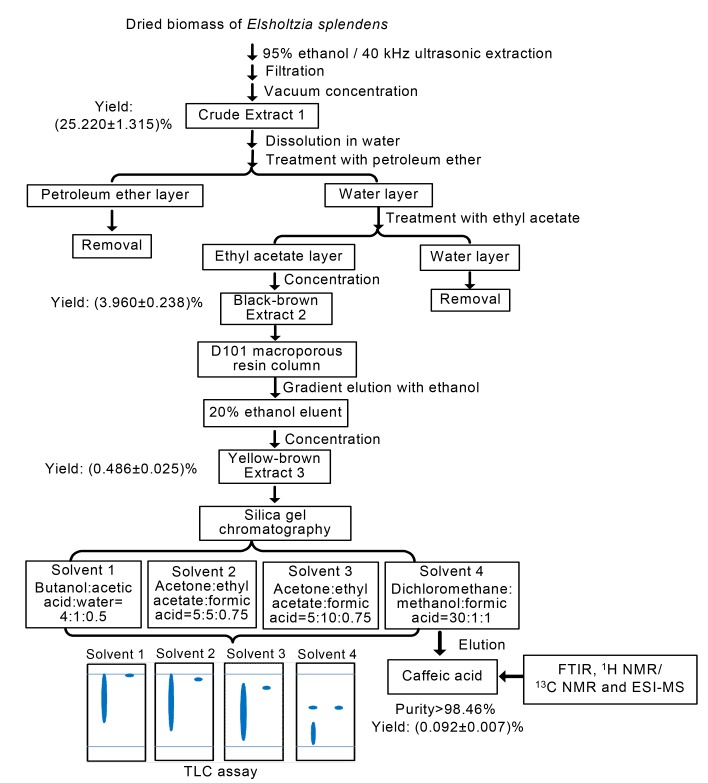
Flowering adult E. splendens plants were harvested during November 2010 from a copper-contaminated site located at the Fuyang County, Zhejiang Province of China. Plants were naturally air-dried, and then leaves and flowers were removed from mother plants, ground to powder, and sieved by a 100-mesh screen. The 95% ethanol extraction (5 L, 25 °C) for 24 h followed by sonication extraction (40 kHz, 25 °C) for 1 h was applied to the powders, and then the filtrate was concentrated to give the crude Extract 1. A solution was made of the crude Extract 1 and distilled water, and then treated with petroleum ether and ethyl acetate in turn (Fig. 1). The layers of ethyl acetate were concentrated to yield the black-brown Extract 2.
Fig. 1.
Optimized process for the extraction and purification of caffeic acid product from the dried biomass (flowers and leaves) of the highly copper-tolerant plant Elsholtzia splendens
2.2. Purification and chemical identification
A solution was made of the black-brown Extract 2 with distilled water and then mounted to the top of the cleaned macroporous resin column (D101 type). Elution with a water-ethanol step gradient was performed for the resin column. Then elution of 20% ethanol through the resin column was concentrated to give the yellow-brown Extract 3, which was for further purification by chromatography using silica gel (200‒300 mesh). Different organic solvents were used as elution for the silica gel column (Fig. 1). Better isolation for the solvent elution through silica gel was observed when a bright blue fluorescence occurred when assayed with thin layer chromatography (TLC) (R f=0.5) at 254 nm, and the grey-black dot appeared when exposed to 0.01 g/ml FeCl3. And then the elution was concentrated to yield the faint-yellow powder, which was dissolved in distilled water and vacuum-lyophilized by Labconco Freezen Systems to give the faint-yellow crystal (Fig. 1).
All the chemicals used were of analytical grade. Macroporous resin was purchased from Shanghai Mosu Chemicals Co. Ltd., China, and silica gel (H type) was from Qingdao Marine Chemical Factory, China. Infrared spectra were recorded with a Nicolet Nexus-670 Fourier transform infrared (FTIR) spectroscopy in the range of 500‒5000 cm−1 with a Ge/KBr beam splitter and a deuterated triglycine sulfate (DTGS) detector at room temperature. The wavenumber accuracy was 0.01 cm−1; 40 scans were recorded at a resolution of 1 cm−1 and averaged for the spectra. Nuclear magnetic resonance (NMR) spectra were recorded for 1H NMR at 500 MHz and 13C NMR at 125 MHz on a Bruker AVIII 500 MHz spectrometer. For 1H NMR, tetra-methylsilane (TMS) served as internal standard (δ=0) and data were reported as follows: chemical shift, integration, multiplicity (s=singlet, d=doublet, t=triplet, q=quartet, m=multiplet), and coupling constant in Hz. For 13C NMR, TMS (δ=0) was used as internal standard and spectra were obtained with complete proton decoupling. Mass spectrometry (MS) data were obtained using Waters-UPLC-TAD electrospray ionization mass spectrometry (ESI-MS). High performance liquid chromatography (HPLC) was performed on an Agilent Technology 1200 series, equipped with an eclipse XDB C18 column (4.6 mm×250 mm, 5 μm) in G1316A TCC thermostat-monitored column compartment and G1314B VWD ultraviolet (UV) detector (samples detected at 323 nm). Copper concentration was measured using an Agilent 7500a inductively coupled plasma-mass spectroscopy (ICP-MS).
2.3. Caffeic acid in plants under different copper levels
Seven-month-old E. splendens plants were harvested before flowering, in the copper-contaminated soil located at the Fuyang County, Zhejiang Province of China. Sonication extraction (40 kHz, 1 h) in 95% ethanol (20 ml, 25 °C) was applied to 1 g samples of powdered dried stems and leaves. After it was filtered through 0.22-μm membrane filters, the caffeic acid content in the supernatant was measured by HPLC. Meanwhile, the 0.2 g samples of powdered dried stems and leaves were digested completely with a mixture of nitric-perchloric acid (85%:15%), and copper concentrations in the digestion were measured using inductively coupled plasma-optical emission spectroscopy (ICP-OES; Model IRAS-AP, TJA). Data were analyzed statistically using analysis of variance (ANOVA), using least significant difference (LSD, P=0.05) to identify significant results.
3. Results and discussion
3.1. Caffeic acid in copper-tolerant plants
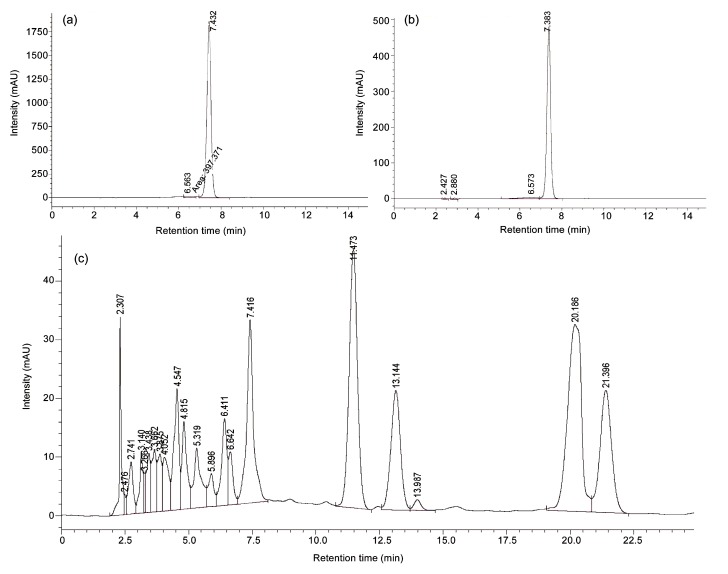
E. splendens is adapted to high copper toxicity in the environment. It is proposed (Fan et al., 2009) that it is the caffeic acid phenolate anion, instead of the parent molecule, that chelates with the copper (II) ion as a bidentate ligand to form caffeic acid phenolate anion/copper (II) chelate complex, hence facilitating the intramolecular electron transfer to form the corresponding caffeic acid semiquinone radical intermediate. The latter undergoes a second electron transfer with oxygen to form the corresponding o-quinone and a superoxide which could be dangerous for normal physiological requirements in organisms. Decreased caffeic acid and increased copper levels were observed in both stems and leaves (Table 1), indicating that metabolism of caffeic acid could be copper-dependent in above-ground tissues of E. splendens. In the current study, the peak of the standard caffeic acid was around 7.4 min in the HPLC graph (Fig. 2a), and therefore the content of caffeic acid in the above-ground tissues was (0.131±0.001)%, of the dried biomass of E. splendens, as calculated from the peak in HPLC graph (Fig. 2c).
Table 1.
Copper concentrations in soil and plant, and caffeic acid contents in seven-month-old E. splendens plants harvested in the copper-contaminated site located at the Fuyang County of Zhejiang Province, China
| Soil type | Copper in soil (mg/kg) | Copper in plant (mg/kg) |
Caffeic acid in plant (mg/kg) |
||
| Stem | Leaf | Stem | Leaf | ||
| Soil 1 | 4 464.30b | 162.15a | 230.57a | 977.50a | 2 244.37c |
| Soil 2 | 2 424.75c | 105.68b | 145.99b | 1 062.25a | 3 422.18a |
| Soil 3 | 22 507.20a | 138.44a | 108.34c | 450.90b | 2 915.32b |
Different letters among the treatments indicate significant differences at P=0.05 as determined by the Duncan’s multiple range test
Fig. 2.
HPLC graphs of the standard caffeic acid (a), the purified yellow crystal (b), and the 95% ethanol extraction (c) of the dried biomass (flowers and leaves) from the highly copper-tolerant plant Elsholtzia splendens
3.2. Purification and chemical identification of caffeic acid from copper-tolerant plants
In order to obtain high purity of caffeic acid from the water layers of the Extract 1 from the dried biomass (Fig. 1), a macroporous resin (D101 type) column was employed and then the eluent of 20% ethanol through resin was further purified by silica gel chromatography. Different solvents for the elution of silica gel column were used as follows: Solvent 1, butanol:acetic acid:water=4:1:0.5 (v/v/v, the same below); Solvent 2, acetone:ethyl acetate:formic acid=5:5:0.75; Solvent 3, acetone:ethyl acetate: formic acid=5:10:0.75; Solvent 4, dichloromethane: methanol:formic acid (CH2Cl2:CH3OH:HCOOH)=30:1:1. Formic acid has been found to effectively diminish the interference of impurities in the elution for silica gel, and thus the preferred solvent elution for isolation of caffeic acid by silica gel was dichloromethane:methanol:formic acid (CH2Cl2:CH3OH:HCOOH)=30:1:1 (Fig. 1).
The faint-yellow crystal was yielded with a purity of 98.46%, as seen from its peak around 7.4 min in the HPLC graph (Fig. 2b), exactly the same as that of the standard caffeic acid (Fig. 2a). The faint-yellow crystal was chemically identified as caffeic acid from the spectroscopic data of 1H NMR/13C NMR for the consistency with the standard caffeic acid, in terms of chemical shift, coupling constant, peak as well as hydrogen quantity for 1H NMR spectra, and chemical shifts of nine carbon atoms for 13C NMR spectra (Table 2).
Table 2.
Chemical identification of the faint-yellow crystal from spectra of 1H NMR/13C NMR
| Compound |
δ |
|
| 13C NMRa | 1H NMRb | |
| Faint-yellow crystal (98.46%) | 145.85 | |
| 145.63 | ||
| 113.97 | 6.79 (d; J=8.0 Hz; 2H) | |
| 121.66 | 6.95 (dd; J=2.0 Hz, 8.0 Hz; 2H) | |
| 126.68 | ||
| 114.43 | 7.05 (d; J=1.5 Hz; 2H) | |
| 148.27 | 7.55 (d; J=16.0 Hz; 2H) | |
| 115.35 | 6.23 (d; J=16.0 Hz; 2H) | |
| 169.86 | ||
| Standard caffeic acid (>99.0%) | 145.90 | |
| 145.56 | ||
| 113.84 | 6.95 (dd; J=2.0 Hz, 8.0 Hz; 2H) | |
| 121.77 | 6.79 (d; J=8.0 Hz; 2H) | |
| 126.55 | ||
| 114.25 | 7.06 (d; J=2.0 Hz; 2H) | |
| 148.24 | 7.55 (d; J=15.5 Hz; 2H) | |
| 115.26 | 6.24 (d; J=16.0 Hz; 2H) | |
| 169.90 | ||
In CD3OD
Measured at 125 MHz
Measured at 500 MHz
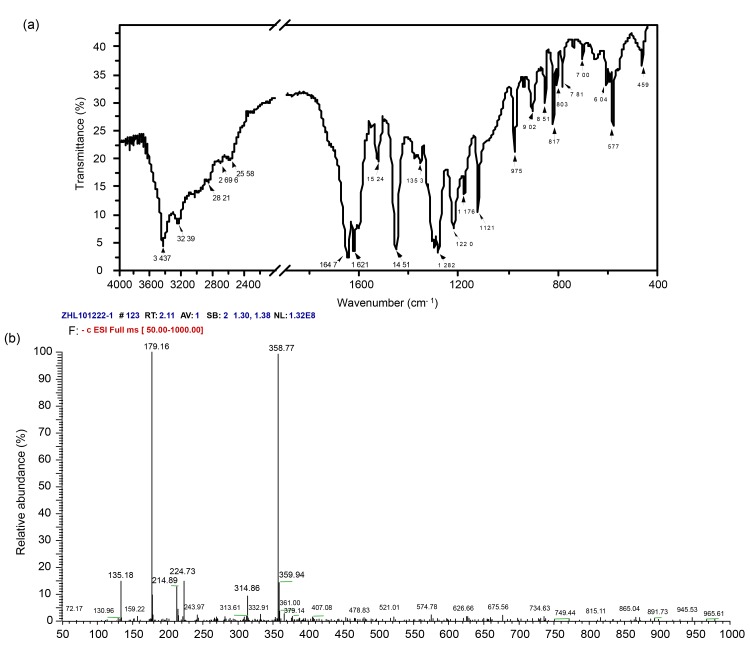
FTIR spectrum of the faint-yellow crystal (Fig. 3a, Table 3) showed that the strong peak at 3 437 cm−1 was attributed to the stretching absorption of hydrogen bonds between ‒OH groups; the weak peak at 3 239 cm−1 was attributed to the stretching vibration of benzene ring =C‒H group; the strong peak at 1 524 cm−1 was attributed to stretching vibration of benzene ring C=C group; the strong peak at 1 353 cm−1 was characteristic of O‒H bending vibration; and the middle peak at 1 220 cm−1 was attributed to C‒OH stretching vibration of phenol. Moreover, two strong peaks at 1 645 and 1 621 cm−1 were characteristics of the antisymmetry and symmetrical stretching vibrations of C=O in the ester group (O=C‒O), which were shifted to the low wavenumber as compared to the carbonyl of 1700 cm−1.
Fig. 3.
Spectra of FTIR (a) and ESI-MS (b) of caffeic acid product from the dried biomass (flowers and leaves) of the highly copper-tolerant plant Elsholtzia splendens
Table 3.
Chemical identification of the faint-yellow crystal from the spectrum of FTIR
| Wavenumber (cm−1) | Main attributes | Functional group |
| 2 500‒3 000 (m) | ‒O‒H stretching vibration | ‒COOH |
| 1 645 (s) | ‒C=O stretching vibration | ‒O‒C=O |
| 1 621 (s) | ‒C=C stretching vibration | ‒O‒C=O |
| 960‒980 (m) | =C‒H out-plane bending vibration | Ar‒C=C |
| 3 239 (w) | Benzene ring =C‒H stretching vibration | Benzene ring |
| 1 524 (s) | Benzene ring C=C stretching vibration | Benzene ring |
| 665‒900 (m) | Benzene ring =C‒H out-plane bending vibration | Benzene ring |
| 3 437 (s) | ‒O‒H stretching vibration | Phenol OH |
| 1 353 (s) | ‒O‒H bending vibration | Phenol OH |
| 1 220 (m) | ‒C‒OH stretching vibration | Phenol OH |
The wide band at 2 500‒3 000 cm−1 region composed of certain weak small peaks was attributed to the O‒H stretching vibration of the carboxyl group. FTIR spectra (Fig. 3a, Table 3) of the ester group (O=C‒O) and the carboxyl group indicated the formation of the molecular dimer because of their intermolecular hydrogen bond, which was further confirmed by ESI-MS spectra (Fig. 3b) that the main peak at [2M−1]−=358.77 (M is the molecular weight) was observed for the anion peak of this molecular dimer. As seen in ESI-MS spectra, the molecular weight was calculated to be 180.16 g/mol from the highest peak at [M−1]−=179.16 (Fig. 3b), for the faint-yellow crystal, which was the same as that of the standard caffeic acid. The determination of ICP-MS showed that there was no copper concentration in this faint-yellow caffeic acid product.
3.3. Extraction efficiency of caffeic acid from copper-tolerant plants
As shown in Fig. 1, sonication/ethanol extraction produced the crude Extract 1 with a yield of (25.220±1.315)%; treatment with petroleum ether and ethyl acetate produced the ethyl acetate Extract 2 with a yield of (3.960±0.238)%; gradient elution via macroporous resin column produced the Extract 3 with a yield of (0.486±0.025)%; and then purification via silica gel chromatography resulted in caffeic acid product with a yield of (0.092±0.007)% of the dried biomass. Thus, caffeic acid production could be an option to post-processing of E. splendens biomass from phytoremediation.
4. Conclusions
Caffeic acid product of purity of 98.46% was obtained, with a yield of (0.092±0.007)% of the dried biomass of E. splendens, by means of sonication/ethanol extraction, followed by purification using macroporous resin (D101 type) column and silica gel chromatography. Caffeic acid is a possible production to post-processing of E. splendens biomass from phytoremediation.
Footnotes
Project supported by the Zhejiang Provincial Qianjiang Talents for Science and Technology (No. 2011R10026), the Education Department of Zhejiang Province (No. Y201016563), the Research Funds from State Key Laboratory of Hydrology-Water Resources and Hydraulic Engineering (No. 2009490711), and the Fundamental Research Funds for the Central Universities, China
References
- 1.Chang WC, Hsieh CH, Hsiao MW, Lin WC, Hung YC, Ye JC. Caffeic acid induces apoptosis in human cervical cancer cells through the mitochondrial pathway. Taiwan J Obstet Gynecol. 2010;49(4):419–424. doi: 10.1016/S1028-4559(10)60092-7. [DOI] [PubMed] [Google Scholar]
- 2.Choi EJ, Kim GH. Effect of Elsholtzia splendens extracts on the blood lipid profile and hepatotoxicity of the mice. Food Sci Biotechnol. 2008;17(2):413–416. [Google Scholar]
- 3.Choi EJ, Kim GH. In vivo antioxidative characteristics of extracts from the aromatic herb Elsholtzia splendens . Food Sci Biotechnol. 2008;17(5):1128–1130. [Google Scholar]
- 4.Choi EJ, Lee YS, Kim GH. Antioxidative characteristics of extracts from aromatic herb Elsholtzia splendens . Food Sci Biotechnol. 2007;16(3):489–492. [Google Scholar]
- 5.Fan GJ, Jin XL, Qian YP, Wang Q, Yang RT, Dai F, Tang JJ, Shang YJ, Cheng LX, Yang J, et al. Hydroxycinnamic acids as DNA-cleaving agents in the presence of Cu-II Ions: mechanism, structure-activity relationship, and biological implications. Chem-Eur J. 2009;15(46):12889–12899. doi: 10.1002/chem.200901627. [DOI] [PubMed] [Google Scholar]
- 6.Maurya DK, Devasagayam TPA. Antioxidant and prooxidant nature of hydroxycinnamic acid derivatives ferulic and caffeic acids. Food Chem Toxicol. 2010;48(12):3369–3373. doi: 10.1016/j.fct.2010.09.006. [DOI] [PubMed] [Google Scholar]
- 7.Peng HY, Yang XE. Distribution and accumulation of copper, lead, zinc and cadmium contaminants in Elsholtzia splendens grown in the metal contaminated soil: a field trial study. Bull Environ Contam Toxicol. 2005;75(6):1115–1122. doi: 10.1007/s00128-005-0864-z. [DOI] [PubMed] [Google Scholar]
- 8.Peng HY, Yang XE. Effect of Elsholtzia splendens, soil amendments, and soil managements on Cu, Pb, Zn and Cd fractionation and solubilization in soil under field conditions. Bull Environ Contam Toxicol. 2007;78(5):384–389. doi: 10.1007/s00128-007-9197-4. [DOI] [PubMed] [Google Scholar]
- 9.Peng HY, Yang XE, Tian SK. Accumulation and ultrastructural distribution of copper in Elsholtzia splendens . J Zhejiang Univ-Sci B. 2005;6(5):311–318. doi: 10.1631/jzus.2005.B0311. [DOI] [PMC free article] [PubMed] [Google Scholar]
- 10.Sánchez-Alonso I, Careche M, Moreno P, González MJ, Medina I. Testing caffeic acid as a natural antioxidant in functional fish-fibre restructured products. LWT-Food Sci Technol. 2011;44(4):1149–1155. doi: 10.1016/j.lwt.2010.11.018. [DOI] [Google Scholar]
- 11.Tang SR, Wilke BM, Huang CY. The uptake of copper by plants dominantly growing on copper mining spoils along the Yangtze River, the People’s Republic of China. Plant Soil. 1999;209(2):225–232. doi: 10.1023/A:1004599715411. [DOI] [Google Scholar]
- 12.Xie XJ, Xu ZB. Elsholtzia haichouensis―an indicator of copper mine. Geol Acta. 1952;32(4):360–368. (in Chinese) [Google Scholar]
- 13.Zhao ZH, Moghadasian MH. Bioavailability of hydroxycinnamates: a brief review of in vivo and in vitro studies. Phytochem Rev. 2010;9(1):133–145. doi: 10.1007/s11101-009-9145-5. [DOI] [Google Scholar]


