Abstract
Microarray analysis from a yeast continuous synchrony culture system shows a genomewide oscillation in transcription. Maximums in transcript levels occur at three nearly equally spaced intervals in this ≈40-min cycle of respiration and reduction. Two temporal clusters (4,679 of 5,329) are maximally expressed during the reductive phase of the cycle, whereas a third cluster (650) is maximally expressed during the respiratory phase. Transcription is organized functionally into redox-state superclusters with genes known to be important in respiration or reduction being synthesized in opposite phases of the cycle. The transcriptional cycle gates synchronous bursts in DNA replication in a constant fraction of the population at 40-min intervals. Restriction of DNA synthesis to the reductive phase of the cycle may be an evolutionarily important mechanism for reducing oxidative damage to DNA during replication.
Until recently, dynamic analyses of the regulation of gene expression were necessarily confined to data from a few protein products or messages or were approached indirectly by means of perturbation analysis supported by computer simulations (1–3). Cell structure and the spatial compartmentalization of metabolic and macromolecular processes are well understood and have been for some time. In contrast, the temporal organization of cells, the origins of order and periodicity in phenotype, while intriguing several generations of theoretical biologists (4–6), have only recently become accessible to definitive experimentation. The impediments to such experimentation have, in part, been removed by microchip and expression array technologies (7–11), which allow one to focus not so much on the proximal function of a few genes but on the search for a global mechanism capable of organizing a stable phenotype and timing cellular events.
The gating of cell cycle events such as DNA replication and cell division by an oscillator that is an integral submultiple of the cell cycle was first observed as “quantized” generation times in mammalian cells (12) and subsequently extended to a wide variety of organisms (13, 14). Recently, evidence has been obtained in fission and budding yeast that is consistent with the idea that generation times are quantized, or that there is a free-running oscillator underlying the cell cycle (15, 16). One expectation that follows from this observation is that the entry into S phase or cell division would occur only at times that are equal to or multiples of the fundamental period. The question of whether such timing extends to transcription as a whole as suggested by recent analyses (10, 11, 17), or whether the oscillation will be limited to genes already identified as important in cell cycle progression, should be examined.
Much of our success in the genetic and molecular genetic dissection of the genome has been accomplished by setting aside concerns about the moment-to-moment, or hour-to-hour, changes in the transcriptome. This facility with genetic dissection has led to an emphasis on steady-state relationships in the connectivity among genes. In consequence, it may be surprising to find evidence for genomewide oscillations. Computational studies have suggested that periodic gating might be modeled as a population of coupled attractors, where each attractor element is taken to represent the dynamic behavior of individual genes or clusters of coregulated genes (18–21). If the cell is a coupled system, oscillations already identified in “cell cycle-regulated” genes might imply genomewide oscillations because behavior of a transcript can be readily tuned or moved to different patterns of expression internally by interactions with other transcripts, or externally by cell-to-cell signaling or perturbations. Indeed, it is difficult in coupled complex systems to maintain some elements or genes at a constant level while others are oscillating.
Materials and Methods
Media and Culture Conditions. The WT parent strain used throughout this study was the diploid Saccharomyces cerevisiae IFO 0233. Details of culturing methods were as described (22–26). Fermenters were from B. Braun Biotech, Surrey, U.K. (Model Biolab; working volume 750 ml). The basic medium consisted of 5g/liter (NH4)2SO4,2g/liter KH2PO4, 0.5 g/liter MgSO4·7H2O, 0.1 g/liter CaCl2·2H2O, 0.02 g/liter FeSO4·7H2O, 0.01 g/liter ZnSO4·7H2O, 0.005 g/liter CuSO4·5H2O, 0.001 g/liter MnCl2·4H2O, 1 ml/liter 70% H2SO4, and 1 g/kg Difco yeast extract. Glucose medium was supplemented with 22 g/liter glucose monohydrate and 1 ml/liter Sigma Antifoam A. Unless otherwise stated, the fermenters were operated at an agitation rate of 750 rpm, an aeration rate of 150 ml·min–1, a temperature of 30°C, and a pH of 3.4. Dissolved oxygen (DO) levels in the medium, carbon dioxide production, and oxygen consumption were measured every 10 s. Cultures were not nutrient limited, and glucose levels oscillated between 50 and 100 μM in each cycle.
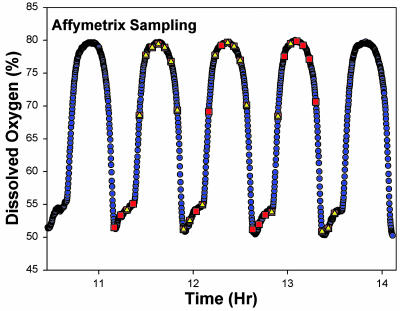
Total RNA Preparation. RNA samples were collected every 4 min (Fig. 1). Five hundred microliters of yeast sample was pipetted into 1 ml of ice-cold absolute ethanol. Samples were stored at –72°C overnight and centrifuged at 10,000 × g for 2 min, and the RNA was isolated by using glass beads to rupture the cells according to the small-scale RNA procedure of Brown (27). The RNA was dissolved in diethyl pyrocarbonate-treated milli-Q water and DNase treated with DNA-free (Ambion) in buffer. The final RNA samples were analyzed in a Uvikon spectrophotometer (Kontron Instruments, Zurich), giving 260/280 ratios of 2.0–2.2. Samples were also analyzed on an Agilent (Palto Alto, CA) 2100 Bioanalyzer, giving 25S/18S ratios of 1.8–2.0.
Fig. 1.
Sampling for expression microarray analysis from continuous synchrony cultures. Respiratory-reductive synchrony is monitored by using DO levels in the media of aerobic continuous cultures. The sample times are shown imposed on the DO oscillation. High DO levels are associated with the reductive phase and low DO levels with the respiratory phase of the cycle. Samples were taken at 4-min intervals through three complete cycles each from two independent cultures. A total of 68 RNA samples were isolated and analyzed. All RNA samples were analyzed for quality by using an Agilent Bioanalyzer capillary electrophoresis system. Thirty-two samples were selected from the best RNA profiles and aligned based solely on their phase position on the DO curve, before Affymetrix expression analysis. Sampling for flow cytometry is shown as red squares and for RNA as yellow triangles.
Target Preparation/Processing for Affymetrix GeneChip Analysis. Purified total RNA samples were processed as recommended in the Affymetrix GeneChip Expression Analysis Technical Manual (Affymetrix, Santa Clara, CA). RNA samples were adjusted to a final concentration of 1 μg/μl. Typically, 25–250 ng was loaded onto an RNA Lab-On-A-Chip (Caliper Technologies., Mountain View, CA) and analyzed in an Agilent 2100 Bioanalyzer. Double-stranded cDNA was synthesized from 10 μg of total RNA by using a SuperScript double-stranded cDNA synthesis kit (Invitrogen) and oligo(dT) primers containing a T7 RNA polymerase promoter. Double-stranded cDNA was used as a template to generate cRNA by using a BioArray High-Yield RNA Transcript Labeling kit (Enzo Diagnostics). The biotin-labeled cRNA was fragmented to 35–200 bases following the Affymetrix protocol. Ten micrograms of fragmented cRNA was hybridized to yeast S98 Affymetrix arrays at 45°C for 16 h in an Affymetrix GeneChip Hybridization Oven 320. The GeneChip arrays were washed and then stained with streptavidin-phycoerythrin on an Affymetrix Fluidics Station 400, followed by scanning on a Hewlett–Packard GeneArray scanner. Results were quantified and analyzed by using microarray suite 5.0 software (Affymetrix). excel files were created to permit further processing in mathcad (Mathsoft, Cambridge, MA), sigmaplot, or matlab (Mathworks, Natick, MA). Intensity values for each of the 6,317 ORFs in the chip were linked to the Saccharomyces Genome Database site, and both their genetic and physical map locations were associated with the intensity values for each gene. The results for all ORFs scored as present by using the default Affymetrix settings were identified according to the original sample number and the phase in the DO oscillation to which they are mapped for presentation. Further analysis was performed for any ORF present in at least one sample in each of the three cycles. Of the ORFs scored as present by these criteria, 41 were removed from the analysis based on the recent sequence reanalysis (28).
Northern Analyses. Total RNA (5–7 μg) was denatured in glyoxal and analyzed on a 1.0% agarose gel according to the procedure of Burnett (29). The RNA was transferred to a Nytran nylon membrane by using high-efficiency transfer solution (Tel-Test, Friendswood, TX) in a rapid downward flow turboblotter (Schleicher & Schuell), washed in 20 mM Tris buffer, pH 8 at 60°C for 10 min to remove glyoxal and baked (1 h, 80°C). The remaining gel was stained and checked for complete RNA transfer. Probes were labeled with 32P dCTP by using the Prime-It RmT random primer labeling kit (Stratagene). Blots were prehybridized in QuikHyb solution (Stratagene) at 68°C for 30 min. Hybridization was carried out at 68°C in QuikHyb for 2–3 h. The blots were washed, exposed to a Molecular Dynamics phosphor screen, and analyzed on a Typhoon 9410 variable mode imager (Amersham Pharmacia).
Flow Cytometry. Samples were taken from fermenter cultures (300 μl; ≈1 × 10⁸ cells) and fixed by adding 700 μl of 95% ethanol and stored at 4°C. Before staining for flow cytometric analyses aliquots of 50 μl (containing ≈1 × 10⁷ cells) were washed twice in 1 ml of PBS, centrifuged at 5,000 g, and resuspended in PBS. Samples were then treated with RNase (150 μg enzyme; 37°C for 2 h) and stained overnight with propidium iodide (PI) (5 μg for ≈1 × 10⁷ cells). The samples were analyzed on a MoFlo MLS (Dako Cytomation, Fort Collins, CO) flow cytometer. Data were acquired by using dual laser excitation. Light scatter signals (forward and side) were acquired with excitation from a HeNe laser (Melles Griot, Carlsbad, CA). PI was excited with 500 mW at 488-nm wavelength from an Innova 90 Argon laser (Coherent Radiation, Santa Clara, CA). The PI signal was split through a 580DRLP and a 630DRLP dichroic beam splitting filters and collected with a 640LP filter (Omega Optical, Brattleboro, VT).
Results
The Benchmark Oscillation in DO. To begin an experimental analysis of the connectivity relationships among genes, it was essential to have a very reproducible and precise biological system. Oscillations in respiratory activity in budding yeast and other organisms have been known for many years (30, 31). At sufficient cell densities in batch or continuous cultures, cell-to-cell signaling synchronizes the culture with respect to oxidative and reductive functions (22). These changes are mirrored by changes in the mitochondrial structure and function (23), flux through the citric acid cycle (24), and redox state of the cell measured by NAD(P)H fluorescence and glutathione levels (24). Synchronization of the respiratory oscillation in the population of cells appears, at a minimum, to involve respiratory inhibition by the release of small amounts of H2S (25) and phase shifts induced by acetaldehyde (26). Caused presumably by initial condition dependence, the period of the oscillation can vary from 40 to 44 min, but the coefficient of variation in period or amplitude in a given culture, once the oscillation is established, is <2% (32). In Fig. 1, the DO level, indicating the respiratory (low DO) and reductive phases (high DO levels) is shown for one of the continuous cultures sampled for these experiments, together with the points in the cycle when samples were taken.
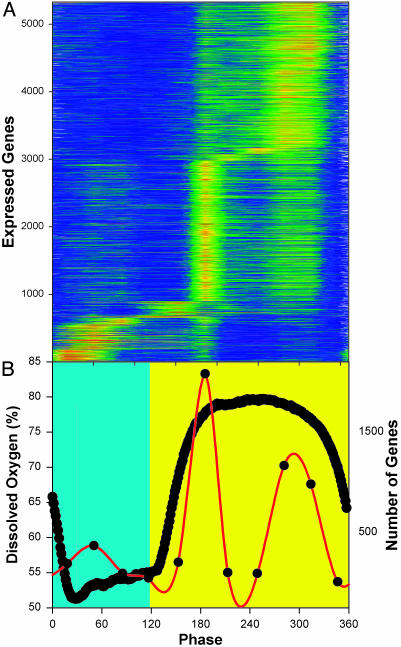
Expression Microarray Analysis. Using Affymetrix chips, the patterns of gene expression for 5,329 expressed genes were followed by sampling at 4-min intervals through three cycles of the DO oscillation. The reproducibility of the global pattern of expression can be seen in the color contour map of expression levels through the three cycles where orange-red indicates high levels of expression and blue indicates low levels. Genes are arranged in Fig. 2 according to their time of maximum expression in the cycle. The time of maximum gene expression in the cycle was determined by averaging gene expression in the three replicates (Fig. 2A), assigning the phase of maximum expression to each transcript then examining how well this assignment is reproduced through the three cycles (Fig. 7, which is published as supporting information on the PNAS web site). More than 87% of all expressed genes are expressed maximally in the reductive phase of the cycle. Of these, 2,429 genes are maximally expressed early in the reductive phase, whereas 2,250 genes are maximally expressed late in the reductive phase of the cycle. The remaining 650 genes are maximally expressed in the respiratory phase of the cycle (Fig. 2B). In general, the genes maximally expressed in the respiratory phase show higher-amplitude oscillations than do those maximally expressed in the reductive phase. The average peak-to-trough ratio in the respiratory phase is 2.40, whereas in the reductive phase it is 1.89. Only 41 transcripts show a >6-fold change, whereas just 7 show a >20-fold change. It appears that low-amplitude oscillations in expression are a near universal property of this system.
Fig. 2.
Average expression levels from three cycles of the respiratory oscillation. Color contour (intensity) maps of the expression levels of the 5,329 expressed genes are shown for all 32 RNA samples through three cycles of the DO oscillation. (A) The average expression level for the three biological replicates are shown. High levels of expression are orange, and low levels are blue. Genes were scored as present based on the Affymetrix default settings and included in the analysis if at least 1 of the 32 was scored as present in each of the three cycles. Genes are defined according to the most recent assignments (23). Values shown here were scaled by dividing the average expression level for each gene into each of the time-series samples for that gene. Transcripts were ordered according to their phase of maximum expression in the average of the three replicates. This same scaling and ordering was used in Fig. 7. Samples are identified according to their phase in the cycle (0–360°/cycle). Sample phases are shown in reference to the DO curve (thick black line, B). The reductive phase is taken to be the period of minimal oxygen consumption (maximum DO, yellow background) in the interval between the minimum DO levels, and the respiratory phase is shown against a blue-green background. (B) Summary of the results for the time of maximum expression (red line) for the transcripts of A. Color scale: orange-red =>1.6 and dark blue = <0.8.
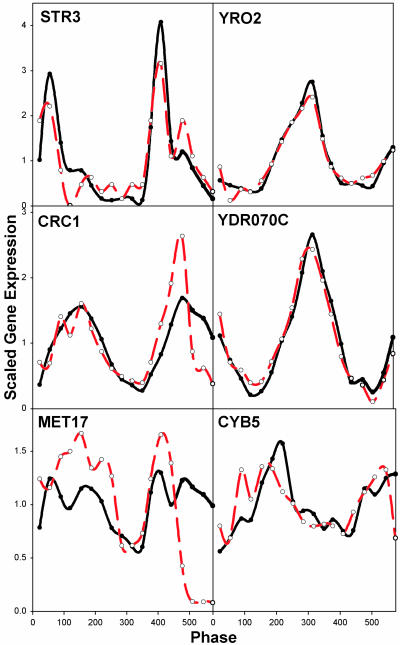
Northern Blot Analysis. Probes for six genes were prepared from yeast cDNA by PCR using primers that amplify the entire coding regions of the expressed genes (Fig. 3). These genes were chosen as representative based on their patterns of expression and time of maximum expression as indicated: early respiratory phase (STR3), mid respiratory phase (MET17), late respiratory/early reductive phase (CRC1), early reductive phase (CYB5), and late reductive phase (YRO2 and YDR070c). A total of 18 RNA time series samples taken from the second and third cycles of Fig. 7 were subjected to Northern blot analysis for each of the six genes. Comparison between the Affymetrix intensity results and the Northern blots was accomplished by dividing the radioactivity after background subtraction by the average radioactivity in all 18 samples. This scaling to the average expression of all measurements for each transcript is the same scaling as was performed on the Affymetrix fluorescence intensity measures throughout this study. In Fig. 3, the results of the two assays are compared. The patterns of expression found in the Affymetrix microchips are reproduced to a considerable degree by the results from the Northern blot analysis.
Fig. 3.
Comparison of Affymetrix microchip data with Northern blots. Northern blot analyses of transcripts found to be maximally expressed at differing points in the redox/transcriptional cycle were compared with the results from the microarray analyses. Six clones of representative genes were examined in 18 time-series samples representing 1.5 cycles of the DO oscillation and were scaled by dividing each time point by the average of all of the points. Red lines indicate Northern blot data, and black lines indicate Affymetrix intensity data.
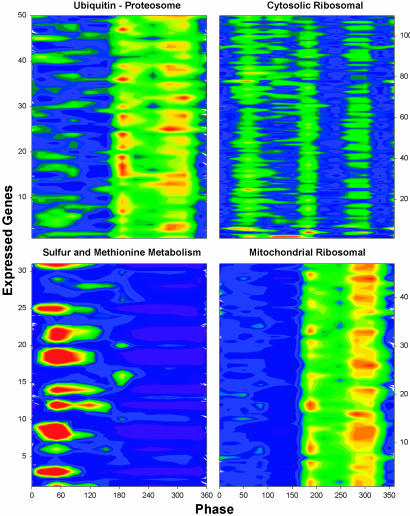
Temporal Organization of Functionally Related Transcripts. Prior emphasis in microarray analysis has been on paired treated versus control samples examining those genes showing differences >2-fold, although it has been reported that changes in the 1.3- to 1.4-fold range can be significant (33). Of the 5,329 expressed genes only 161 show oscillations in the range of 1.3- to 1.4-fold peak-to-trough differences through the cycle. These fall into two classes with 118 showing intensities >2,000 per slide. Most of these are known highly expressed genes such as actin, ribosomal proteins (52 of 118), genes of intermediary metabolism such as PGK, and other structural or maintenance proteins. This low-amplitude oscillation in maintenance genes is consistent with the report of Warrington et al. (34), who found evidence that maintenance genes in mammalian systems show oscillations. If the time course of actin (ACT1) is followed, there is an intensity oscillation of 1,350 fluorescent units superimposed on a high actin level of 5,862 intensity units within the cycle. Thus, although the fold change in expression is low, the pattern of oscillations in ACT1 and the others in the cluster with high average expression levels is clear. The pattern shows three peaks of expression, as though these constitutive expressers are transcribed at every permitted phase, whereas expression of other functionally related groups is limited to one phase. This high transcript level, low-amplitude behavior, is shown for the cytosolic ribosomal proteins in Fig. 4 Upper Right.
Fig. 4.
Temporal organization of functionally related transcripts. Subsets of functionally related transcripts were color-mapped as in Fig. 1 to show the time of expression maximums as described above. The files used to generate these color maps are available Table 1. For sulfur metabolism transcripts (Lower Right) the scale is orange-red = >2.2 and dark blue = <0.8. For all other panels, orange-red = >1.4 and dark blue = <0.8.
To look at the temporal organization of functionally related transcripts (Fig. 4), we compared transcripts for genes previously identified as important in respiration with those identified with respiratory inhibition (reduction). For example, transcripts for mitochondrial ribosomal proteins are maximally expressed during the reductive phase when mitochondrial function is minimal (23) and the cristae are more clearly defined (orthodox configuration). Conversely, transcripts such as those involved in methionine and sulfur metabolism, important in the establishment of the reductive phase and DNA replication are made early in the respiratory phase, before their putative maximal function at the beginning of DNA replication (Fig. 4). As with all transcripts examined, there is a 4- to 12-min lag between the peak in transcript level and the expected time of maximum function of the protein product. This phase anticipation is functionally significant if protein synthesis is similarly temporally coherent and occurs with a fixed-phase relationship to transcription. In support of this idea, the ubiquitin-constituent transcripts of the proteosome are clustered and maximally expressed in the reductive phase (Fig. 4 and Table 1, which is published as supporting information on the PNAS web site).
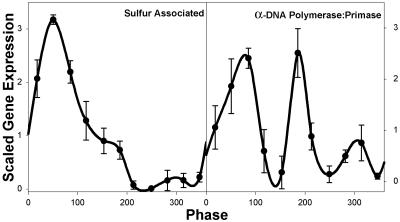
The α-DNA-polymerase/primase complex is made up of four subunits, each of which is an independent transcript with noncontiguous physical map locations. Although it could be otherwise, one might expect that the biological function would make simultaneous transcription likely and thus offers an opportunity to apply a biological rationale to the examination of the patterns in the transcriptional cycle. The average of the three replicates of the four subunits are shown together with the SD of intensity change (Fig. 5). The timing of expression shows the same 4- to 12-min phase anticipation as mentioned above, consistent with the timing of DNA synthesis from the flow cytometric analysis of the cell cycle presented below. Similarly, transcripts functionally related to sulfur metabolism also show very reproducible patterns (Fig. 5). As an alternative to the color map of Fig. 2, a subset of the early reductive-phase transcripts representative of the range of expression in this group have been coplotted with the DO oscillation (Fig. 8, which is published as supporting information on the PNAS web site). Table 1 contains the expression patterns for the transcripts shown in Figs. 4 and 5.
Fig. 5.
Cycle-to-cycle reproducibility in selected functional groupings. Subtracting the minimum expression and scaling the result to an average of 1 determines the change in average intensity for each gene. (Left) Six sulfur-associated genes (see Table 1) were averaged, and the SD was determined. (Right) The genes for the four subunits of the α DNA polymerase/primase complex were averaged, and the SD was determined. The error bars represent 1 SD.
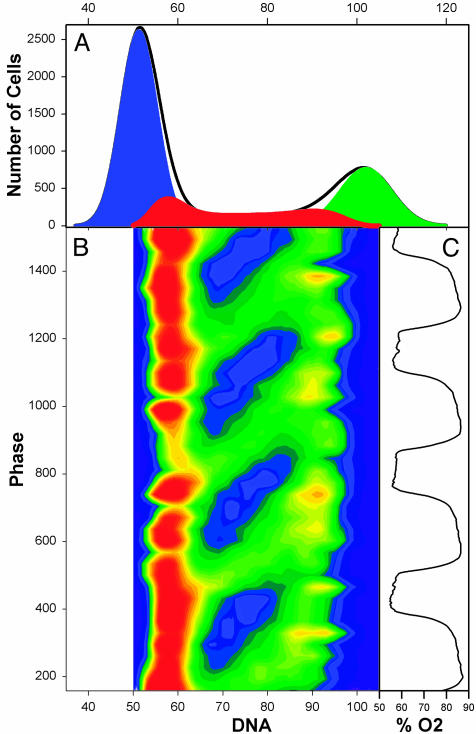
Flow Cytometry. The relationship between DNA replication and the transcriptional cycle was studied by flow cytometric analysis. By sampling at 4-min intervals through four cycles of the DO oscillation (Fig. 6C) and then aligning multiple flow cytometric DNA histogram analyses with the respiratory oscillation, we found that DNA replication in these cells begins abruptly at the end of the respiratory phase, as oxygen consumption decreases and H2S levels rise. To make this synchronous gating of cells into S phase clear, all 39 of the 1D propidium iodide-DNA histograms (Fig. 6A) were stacked, and the values for S were determined by removal of G1 and G2 by Gaussian deconvolution. Although <10% of the cells are gated into S phase in any turn of the respiratory/transcriptional cycle, this synchronous gating is so precisely timed that a track representing the movement of cells from early to late S can be followed in the 3D reconstructions. In Fig. 6B, the increase in DNA content is shown by the green track running from left to right and diagonally upward from early to late S phase, DNA replication continues throughout the reductive phase, ending just as respiration begins. The duration of S phase and DNA synthesis in these cells is 24 min, close to that observed in the most rapidly growing high glucose cultures. The movement of the synchronous cohort through S can also be followed in animations viewed at www.talandic.com.
Fig. 6.
Flow cytometric analysis of S-phase gating in the reductive phase of the cycle. The 1D frequency histogram (A) showing DNA content of the population for 39 samples taken at 4-min intervals have been stacked (B) in relationship to the time in the DO oscillation at which they were sampled (C) and color-mapped to show numbers of cells in early, middle, and late S phase (B). In the resulting 2D color map, with red indicating more cells and blue representing fewer cells, the track of cells through S phase appears as a series of green bands moving left to right and upward on the diagonal. Red = 350 cells, light green = 200 cells, and dark blue = 0 cells.
The behavior of DNA replication, the most readily identifiable cell cycle event in this culture system, is dynamically similar to the circadian time-scale gating seen in animal model systems (35) and humans (36) where a correlation between glutathione levels and circadian gating of cells into S phase has been observed (36). The role of reactive oxygen intermediates and the cellular mechanisms preventing damage to single-stranded DNA during replication have been extensively studied (37, 38). However, the possibility that temporal organization in the cell has evolved to prevent or minimize such damage has received little attention. In the case of RNA synthesis where repair pathways for oxidative damage are unknown, it is of interest to note that 87% of the transcripts examined here are maximally expressed during the reductive phase.
Discussion
Although the respiratory oscillation has been investigated in a number of laboratories, neither the relationship between transcription and respiratory metabolism, nor its connection to the cell cycle and to the gating of cells into S phase and mitosis has previously been explored. Under the growth conditions commonly used in this system, the population doubling time is >8 h, and it has been assumed that the ≈ 40- to 44-min respiratory oscillation was uncoupled from the cell cycle. It appears rather that this short period cycle might be the fundamental timekeeping oscillator because transcription and the gating of DNA replication and the duration of the cell cycle show similar quantized distributions. In the strain of yeast used in these studies a series of deletion mutations have been developed that show DO oscillations with either half or twice the period (20 and 80 min) of the WT (39). It will be of interest to determine whether these period additions or period doublings of the DO oscillation and the respiratory cycle (39) are manifested as well in the period of transcription. A reanalysis of population doubling time data in yeast cultures growing on different media with differing carbon sources from rather poor to rich found that population doubling times cluster at multiples of the ≈40-min fundamental (32, 40), further urging upon us the view that the cell cycle is a downstream manifestation of a timekeeping attractor (17). The spatio-temporal dynamics and cell-to-cell signaling in these vigorously stirred cultures that gives rise to precise periodic outputs is the subject of ongoing investigations.
Alter et al. (10, 41) and others (11, 19) in their reanalysis of the original Stanford cell cycle data using singular value decomposition or wavelet decomposition have all come to a similar conclusion: that there is evidence for a genomewide, low-amplitude oscillation in transcription. Here, using a yeast continuous culture system exhibiting a very high level of precision and stability, genomewide oscillations in transcription have been demonstrated by using Affymetrix chips and replicate sampling through three cycles of the respiratory oscillation. The long-standing assumptions that the oscillator is uncoupled from the cell cycle and that the oscillation is confined to a small subset of genes intimately connected to energy metabolism is refuted by the finding of genomewide oscillations in transcription. We find sufficient evidence to support the claim that housekeeping, maintenance, or constitutive genes are not expressed at a constant level through the transcriptional cycle. As a practical matter, the canonical-treated versus control paradigm is made suspect when the assumption of steady-state conditions is shown to be incorrect. Given that the patterns of expression shown here hold through multiple cycles even when transcripts showing very low-amplitude expression patterns are considered, the question is raised whether these oscillatory patterns, unacknowledged in most expression array experiments, represent an uncontrolled variable and contribute to the biological variability and hence the apparent 2-fold limitations to sensitivity.
Continuous culture techniques allow the examination of genomewide expression in a manner that avoids the pitfalls of conventional synchrony that is, synchronization-associated perturbations to the system, lack of cycle-to-cycle reproducibility, and rapid decay of blockage-induced synchrony, while permitting sampling to be as frequent and enduring as required. In other words, we can sample for expression array analysis from a biologically stable platform as frequently as we can afford to sample, and we can do so under conditions where the benchmark oscillation in respiration guides the sampling regimen. Using this system it should be possible to better define and eliminate sources of variability in expression arrays.
The most interesting realization to come out of these studies is that the separation in time between oxidative and reductive phases propagates throughout the transcriptome and is coordinated with the initiation of DNA replication. This may be an important strategy evolved in cells to prevent oxidative damage to DNA during replication. Because transcription is mirrored in the oscillations in oxidative and reductive genes, there is the implication that protein synthesis and catabolism must be similarly organized in time. Given the totality of this coordinate expression of such central and yet disparate elements as DNA replication, the machinery for protein synthesis and degradation, and mitochondrial ribosomes, it seems unavoidable to expect that similar temporal organization will be found in mammalian and other systems.
Supplementary Material
Acknowledgments
We thank the Analytical Cytometry Core facility for help in flow cytometric analysis and J. Denis Heck and the University of California-Irvine DNA MicroArray Facility for help with the expression array studies. This work is supported by a Beckman Research Institute grant.
This paper was submitted directly (Track II) to the PNAS office.
Abbreviation: DO, dissolved oxygen.
See Commentary on page 1118.
References
- 1.Klevecz, R. R. & Ruddle, F. H. (1968) Science 159, 634–636. [DOI] [PubMed] [Google Scholar]
- 2.Kauffman, S. A. & Wille, J. J. (1975) J. Theor. Biol. 55, 47–93. [DOI] [PubMed] [Google Scholar]
- 3.Mackey, M. C. & Glass, L. (1977) Science 197, 287–289. [DOI] [PubMed] [Google Scholar]
- 4.Waddington, C. D. (1957) The Strategy of the Gene (Allen and Unwin, London)
- 5.Eigen, M. & Schuster, P. (1977) Naturwissenschaften 64, 541–565. [DOI] [PubMed] [Google Scholar]
- 6.Kauffman, S. A. (1993) The Origins of Order (Oxford Univ. Press, Cambridge, U.K.)
- 7.Wodicka, L., Dong, H., Mittman, M., Ho, M. H. & Lockhart, D. (1997) Nat. Biotechnol. 15, 1359–1367. [DOI] [PubMed] [Google Scholar]
- 8.Cho, R. J., Campbell, M. J., Winzeler, E. A., Steinmetz, L., Conway, A., Wodicka, L., Wolfsberg, T. G, Gabrielian, A. E., Landsman, D., Lockhart, D. J. & Davis, R. W. (1998) Mol. Cell. 2, 65–73. [DOI] [PubMed] [Google Scholar]
- 9.Spellman, P. T., Sherlock, G., Zhang, M. Q., Iyer, V. R., Anders, K., Eisen, M. B., Brown, P. O., Botstein, D. & Futcher, B. (1998) Mol. Biol. Cell. 9, 3273–3297. [DOI] [PMC free article] [PubMed] [Google Scholar]
- 10.Alter, O., Brown, P. O. & Botstein, D. (2000) Proc. Natl. Acad. Sci. USA 97, 10101–10106. [DOI] [PMC free article] [PubMed] [Google Scholar]
- 11.Klevecz, R. R. (2000) Funct. Integr. Genomics 1, 186–192. [DOI] [PubMed] [Google Scholar]
- 12.Klevecz, R. R. (1976) Proc. Natl. Acad. Sci. USA 73, 4012–4016. [DOI] [PMC free article] [PubMed] [Google Scholar]
- 13.Chisholm, S. W. & Costello, J. H. (1980) J. Phycol. 16, 375–383. [Google Scholar]
- 14.Homma, K. & Hastings, J. W. (1988) J. Biol. Rhythms 3, 49–58. [DOI] [PubMed] [Google Scholar]
- 15.Haase, S. B. & Reed S. I. (1999) Nature 401, 394–397. [DOI] [PubMed] [Google Scholar]
- 16.Sveiczer, A., Csikasz-Nagy, A., Gyorffy, B., Tyson, J. J. & Novak, B. (2000) Proc. Natl. Acad. Sci. USA 97, 7865–7870. [DOI] [PMC free article] [PubMed] [Google Scholar]
- 17.Rifkin, S. A. & Kim, J. (2002) Bioinformatics 18, 1176–1183. [DOI] [PubMed] [Google Scholar]
- 18.Klevecz, R. R., Kauffman, S. A. & Shymko, R. M. (1984) Int. Rev. Cytol. 86, 97–128. [DOI] [PubMed] [Google Scholar]
- 19.Klevecz, R. R. (1998) Physica D 124, 1–10. [Google Scholar]
- 20.Klevecz, R. R., Bolen, J. L. & Durán, O. (1992) Int. J. Bifurcation Chaos 2, 941–953. [Google Scholar]
- 21.Bolen, J. L., Durán, O. & Klevecz, R. R. (1993) Physica D 67, 245–256. [Google Scholar]
- 22.Satroutdinov, A. D., Kuriyama, H. & Kobayashi, H. (1992) FEMS Microbiol. Lett. 77, 261–267. [DOI] [PubMed] [Google Scholar]
- 23.Lloyd, D., Salgado, L. E., Turner, M. P., Suller, M. T. & Murray, D. B. (2002) Microbiology 148, 3715–3724. [DOI] [PubMed] [Google Scholar]
- 24.Murray, D. B., Engelen, F. A. A., Lloyd, D. & Kuriyama, H. (1999) Microbiology 145, 2739–2745. [DOI] [PubMed] [Google Scholar]
- 25.Sohn, H. Y., Murray, D. B. & Kuriyama, H. (2000) Yeast 16, 1185–1190. [DOI] [PubMed] [Google Scholar]
- 26.Murray, D. B., Klevecz, R. R. & Lloyd, D. (2003) Exp. Cell Res. 287, 10–15. [DOI] [PubMed] [Google Scholar]
- 27.Brown, A. J. P. (1996) in Yeast Protocols, ed. Evans, I. H. (Humana, Totowa, NJ), pp. 269–276.
- 28.Kellis, M., Patterson, N., Endrizzi, M., Birren, B. & Lander, E. S. (2003) Nature 423, 241–254. [DOI] [PubMed] [Google Scholar]
- 29.Burnett, W. V. (1997) BioTechniques 22, 668–671. [DOI] [PubMed] [Google Scholar]
- 30.Mochan, E. & Pye, E. K. (1973) Nat. New Biol. 242, 177–179. [DOI] [PubMed] [Google Scholar]
- 31.Poole, R. K., Lloyd, D. & Kemp, R. B. (1973) J. Gen. Microbiol. 77, 209. [Google Scholar]
- 32.Klevecz, R. R. & Murray, D. B. (2001) Mol. Biol. Rep. 28, 73–82. [DOI] [PubMed] [Google Scholar]
- 33.Yue, H., Eastman, P. S., Wang, B. B., Minor, J., Doctolero, M. H., Nuttall, R. L., Stack, R., Becker, J. W., Montgomery, J. R., Vainer, M. & Johnston, R. (2001) Nucleic Acids Res. 29, E41. [DOI] [PMC free article] [PubMed] [Google Scholar]
- 34.Warrington, J. A., Nair, A., Mahadevappa, M. & Tsyganskaya, M. (2000) Physiol. Genomics 2, 143–147. [DOI] [PubMed] [Google Scholar]
- 35.Potten, C. S., Booth, D., Cragg, N. J., O'Shea, J. A., Tudor, G. L. & Booth, C. (2002) Cell Prolif. 35, 16–21. [DOI] [PMC free article] [PubMed] [Google Scholar]
- 36.Smaaland, R., Abrahamsen, J. F., Svardal, A. M., Lote, K. & Ueland, P. M. (1992) Br. J. Cancer 66, 39–45. [DOI] [PMC free article] [PubMed] [Google Scholar]
- 37.Georgiou, G. (2002) Cell 111, 607–610. [DOI] [PubMed] [Google Scholar]
- 38.Koerkamp, M. G., Rep, M., Bussemaker, H. J., Hardy, G. P., Mul, A., Piekarska, K., Szigyarto, C. A., De Mattos, J. M. & Tabak, H. F. (2002) Mol. Biol. Cell. 13, 2783–2794. [DOI] [PMC free article] [PubMed] [Google Scholar]
- 39.Adams, C. A., Kuriyama, H., Lloyd, D. & Murray D. B. (2003) Yeast 20, 463–470. [DOI] [PubMed] [Google Scholar]
- 40.Wheals, A. E., Tyson, C. B. & Lord, P. G. (1979) J. Bacteriol. 138, 92–98. [DOI] [PMC free article] [PubMed] [Google Scholar]
- 41.Alter, O. Brown, P. O. & Botstein, D. (2003) Proc. Natl. Acad. Sci. USA 100, 3351–3356. [DOI] [PMC free article] [PubMed] [Google Scholar]
Associated Data
This section collects any data citations, data availability statements, or supplementary materials included in this article.


