Abstract
AIM
To build a mechanism-based population pharmacodynamic model to describe and predict the time course of active GLP-1, glucose and insulin in type 2 diabetic patients after treatment with various doses of vildagliptin.
METHODS
Vildagliptin concentrations, DPP-4 activity, active GLP-1, glucose and insulin concentrations from 13 type 2 diabetic patients after oral vildagliptin doses of 10, 25 or 100 mg and placebo twice daily for 28 days were co-modelled. The population PK/PD model was developed utilizing the MC-PEM algorithm in parallelized S-ADAPT version 1.56.
RESULTS
In the PD model, active GLP-1 production was stimulated by gastrointestinal intake of nutrients. Active GLP-1 was primarily metabolized by DPP-4 and an additional non-saturable pathway. Increased plasma glucose stimulated secretion of insulin which stimulated utilization of glucose. Active GLP-1 stimulated both glucose-dependent insulin secretion and insulin-dependent glucose utilization. Complete inhibition of DPP-4 resulted in an approximately 2.5-fold increase of active GLP-1 half-life.
CONCLUSIONS
The effects of vildagliptin in patients with type 2 diabetes on several PD endpoints were successfully described by the proposed model. The mechanisms of vildagliptin on glycaemic control could be evaluated from a variety of aspects such as effects of DPP-4 on GLP-1, effects of GLP-1 on insulin secretion and effects on hepatic and peripheral insulin sensitivity. The present model can be used to predict the effects of other dosage regimens of vildagliptin on DPP-4 inhibition, active GLP-1, glucose and insulin concentrations, or can be modified and applied to other incretin-related anti-diabetes therapies.
Keywords: GLP-1, glucose, insulin, mechanism-based population modelling, type 2 diabetes mellitus, vildagliptin
WHAT IS ALREADY KNOWN ABOUT THIS SUBJECT
Vildagliptin is a potent and selective inhibitor of dipeptidylpeptidase-IV (DPP-4).
DPP-4 inhibition leads to increased active glucagon-like peptide 1 (GLP-1) concentrations and decreased plasma glucose in patients with type 2 diabetes.
WHAT THIS STUDY ADDS
No mechanism-based population PD modelling has been conducted to understand the effects of vildagliptin on active GLP-1, glucose and insulin.
Active GLP-1 concentrations could be described by secretion of active GLP-1 from the gut in response to a meal and elimination by DPP-4 and an additional non-saturable elimination pathway.
The effects of vildagliptin on glucose and insulin are primarily via enhanced GLP-1 concentrations which could be modelled by its effects on insulin secretion and peripheral insulin sensitivity.
Parallelized S-ADAPT but not NONMEM VI proved to be an excellent choice for estimating a complex population model such as the current PK/PD model.
Introduction
Vildagliptin is a potent and selective inhibitor of dipeptidyl peptidase IV (DPP-4), leading to increased concentrations of active glucagon-like peptide 1 (GLP-1) and thereby decreased plasma glucose concentrations. Vildagliptin is approved for treatment of type 2 diabetes mellitus in more than 76 countries including the European Union and Japan where 85 to 95% of all diabetes cases are type 2 [1]. Such patients exhibit insufficient insulin activity due to decreased insulin action in glucose-utilizing tissues (peripheral insulin resistance) and impaired insulin secretion from the β-cells in the pancreas (β-cell failure).
After ingestion of a meal, GLP-1, an incretin hormone, is released from the L-cells in the gut wall. Its secretion is stimulated both by endocrine and neural signals and by direct stimulation of the intestinal cells by digested nutrients in the gut. Active GLP-1 stimulates glucose-dependent insulin secretion from β-cells, enhances β-cell proliferation and increases β-cell resistance to apoptosis [2]. GLP-1 has also been demonstrated to suppress hepatic glucose production and delay gastric emptying [3], thereby decreasing high blood glucose concentrations after food intake. GLP-1 is rapidly inactivated by the ubiquitous enzyme DPP-4 with a half-life of approximately 2 min in humans. Reduced secretion of GLP-1 in type 2 diabetic patients compared with healthy subjects has been reported [4, 5]. Vildagliptin, a DPP-4 inhibitor, prolongs the action of active GLP-1 by inhibiting its inactivation by the DPP-4 enzyme.
While the effects of vildagliptin from this study in type 2 diabetic patients were previously described by non-compartmental analysis (NCA) [6], a mechanism-based compartmental modelling approach has not been applied. Simultaneous modelling of PD endpoints such as DPP-4, GLP-1, insulin and glucose by taking the pathophysiology into account allows the exploration of the dynamic aspects of mechanisms of action and the interactions between these PD endpoints when vildagliptin intervenes. In addition the population approach takes into account the variability between patients and adequately considers measurements below the quantification limit. Utilizing parallelized S-ADAPT with the Monte Carlo parametric expectation maximization (MC-PEM) algorithm, a state-of-the-art algorithm which calculates the exact log likelihood, allows the estimation of the whole system by a full population approach which was not possible in NONMEM.
Our companion article describes a mechanism-based population model that simultaneously captures the PK of vildagliptin and its effects on DPP-4 activity in type 2 diabetic patients at different dose levels [7]. In the present report, we further developed a mechanism-based PK/PD model including downstream PD endpoints of GLP-1, insulin and glucose based on our PK/DPP-4 model to understand further the dynamics of the mechanism of action of vildagliptin.
The overall aim of our study was to develop a mechanism-based population PK/PD model that simultaneously describes vildagliptin PK, inhibition of DPP-4 activity and changes in active GLP-1, glucose and insulin at different dose levels based on the mechanism of action of vildagliptin.
Methods
A detailed report on the clinical and bioanalytical procedures that are not described here was published [6]. A brief description is provided in the companion article [7].
Study participants
Thirteen adult patients who had been diagnosed with type 2 diabetes for at least 3 months prior to screening were included in the study. A washout period from hypoglycaemic drugs of up to 4 weeks was required. The study was approved by the local ethics committee and conducted in full compliance with the Declaration of Helsinki. All patients signed written informed consent.
Study design and drug administration
The study was a randomized, placebo-controlled, double-blind, four-way crossover trial. The subjects received twice daily oral doses of 10, 25 or 100 mg vildagliptin (Galvus™) and placebo as tablets for 28 days. Patients were at the study site on day 1 and from the evening of day 26 to the morning of day 29 in each study period. During the confinement periods the patients received a standard diet with identical meals for all four treatments. Breakfast and dinner were consumed at approximately 30 min after the doses. The duration of food intake was reported for each individual patient and meal.
Sampling schedule and bioanalysis
Blood samples for measurement of active GLP-1, glucose and insulin concentrations were obtained on day 28 of each treatment period. Samples for GLP-1 were taken pre-dose and at 0.5, 0.58, 0.67, 0.75, 1, 1.5, 2, 3, 5, 8, 10.5, 10.58, 10.67 10.75, 11, 11.5, 12, 14 and 16 h after the morning dose. Blood samples for determination of glucose and insulin were collected prior to dosing and at 0.75, 1, 1.25, 1.5, 2, 2.5, 3, 4, 5, 5.5, 5.75, 6, 6.5, 7, 8, 9.75, 10.25, 10.75, 11, 11.25, 11.5, 12, 12.5, 13 and 14 h after the morning dose. All samples were centrifuged and plasma was frozen at −70°C or lower until analysis.
Active GLP-1 in plasma was determined utilizing the GLP-1 (active) ELISA kit (Linco Research, Inc., St. Charles, MO, USA). The lower limit of quantification (LLQ) was 2 pmol l−1. The glucose assay was performed on a Hitachi 747–200 Autoanalyzer (Roche Diagnostics, Indianapolis, IN, USA) and had a linear range up to 750 mg dl−1. Insulin was measured by electrochemiluminescence on a 2010 Elecsys System (Roche Diagnostics) with an LLQ of 0.2 mIU ml−1.
Non-compartmental analysis
The individual areas under the curve (AUC) for vildagliptin, active GLP-1, glucose and insulin were calculated using the linear up/log down (linear interpolation when concentrations are increasing, logarithmic interpolation for decreasing concentrations) as implemented in WinNonlin Pro version 5.0.1 (Pharsight Corporation, Mountain View, CA, USA).
Compartmental modelling
All GLP-1, glucose, and insulin profiles from the three different treatments and placebo were modelled simultaneously utilizing the MC-PEM algorithm in S-ADAPT version 1.56 [8] with the Beal M3 method for handling data below the limit of quantification [9]. Model discrimination was based on the following four criteria: 1) visual inspection of the observed and predicted profiles, 2) visual comparison of the patterns of systematic and random residuals, 3) the objective function and 4) visual predictive checks.
For the visual predictive checks, GLP-1, glucose and insulin concentration−time profiles were simulated for 5000 subjects for each competing model in S-ADAPT version 1.56. The median and non-parametric prediction intervals were calculated and compared with the observed data as described in the companion report. Ideally, the median should mirror the central tendency of the data and 20% of the observed data points should fall outside the 80% prediction interval over all time points.
Standard errors were obtained from the full PK/PD model by utilizing the type 1 bootstrap method (see S-ADAPT manual under heading poperr_type) as implemented in S-ADAPT [8] in order to obtain a measure for precision of parameter estimates. This method randomly selects sets of patients from the dataset. A number of 200 bootstrap runs was performed to obtain standard errors.
Population PK model
Details on the PK model are provided in the companion article [7]. Briefly, the vildagliptin PK and DPP-4 activity were described simultaneously by a model for target-mediated drug disposition (TMDD), which accounts for the high affinity capacity-limited binding of vildagliptin to DPP-4 in both plasma and tissues. The model assumes that after the drug-enzyme complex has been formed, a fraction of the vildagliptin molecules is hydrolyzed by DPP-4.
Structural PD model
The diagram of the full structural PD model is illustrated in Figure 1. First the active GLP-1 concentrations were included in the previously developed model for vildagliptin PK and DPP-4 activity. Active GLP-1 secretion is stimulated by the presence of glucose in the gut. The amounts of glucose in the gut after breakfast, lunch, dinner and snack were modelled by assuming an arbitrary value of 75000 mg glucose for each meal and then estimating glucose bioavailability from the meal by which the input was multiplied. Different glucose bioavailabilities, and therefore different amounts of glucose absorbed, were estimated for each type of meal to account for the different amounts of glucose absorbed after breakfast (75 g ×FB), lunch (75 g ×FL), dinner (75 g ×FD) and snack (75 g ×FS), as described below. As the meals were standardized throughout all study periods and no between treatment period variability was applied, the four different bioavailabilities could be estimated. The input of glucose (as food) into the gut compartment was modelled as a zero-order process with the duration (tk0) being the actual recorded duration of food intake for each individual patient and each meal. The amounts of glucose in the gut (mg) after breakfast (AGB), lunch (AGL), dinner (AGD) and snack (AGS) were
Figure 1.
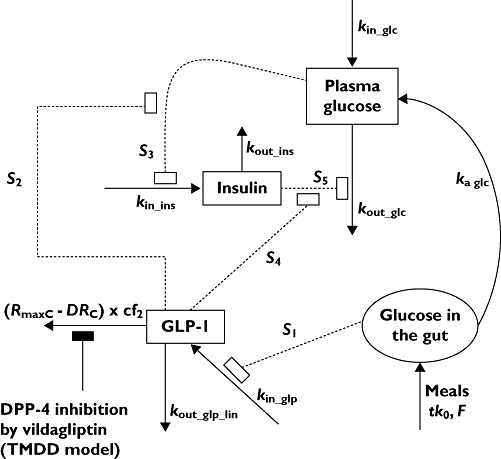
Model diagram. Symbols are defined in the text and in Table 1
where kaB, kaL, kaD and kaS (h−1) are the first order absorption rate constants after breakfast, lunch, dinner and snack. The FB, FL, FD and FS are factors for the estimation of the total amounts of glucose absorbed after ingestion of the corresponding meals. All initial conditions were zero. Input (mg h−1) is the rate of glucose input into the gut compartment calculated as
The total amount of glucose in the gut compartment (Glcgut, mg) was
The concentration of active GLP-1 in plasma (Cglp, pm) was
 |
where kin_glp (pm h−1) was the rate of active GLP-1 secretion at baseline, i.e. in the fasting state, and kout_glp_lin (h−1) was the first-order elimination rate constant for active GLP-1 eliminated by a non-saturable pathway. The elimination of GLP-1 by DPP-4 was saturable and described by (RmaxC−DRC× cf2, as explained below. The initial condition was the active GLP-1 concentration at baseline (Bglp).
The extent of stimulation of active GLP-1 secretion was assumed to be proportional to the total amount of glucose in the gut (Glcgut, mg) which was changing over time and S1 (mg−1) was the proportionality factor. The (RmaxC−DRC) described the amount of free DPP-4 enzyme in plasma changing over time, calculated as the difference between the amount of total DPP-4 (DPP-4 available for binding of vildagliptin at zero concentration of vildagliptin) and the amount of the DPP-4-vildagliptin complex. The (RmaxC−DRC ) denotes the free DPP-4 enzyme and comes from the PK model for vildagliptin and DPP-4 described in the companion article [7]. The rate of elimination of active GLP-1 by DPP-4 changed over time and was proportional to the amount of free DPP-4 in plasma (nmol) with cf2 (h−1 nmol−1) as the proportionality factor. The steady-state condition was
The GLP-1 model parameters were estimated simultaneously with the equations for vildagliptin PK and DPP-4 activity described in the companion article [7]. Then the equations for glucose and insulin were added.
The glucose absorption rate from the gut compartment was
where Vglc (dl) is the volume of distribution of glucose.
The glucose concentration in plasma (Cglc) was
where kin_glc (mg dl−1 h−1) is the endogenous production rate of glucose, kout_glc (h−1) is the first-order rate constant of glucose elimination, Cins (mIU l−1) is insulin concentration, and Bins is insulin concentration at baseline. The initial condition is the glucose concentration at baseline (Bglc). The steady-state condition was
The STins (l mIU−1) describes the extent of stimulation of glucose utilization by insulin concentrations above baseline (Cins−Bins) and therefore is a measure of peripheral insulin sensitivity based on the model described here. The STins value depends on the GLP-1 concentration (Cglp):
where S5 (l mIU−1) is the stimulation factor for glucose utilization by insulin when GLP-1 concentrations are at baseline (Cglp = Bglp). The proportionality factor S4 (l pmol−1) describes the increase of peripheral insulin sensitivity by active GLP-1 concentrations above baseline (Cglp > Bglp), i.e. the same concentration of insulin has a larger effect on glucose utilization when GLP-1 concentrations are increased compared with when GLP-1 concentrations are low.
The concentration of insulin in plasma (mIU l−1) was
where kin_ins (mIU l−1 h−1) is the endogenous production rate of insulin and kout_ins (h−1) is the first order rate constant for insulin elimination. The initial condition is the insulin concentration at baseline (Bins). The steady-state condition was
The STglc (dl mg−1) describes the extent of stimulation of insulin secretion by glucose concentrations above baseline which is enhanced by active GLP-1
where S3 (dl mg−1) is the stimulation factor for insulin secretion by glucose when GLP-1 concentrations are at baseline. The proportionality factor S2 (l pmol−1) describes the increase of pancreatic glucose sensitivity by active GLP-1 concentrations above baseline.
In the full PK/PD model all PK (shown in the companion report [7]) and PD parameters were estimated at the same time.
Individual PD model
Between subject variability (BSV) was included for all estimated PD parameters. A log-normal distribution was assumed and a full variance-covariance matrix for the PD parameters was included. A full variance-covariance matrix was also implemented for the PK parameters. No covariance was included between PK and PD parameters. S-ADAPT estimates the BSV as variance. The square root of the variance is reported for BSV, as this is an approximation to the apparent coefficient of variation of a normal distribution on log-scale. Between occasion variability was not included.
Observation model
The residual unidentified variability was described by a combined additive and proportional error model for active GLP-1, glucose and insulin concentrations.
Results
All four periods of the study were completed by 12 subjects and one patient completed only the treatments with 10 and 25 mg vildagliptin. The average (range) weight of the subjects was 91 (65–116) kg, height 166 (148–183) cm and age 53.5 (37–64) years. Seven patients were female and six were male.
The observed concentrations of active GLP-1, glucose and insulin from all individual subjects and for all study periods are shown in Figures 2 to 4. Plots of the individual profiles of active GLP-1, glucose and insulin (not shown here) revealed a relatively high variability between the patients with various degrees of type 2 diabetes. Post hoc fits for one subject and two different doses of vildagliptin are shown in Figure 5.
Figure 2.
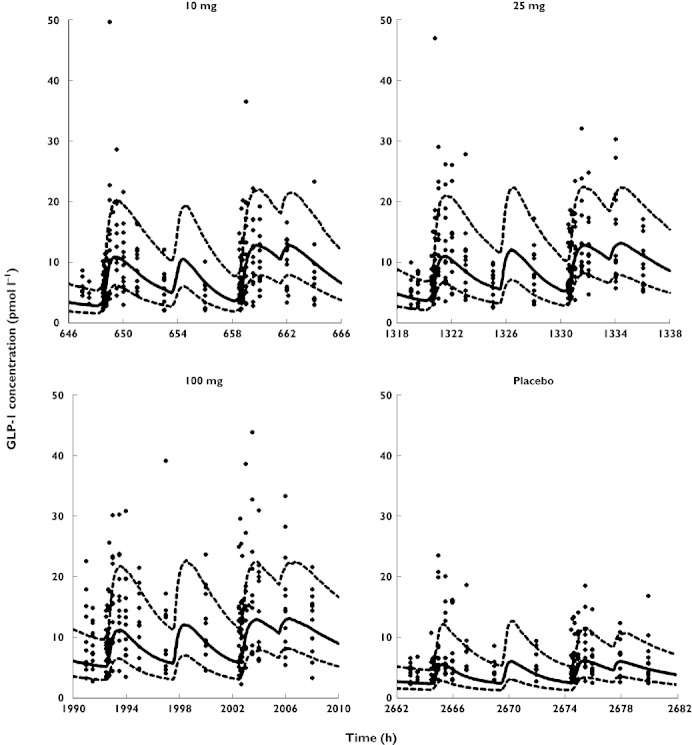
Visual predictive checks for plasma concentrations of active GLP-1. The plots show the observed data (filled diamonds), the median predicted concentrations (solid line) and the 80% prediction interval (10–90% percentile, broken lines). In order to show all data from each dose level in the same plot it was assumed in the graphs that everyone received the doses in the same sequence. The actual sequence of dosing was observed for every subject for all modelling and simulations
Figure 4.
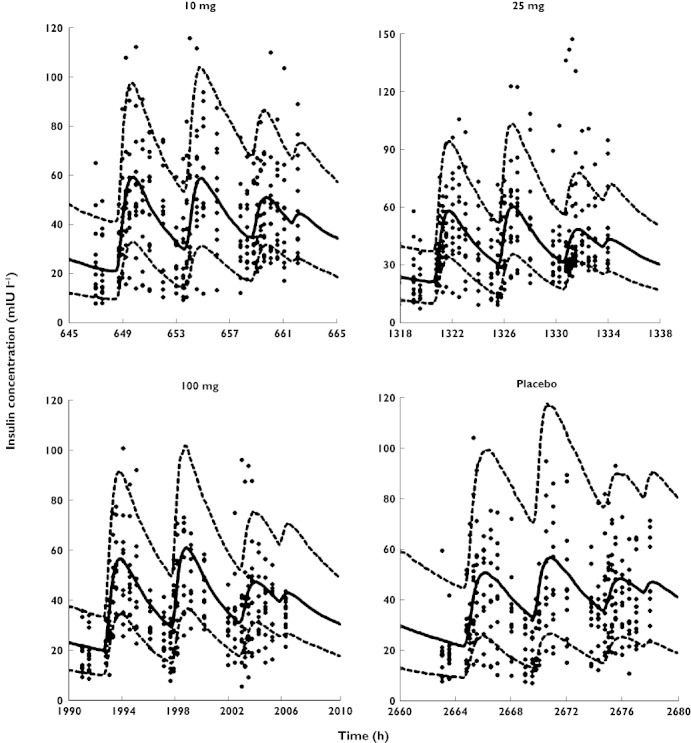
Visual predictive checks for plasma concentrations of insulin vs. time. Symbols are defined in Figure 2
Figure 5.
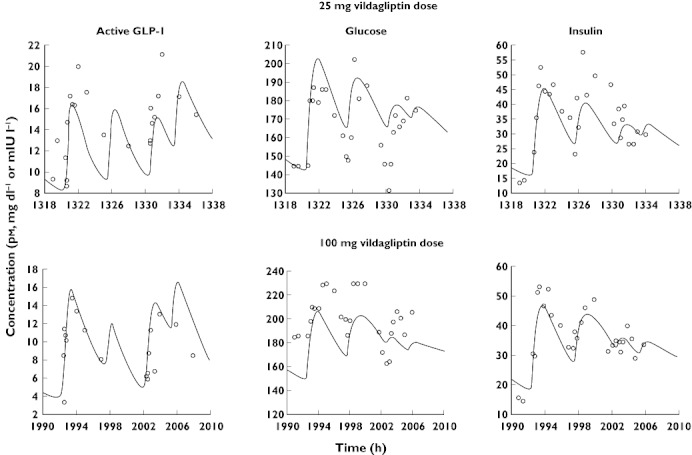
Post hoc fits for active GLP-1, glucose and insulin from one subject
Figure 3.
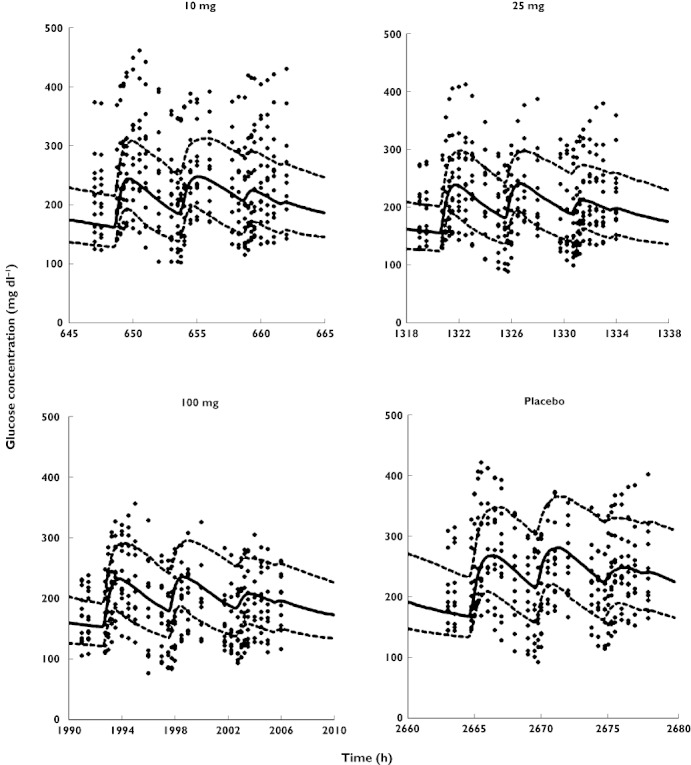
Visual predictive checks for plasma concentrations of glucose vs. time. Symbols are defined in Figure 2
The individual ratios of AUCtreated : AUCplacebo for GLP-1, glucose and insulin vs. the AUC of vildagliptin are presented in Figure 6. The AUC of active GLP-1 was higher during vildagliptin treatment than during placebo treatment and the AUCtreated : AUCplacebo increased with increasing AUCvildagliptin for all subjects except one. At an AUCvildagliptin of 500 ng ml−1 h or larger, the individual AUCglucose values were lower than with placebo treatment for almost all subjects. Overall the AUCtreated : AUCplacebo for glucose decreased with increasing AUCvildagliptin. The AUCtreated : AUCplacebo for insulin did not show a clear trend with increasing AUCvildagliptin as insulin concentrations and insulin AUC were similar among all treatments.
Figure 6.
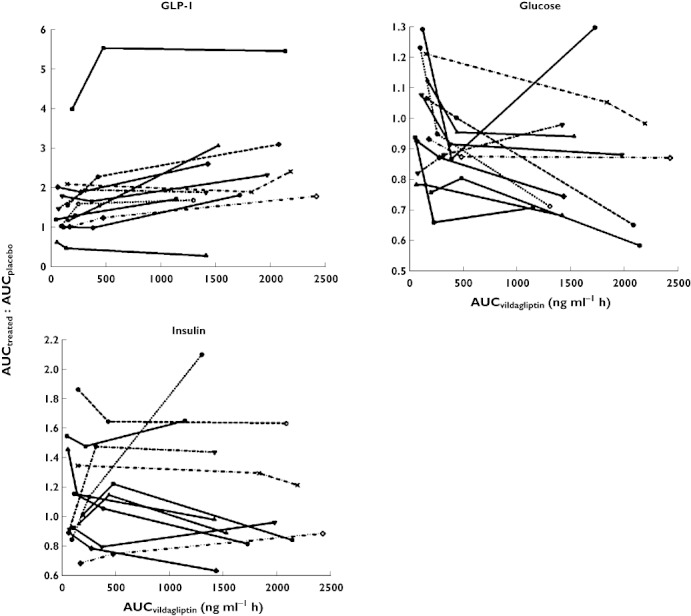
AUCtreated : AUCplacebovs. AUCvildagliptin for GLP-1, glucose and insulin in each patient (connected symbols)
Mechanism-based compartmental modelling
The parameter estimates and their BSV are reported in Table 1. The inclusion of each of the main model features based on objective function differences and mechanistic reasons is substantiated in Table 2. The profiles of active GLP-1, glucose and insulin were described by one set of parameter estimates for all three doses of vildagliptin and placebo treatment. The parameters S1 to S5 are stimulation factors which are multiplied by the changing GLP-1, glucose or insulin concentrations and thereby describe their effects. The newly developed model includes the secretion of active GLP-1 which is stimulated by food intake and the elimination of active GLP-1 by saturable metabolism due to DPP-4 and an additional linear elimination pathway. Inclusion of the additional elimination pathway which is not saturable at the achieved GLP-1 concentrations was necessary to describe the profiles. The model suggests that, at complete inhibition of DPP-4 in plasma, the half-life of active GLP-1 in plasma was increased by approximately 2.5-fold compared with no inhibition of DPP-4. The half-life of active GLP-1 at complete DPP-4 inhibition was calculated from the estimate of kout_glp_lin and the half-life at 0% (absence) of DPP-4 inhibition was calculated from (kout_glp_lin+RmaxC× cf2). The profiles of active GLP-1 elimination by DPP-4 ((RmaxC−DRC) × cf2), expressed as a ‘rate constant’ which changes over time, are shown in Figure 7A. The GLP-1 elimination due to DPP-4 depends on the available free DPP-4 and therefore decreases with decreasing DPP-4 activity (see companion article [7], vildagliptin is both an inhibitor and substrate of DPP-4) after a vildagliptin dose and is constant for placebo treatment.
Table 1.
Population parameter estimates
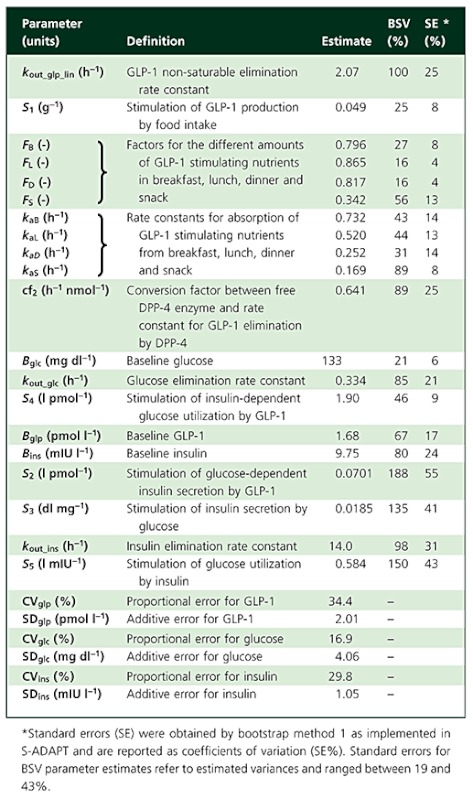 |
Table 2.
Inclusion of model features based on objective function differences and mechanistic reasons
| Model feature | ΔOBJ | Comments |
|---|---|---|
| GLP-1 metabolism by DPP-4, based on changing amounts over time of free DPP-4 as estimated in the TMDD model | +516 | DPP-4 is known to metabolize active GLP-1 [2]. Inclusion of this elimination pathway together with the non-saturable elimination pathway adequately described the data. |
| Additional non-saturable elimination pathway for active GLP-1 | +202 | Active GLP-1 is metabolized also by neprilysin [19, 20] and potentially renally excreted [21]. Our data show that GLP-1 decreases while DPP-4 is 100% inhibited. |
| Stimulation of GLP-1 secretion proportional to amount of glucose in the absorption compartment | +218 | GLP-1 is secreted from L-cells in the gut wall upon contact with nutrients [2]. This effect adequately described the increasing GLP-1 concentrations after the meals. |
| Different F and ka for nutrient absorption from the different meal types | +373 | GLP-1 is secreted in response to nutrients in the gut, especially carbohydrate and fat [2, 25]. The meals (breakfast, lunch, dinner, snack) had different energy contents and composition of nutrients. Therefore estimating different absorption parameters was physiologically plausible. The different extent of the glucose and insulin excursions after the different meal types even in the placebo group required different absorption parameters. As meals were standardized over all study periods and glucose and GLP-1 were co-modelled, different F and ka could be identified. |
| Effect of glucose stimulating insulin secretion | +699 | Stimulation of insulin secretion by glucose is described in the literature. |
| GLP-1 increases the effect of glucose stimulating insulin secretion | +222 | This effect of GLP-1 (increased pancreatic glucose sensitivity) is described in the literature [2]. The effect of GLP-1 on glucose dependent insulin secretion was necessary to describe the data, as glucose concentrations decrease with increasing vildagliptin doses while insulin concentrations are similar across treatments. |
| Effect of insulin stimulating glucose utilization | +191 | Stimulation of glucose utilization by insulin is reported in the literature. |
| GLP-1 increases the effect of insulin on glucose utilization | +69.4 | The enhancement of this insulin effect by GLP-1 (increased peripheral insulin sensitivity) has been reported in the literature for type 2 diabetes [27, 29, 30]. It was necessary to describe the data as insulin concentrations are similar over all treatments but glucose concentrations decrease with increasing vildagliptin dose. |
ΔOBJ, objective function difference vs. the full model; OBJ = – log-likelihood.
Figure 7.
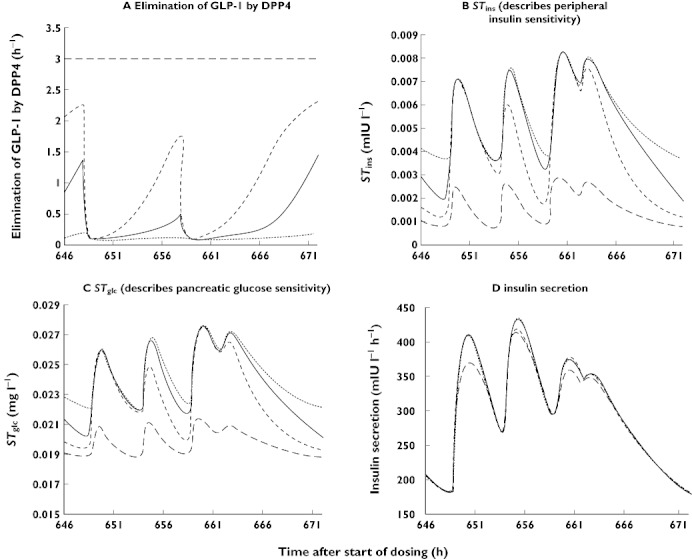
Simulations of model subparts describing elimination of GLP1 by DPP-4, STins, STglc, and insulin secretion. 100 mg ( ); 25 mg (
 ); 10 mg (
 ); placebo (
 )
)
The model includes the reciprocal feedback between glucose and insulin with stimulation of insulin secretion by glucose (STglc) and stimulation of glucose utilization by insulin (STins). These effects occur at baseline GLP-1 concentrations (where STglc = S3 and STins = S5) and are increased at higher concentrations of GLP-1. The changes in STglc and STins over time are depicted in Figure 7B, C. Both the stimulation of insulin secretion per concentration unit of glucose (STglc, l mg−1) and stimulation of glucose utilization per concentration unit of insulin (STins, l mIU−1) depend on active GLP-1 concentration. Therefore STglc (Figure 7C) and STins (Figure 7B) are increased when vildagliptin is given compared with placebo. The GLP-1 effect of increasing the stimulation of insulin secretion (S2× (Cglp−Bglp)) by glucose reflects an increase in pancreatic glucose sensitivity. The effect of GLP-1 on increasing the insulin-dependent glucose utilization (S4× (Cglp–Bglp)) describes enhanced peripheral insulin sensitivity due to GLP-1. Thereby the decrease in glucose concentrations with the higher vildagliptin doses despite similar insulin concentrations among treatments could be successfully described. Inclusion of both GLP-1 effects (S2 and S4) was necessary in order to describe adequately the data. Comparison of simulated glucose profiles when one of the two effects was set to zero suggests that the effect on peripheral insulin sensitivity (described by S4) was slightly larger than the effect on pancreatic glucose sensitivity (described by S2).
Insulin secretion (mIU l−1 h−1) as predicted by the model from (kin_ins× (1 +STglc× (Cglc–Bglc)) is shown in Figure 7D. Based on comparison of the profiles between placebo and the three different doses of vildagliptin the model suggests that insulin secretion was similar for all four treatments. The profiles for STglc, STins and insulin secretion in Figure 7B, C, and D suggest that the effect of vildagliptin was not mainly due to an increase in insulin secretion but due to increased insulin sensitivity.
The model estimates for FB, FL, FD and FS, suggested that the amount of glucose absorbed was highest after lunch and lowest after a snack. The rate of glucose absorption appeared to be most rapid after breakfast (kaB).
The estimates for BSV and residual variability in Table 1 suggest that the majority of the variability apparent in the observed data was due to variability between the individual patients as compared with assay variability and other unexplained residual variability. Standard errors reported in Table 1 were obtained by bootstrap method 1 as implemented in S-ADAPT [8]. For several parameters standard errors were smaller than expected and should be interpreted conservatively. Several other methods for obtaining standard errors available in S-ADAPT were tested and provided overall comparable results.
The visual predictive checks are presented in Figures 2 to 4 and show highly sufficient predictive performance for active GLP-1, glucose and insulin at the three different dose levels and placebo, also considering that no between occasion variability was included due to model complexity and in order to avoid potentially masking any systematic differences. Also due to lack of between occasion variability in the model, misfits of the observed glucose baseline which had high variability occurred in some patients and periods. However overall the fittings and predictions were acceptable considering the model complexity and the variability in the observed data.
For further evaluation of model performance, observed vs. individual fitted and observed vs. population fitted GLP-1, glucose and insulin concentrations are shown in Figures 8 and 9, both on linear and on logarithmic scales. The plots show adequate fits for all three PD outcomes, as a similar number of points is distributed on each side of the line of identity. The plots for GLP-1 might appear to show a bias but this is due to the fact that for GLP-1 a considerable fraction of the observations (14% in total, 28% for the placebo treatment) was below the LLQ of 2 pmol l−1. Those observations were taken into account by the Beal M3 method in the model, however they cannot be shown in the goodness of fit plots. The LLQ is shown in Figures 8 and 9 by the horizontal line at an observed concentration of 2 pmol l−1 and the part of the graph below that line is necessarily blank. Some patients had a few very high concentrations for GLP-1 and insulin which were not captured by the population fits as they were only observed in some patients. The normalized prediction distribution errors for each dose and PD outcome are shown in Figure 10.
Figure 8.
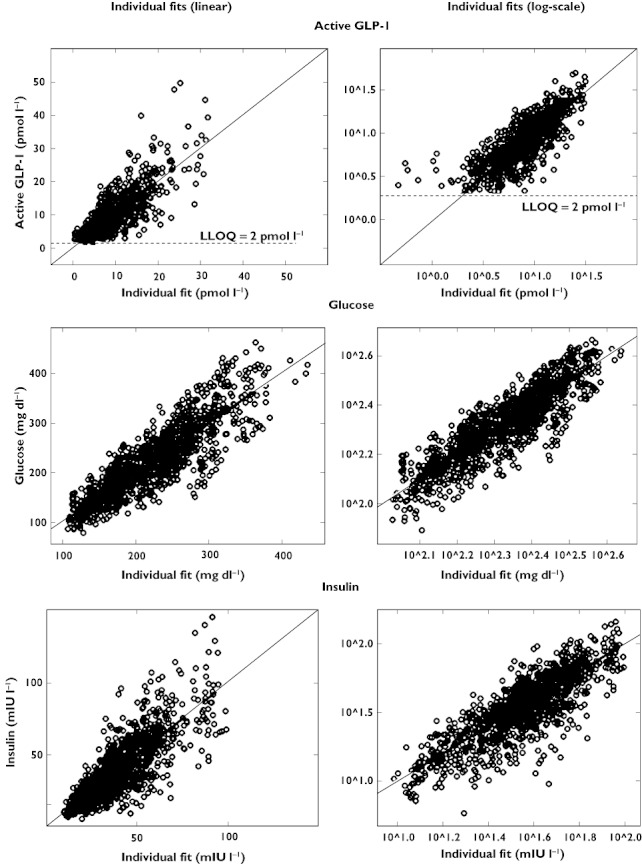
Observed vs. individual fitted active GLP-1, glucose and insulin concentrations
Figure 9.
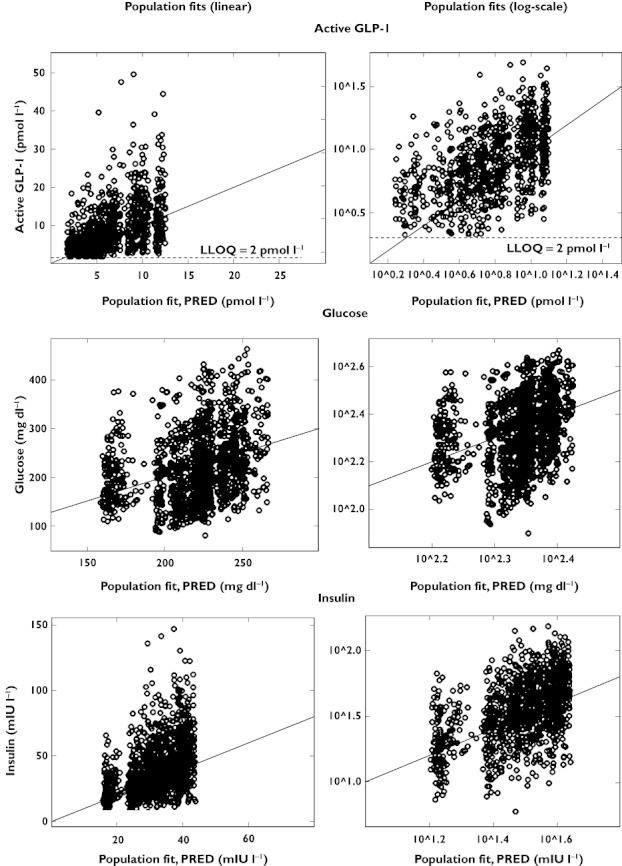
Observed vs. population fitted active GLP-1, glucose and insulin concentrations
Figure 10.
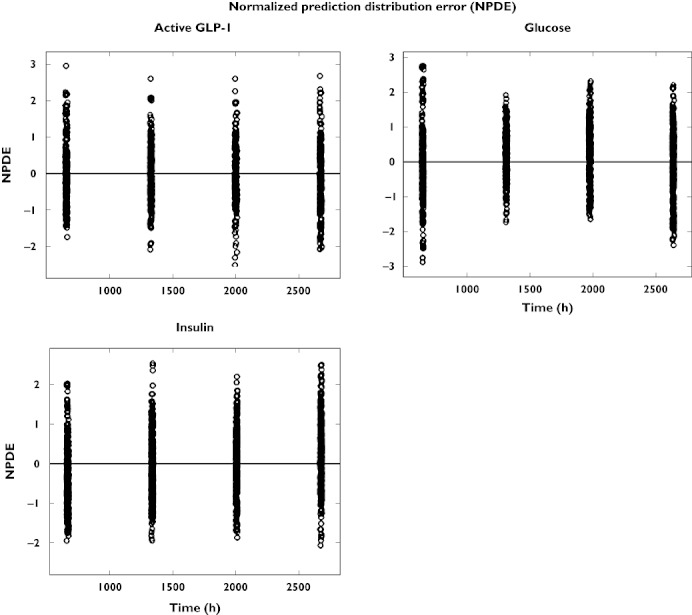
Normalized prediction distribution error (NPDE) vs. time for active GLP-1, glucose and insulin concentrations
Discussion
Most of the published models describing drug effects of anti-diabetic agents focus on glucose or insulin [10]. In most models which include both, glucose and insulin are not modelled simultaneously but one is fixed while the other is modelled and vice versa[11]. The reciprocal glucose insulin feedback was previously modelled utilizing indirect response models which describe the production and loss of glucose and insulin, the effect of glucose on insulin secretion and the effect of insulin on glucose utilization [12]. The effect of the incretin analogue, exenatide, on insulin secretion during a hyperglycaemic clamp study was explored by Mager et al. [13] through an adapted minimal model [14]. Silber et al. and Jauslin et al. [15, 16] developed a model which simultaneously described glucose and insulin profiles after various diagnostic tests, such as i.v. and oral glucose tolerance tests and clamp studies. As data from both i.v. and oral glucose doses were available, an incretin effect could be included despite the GLP-1 concentrations not being measured. Recently, Chan et al. [17] described the effect of i.v. GLP-1 on first and second phase insulin secretion during IVGTT in mice by a modified insulin kinetic model from [14]. Gao & Jusko [18] modelled the short-term effect of the incretin mimetic exendin-4 in diabetic rats as a stimulation of insulin secretion. The delayed increase in glucose concentrations after the exendin doses was described as an increase in glucose production.
In the present study active GLP-1 concentrations and DPP-4 activity were measured in addition to glucose and insulin, so that the production, loss and effects of active GLP-1 could be modelled directly. In our newly developed model, the kinetics and effects of glucose, insulin and active GLP-1 were described utilizing indirect response models and multiple reciprocal feedback processes were included (Figure 1). All parameters and their BSV and covariances from the combined PK and PD model were estimated simultaneously. Successful development and running of this model was possible in parallelized S-ADAPT with the MC-PEM algorithm but not in NONMEM VI FOCE. The MC-PEM algorithm is a state-of-the-art approach which calculates the exact maximum likelihood. The ability to parallelize an S-ADAPT run on as many computer cores as there are subjects considerably decreased the run times, even with MC-PEM, the Beal M3 method and full variance-covariance matrices for both the PK and the PD parts included in the model.
By modelling the active GLP-1 concentrations simultaneously with DPP-4 activity and vildagliptin PK, two elimination pathways could be distinguished for active GLP-1: metabolism by DPP-4 and an additional pathway which was not saturable and not influenced by vildagliptin within the range of concentrations observed in the present study. The latter elimination pathway might be due to GLP-1 metabolism by neutral endopeptidase 24.11 (NEP, neprilysin) [19, 20] or potentially renal excretion. However renal excretion was found to be most relevant for GLP-1 metabolites and not active GLP-1 in a study in patients with chronic renal insufficiency [21].
Limitations of the current analysis were that glucose-dependent insulinotropic peptide (GIP) and glucagon were not included. However, during the model building process the most important subsystems need to be identified as in a large and complex system not all effects may be included at once and simultaneously in a model. In type 2 diabetes the effect of GIP was reported to be decreased [2, 5, 22, 23]; therefore GIP was not included in the present model in addition to GLP-1. The data from this study were adequately described and predicted based on the GLP-1 effect. Glucagon effects were reported to be most important in the fasting state whereas in the fed state, such as in the present study, the effect of insulin on glucose utilization is more important for glucose homeostasis [24].
The stimulation of GLP-1 secretion from the L-cells [2] in the gut wall was described as a local effect driven by the amount of glucose in the absorption compartment [2, 25]. Addition of a neural effect, e.g. triggered by food entering an additional stomach compartment, did not improve the model fits. The food intake was not modelled as a bolus dose which would not have been a realistic interpretation but as a zero order process with the duration of the individual recorded time taken by each subject for food consumption. One absorption compartment was used to describe the stomach and the gut. The GLP-1 stimulating effect started when food first entered the absorption compartment and lasted as long as nutrients were left there. Consequently both effects were encompassed in one process which adequately described both the increase in GLP-1 secretion and the increase in glucose concentrations due to absorption from the meals. Trying to separate the early (most likely neuronal) and the later (due to direct contact of the nutrients with the gut wall) effects, did not improve the model fits. Also, our objective was to describe the whole system instead of describing a small part with the most detail.
The model assumed that the stimulation of GLP-1 secretion was proportional to the amount of glucose in the gut, i.e. that the amount of GLP-1 stimulating nutrients in the meals was proportional to the amount of glucose which was absorbed from those meals. GLP-1 secretion is stimulated by individual nutrients and also by mixed meals, especially those with high carbohydrate and fat content [2]. The standardized meals were composed of 55% carbohydrate, 25% fat and 20% protein and therefore the carbohydrate content was likely responsible for a major part of stimulating effects on GLP-1 secretion.
The estimated amounts of glucose absorbed after each meal were driven by the observed increases both in the glucose concentrations and in the active GLP-1 concentrations simultaneously in order to retain model identifiability. Different estimates for ka and F accounted for differences in the size and composition of the meals. As the meals were standardized throughout all study periods, these parameters were identifiable and including them did not mask any nonlinear relationships between the different vildagliptin doses. A linear absorption process was able to capture adequately the increase in glucose concentrations. The purpose of this part of the model was to describe adequately the glucose profiles and not to examine the mechanism of glucose absorption. Also the sampling schedule was not as tight as after glucose tolerance tests, so that this simplified glucose model was sufficient.
The kout_glc and therefore the glucose half-life were in the range of estimates previously reported in the literature and fell between the estimates from Jauslin et al. [26] and Lima et al. [12].
Both the GLP-1 effects on enhancing glucose-dependent insulin secretion [2] and on insulin-dependent glucose utilization were necessary to describe adequately the glucose data. This was also tested in simulations. While the observed plasma insulin concentrations were not changed by increasing doses of vildagliptin, similar concentrations of insulin were achieved despite lower glucose concentrations, which is described by the enhanced glucose-dependent insulin secretion. Also the same concentration of insulin had a larger effect in the presence of enhanced GLP-1 concentrations. Both aspects are beneficial for patients with type 2 diabetes.
The effect of GLP-1 on glucose utilization is not completely insulin-independent as it is only present when insulin concentrations are above baseline. Overall, results about the existence of an increase in glucose disposal due to GLP-1 at constant insulin concentrations are contradictory from different studies [27–37]. However based on published studies such an effect was generally present in insulin-resistant states, i.e. type 2 diabetic patients [27, 29, 30] and obese subjects [31], while it was mostly absent or not significant in non-insulin resistant, lean healthy volunteers [32–36] and T1DM patients [28]. Also the effect was observed at above basal concentrations of insulin and glucose [37], but not at very low glucose and insulin concentrations. Therefore, a GLP-1 effect on insulin-dependent glucose utilization in T2DM patients with above basal glucose and insulin concentrations over most of the observation period is in agreement with literature reports.
In addition to the reported model, models with a) GLP-1 dependent inhibition of glucose production by insulin plus GLP-1 dependent stimulation of glucose utilization by insulin, b) GLP-1 independent inhibition of glucose production by insulin plus GLP-1 dependent stimulation of glucose utilization by insulin and c) GLP-1 dependent inhibition of glucose production by insulin plus GLP-1 independent stimulation of glucose utilization by insulin were tested. These even more complex models did not lead to a notable improvement over the reported model using the dataset from our study. Also the parameter estimates for more than one GLP-1 dependent effect of insulin on glucose (inhibition of production plus stimulation of utilization) were not precisely estimable due to lack of information in the data. The insulin effect parameters for a GLP-1 independent effect of insulin were estimated to be extremely small, as there were very little differences between insulin concentrations at the different doses in our study (in addition to a high between subject variability). Therefore a driving force for such a GLP-1 independent effect of insulin was not observable in these data.
Models with just a GLP-1 dependent insulin effect on glucose production and no effect on utilization were also tested. Due to the very similar shapes of the curves generated by both models (indirect response model I and indirect response model IV) the models could not be clearly distinguished based on statistical criteria. Our reported model with the insulin effect on glucose utilization was chosen based on considering the combination of predictive performance, physiologically plausible estimates of population and variance parameters and goodness of fit. Evidence from the literature is available for the insulin effect on glucose utilization. Active GLP-1 increases glucose uptake in peripheral tissues [2] and vildagliptin was shown to increase glucose metabolism in peripheral tissues in type 2 diabetic patients [38].
The stimulatory effects of GLP-1, glucose and insulin are described by linear functions which only hold true for the middle part of the concentration–effect relationship. However including Smax and SC50 instead of the factors S1 to S5 did not improve the model performance. This might be due to the fact that the patients did not have extremely high or low glucose concentrations so that those parts of the concentration–effect relationship could not be explored here.
Dalla Man et al. [39] modelled the effects of i.v. GLP-1 on C-peptide secretion in healthy volunteers during a hyperglycaemic clamp by a standard two-stage approach. Based on a potentiation factor which depends on maximum GLP-1 concentration and GLP-1 AUC they report that an increase in active GLP-1 of 5 pmol l−1 resulted in a 60% increase in insulin secretion above baseline. Our estimate for S2 suggests an increase in insulin secretion of 35% for a 5 pmol l−1 increase in GLP-1 for the range of GLP-1, glucose and insulin concentrations observed in the study. Potential reasons for the difference are: 1) C-peptide was not included in our model, 2) Dalla Man et al. studied constant glucose and mostly constant GLP-1 concentrations with stimulation of insulin secretion as the only effect of GLP-1 and 3) they assessed considerably higher GLP-1 concentrations and healthy volunteers instead of type 2 diabetic patients.
Whereas our study showed a decrease in glucose concentrations after vildagliptin treatment in type 2 diabetic patients, Bock et al. [40] reported no effect of sitagliptin on glucose concentrations or insulin secretion in subjects with impaired fasting glucose (IFG) despite modest increases in post-prandial active GLP-1 concentrations. The authors suggest that this was due to the only modestly increased glucose concentrations in IFG and incretin induced insulin secretion being glucose dependent. Also DPP-4 inhibition was shown to have no effect on glucose concentrations and insulin secretion in healthy volunteers [41].
Our model addressed some important issues in diabetes modelling by taking into account the contribution of incretin hormones. It is a mechanism-based model for a subsystem of the glucose-insulin-incretin (GLP-1) system which has not been modelled extensively before. This newly proposed model is successful in describing the PK and PD effects of a new anti-diabetic agent, vildagliptin. It includes the reciprocal feedback between glucose and insulin and the effect of food on the glucose-insulin-incretin (GLP-1) system. The PD part of the model is expected to be applicable to all DPP-4 inhibitors, whereas the TMDD part of the model described in the companion report [7] is specific for a DPP-4 inhibitor like vildagliptin which is also a substrate of DPP-4. Recently, Marfella et al. reported significantly larger effects of vildagliptin on intact (active) GLP-1 concentrations during postprandial periods as compared with sitagliptin in patients with type 2 diabetes after 3 months treatment, which also translated to better glycaemic control based on the mean amplitude of glycaemic excursions [42]. The results from current modelling may provide some explanation for the observed difference in active GLP-1 profiles. Vildagliptin significantly increased the half-life of active GLP-1 (2.5-fold) which might be attributed to its tighter binding to DPP-4 as an inhibitor and additionally as a substrate of DPP-4. Sitagliptin is only a DPP-4 inhibitor with fast on-off binding to DPP-4, leading to little impact on the elimination of active GLP-1 due to the fact that the apparent half-life of active GLP-1 is secretion rate-limited in this situation.
From the analytical perspective this modelling experiment showed that parallelized S-ADAPT with the MC-PEM algorithm was the method of choice for the analysis of this complex population PK/PD model.
Mechanism-based PK/PD modelling described here may be used 1) to predict the effect of other dosage regimens, 2) to support the design of future clinical trials, 3) to compare the detailed and distinct mechanisms of actions of drugs within the same class, 4) to aid the understanding of the potential underlying mechanism of actions on the glucose-insulin-incretin system and 5) to be modified and expanded to other classes of anti-diabetic drugs in the incretin therapy arena. The present PD model is based on the underlying system, i.e. the interrelationships of the complex system of glucose-insulin-GLP-1 and DPP-4, and the PK and effects of vildagliptin on this system are separate components added on to that. Therefore the model for the underlying system may be modified to include the effects of other drugs on this system, or even the effects of combination treatments which are frequently utilized to treat type 2 diabetic patients.
Acknowledgments
This work was supported by the UB-Pfizer Strategic Alliance (CBL, WJJ), Novartis Institutes for BioMedical Research (YLH), and NIH Grant GM 57980 (WJJ).
Competing Interests
YLH is an employee of Novartis and holds Novartis stocks.
REFERENCES
- 1.European Medicines Agency (EMEA) 2007. Scientific discussion vildagliptin.
- 2.Baggio LL, Drucker DJ. Biology of incretins: GLP-1 and GIP. Gastroenterology. 2007;132:2131–57. doi: 10.1053/j.gastro.2007.03.054. [DOI] [PubMed] [Google Scholar]
- 3.Naslund E, Bogefors J, Skogar S, Gryback P, Jacobsson H, Holst JJ, Hellstrom PM. GLP-1 slows solid gastric emptying and inhibits insulin, glucagon, and PYY release in humans. Am J Physiol. 1999;277:R910–6. doi: 10.1152/ajpregu.1999.277.3.R910. [DOI] [PubMed] [Google Scholar]
- 4.Drucker DJ, Nauck MA. The incretin system: glucagon-like peptide-1 receptor agonists and dipeptidyl peptidase-4 inhibitors in type 2 diabetes. Lancet. 2006;368:1696–705. doi: 10.1016/S0140-6736(06)69705-5. [DOI] [PubMed] [Google Scholar]
- 5.Nauck MA, Heimesaat MM, Orskov C, Holst JJ, Ebert R, Creutzfeldt W. Preserved incretin activity of glucagon-like peptide 1 [7-36 amide] but not of synthetic human gastric inhibitory polypeptide in patients with type-2 diabetes mellitus. J Clin Invest. 1993;91:301–7. doi: 10.1172/JCI116186. [DOI] [PMC free article] [PubMed] [Google Scholar]
- 6.He YL, Serra D, Wang Y, Campestrini J, Riviere GJ, Deacon CF, Holst JJ, Schwartz S, Nielsen JC, Ligueros-Saylan M. Pharmacokinetics and pharmacodynamics of vildagliptin in patients with type 2 diabetes mellitus. Clin Pharmacokinet. 2007;46:577–88. doi: 10.2165/00003088-200746070-00003. [DOI] [PubMed] [Google Scholar]
- 7.Landersdorfer CB, He Y-L, Jusko WJ. Mechanism-based population pharmacokinetic modelling in diabetic patients: vildagliptin as a tight binding inhibitor and substrate of dipeptidyl peptidase IV. Br J Clin Pharmacol. 2012;73:391–401. doi: 10.1111/j.1365-2125.2011.04108.x. [DOI] [PMC free article] [PubMed] [Google Scholar]
- 8.Bauer RJ. 2008. S-ADAPT/MCPEM user's guide (version 1.56). Software for Pharmacokinetic, Pharmacodynamic and Population Data Analysis. Berkeley, CA.
- 9.Beal SL. Ways to fit a PK model with some data below the quantification limit. J Pharmacokinet Pharmacodyn. 2001;28:481–504. doi: 10.1023/a:1012299115260. [DOI] [PubMed] [Google Scholar]
- 10.Landersdorfer CB, Jusko WJ. Pharmacokinetic/pharmacodynamic modelling in diabetes mellitus. Clin Pharmacokinet. 2008;47:417–48. doi: 10.2165/00003088-200847070-00001. [DOI] [PubMed] [Google Scholar]
- 11.Bergman RN. Minimal model: perspective from 2005. Horm Res. 2005;64(Suppl. 3):8–15. doi: 10.1159/000089312. [DOI] [PubMed] [Google Scholar]
- 12.Lima JJ, Matsushima N, Kissoon N, Wang J, Sylvester JE, Jusko WJ. Modeling the metabolic effects of terbutaline in beta2-adrenergic receptor diplotypes. Clin Pharmacol Ther. 2004;76:27–37. doi: 10.1016/j.clpt.2004.03.006. [DOI] [PubMed] [Google Scholar]
- 13.Mager DE, Abernethy DR, Egan JM, Elahi D. Exendin-4 pharmacodynamics: insights from the hyperglycemic clamp technique. J Pharmacol Exp Ther. 2004;311:830–5. doi: 10.1124/jpet.104.069765. [DOI] [PMC free article] [PubMed] [Google Scholar]
- 14.Agerso H, Vicini P. Pharmacodynamics of NN2211, a novel long acting GLP-1 derivative. Eur J Pharm Sci. 2003;19:141–50. doi: 10.1016/s0928-0987(03)00073-3. [DOI] [PubMed] [Google Scholar]
- 15.Silber HE, Jauslin PM, Frey N, Karlsson MO. An integrated model for the glucose-insulin system. Basic Clin Pharmacol Toxicol. 2010;106:189–94. doi: 10.1111/j.1742-7843.2009.00510.x. [DOI] [PubMed] [Google Scholar]
- 16.Silber HE, Frey N, Karlsson MO. An integrated glucose-insulin model to describe oral glucose tolerance test data in healthy volunteers. J Clin Pharmacol. 2010;50:246–56. doi: 10.1177/0091270009341185. [DOI] [PubMed] [Google Scholar]
- 17.Chan HM, Jain R, Ahren B, Pacini G, D'Argenio DZ. Effects of increasing doses of glucagon-like peptide-1 on insulin-releasing phases during intravenous glucose administration in mice. Am J Physiol Regul Integr Comp Physiol. 2011;300:R1126–33. doi: 10.1152/ajpregu.00687.2010. [DOI] [PMC free article] [PubMed] [Google Scholar]
- 18.Gao W, Jusko WJ. Pharmacokinetic and pharmacodynamic modeling of exendin-4 in type 2 diabetic Goto-Kakizaki rats. J Pharmacol Exp Ther. 2011;336:881–90. doi: 10.1124/jpet.110.175752. [DOI] [PMC free article] [PubMed] [Google Scholar]
- 19.Plamboeck A, Holst JJ, Carr RD, Deacon CF. Neutral endopeptidase 24.11 and dipeptidyl peptidase IV are both mediators of the degradation of glucagon-like peptide 1 in the anaesthetised pig. Diabetologia. 2005;48:1882–90. doi: 10.1007/s00125-005-1847-7. [DOI] [PubMed] [Google Scholar]
- 20.Hupe-Sodmann K, McGregor GP, Bridenbaugh R, Goke R, Goke B, Thole H, Zimmermann B, Voigt K. Characterisation of the processing by human neutral endopeptidase 24.11 of GLP-1(7-36) amide and comparison of the substrate specificity of the enzyme for other glucagon-like peptides. Regul Pept. 1995;58:149–56. doi: 10.1016/0167-0115(95)00063-h. [DOI] [PubMed] [Google Scholar]
- 21.Meier JJ, Nauck MA, Kranz D, Holst JJ, Deacon CF, Gaeckler D, Schmidt WE, Gallwitz B. Secretion, degradation, and elimination of glucagon-like peptide 1 and gastric inhibitory polypeptide in patients with chronic renal insufficiency and healthy control subjects. Diabetes. 2004;53:654–62. doi: 10.2337/diabetes.53.3.654. [DOI] [PubMed] [Google Scholar]
- 22.Lynn FC, Pamir N, Ng EH, McIntosh CH, Kieffer TJ, Pederson RA. Defective glucose-dependent insulinotropic polypeptide receptor expression in diabetic fatty Zucker rats. Diabetes. 2001;50:1004–11. doi: 10.2337/diabetes.50.5.1004. [DOI] [PubMed] [Google Scholar]
- 23.Augustyns K, Van der Veken P, Senten K, Haemers A. The therapeutic potential of inhibitors of dipeptidyl peptidase IV (DPP IV) and related proline-specific dipeptidyl aminopeptidases. Curr Med Chem. 2005;12:971–98. doi: 10.2174/0929867053507298. [DOI] [PubMed] [Google Scholar]
- 24.Raju B, Cryer PE. Maintenance of the postabsorptive plasma glucose concentration: insulin or insulin plus glucagon? Am J Physiol Endocrinol Metab. 2005;289:E181–6. doi: 10.1152/ajpendo.00460.2004. [DOI] [PubMed] [Google Scholar]
- 25.Roberge JN, Brubaker PL. Secretion of proglucagon-derived peptides in response to intestinal luminal nutrients. Endocrinology. 1991;128:3169–74. doi: 10.1210/endo-128-6-3169. [DOI] [PubMed] [Google Scholar]
- 26.Jauslin PM, Silber HE, Frey N, Gieschke R, Simonsson US, Jorga K, Karlsson MO. An integrated glucose-insulin model to describe oral glucose tolerance test data in type 2 diabetics. J Clin Pharmacol. 2007;47:1244–55. doi: 10.1177/0091270007302168. [DOI] [PubMed] [Google Scholar]
- 27.Meneilly GS, Greig N, Tildesley H, Habener JF, Egan JM, Elahi D. Effects of 3 months of continuous subcutaneous administration of glucagon-like peptide 1 in elderly patients with type 2 diabetes. Diabetes Care. 2003;26:2835–41. doi: 10.2337/diacare.26.10.2835. [DOI] [PubMed] [Google Scholar]
- 28.Meneilly GS, McIntosh CH, Pederson RA, Habener JF, Ehlers MR, Egan JM, Elahi D. Effect of glucagon-like peptide 1 (7-36 amide) on insulin-mediated glucose uptake in patients with type 1 diabetes. Diabetes Care. 2003;26:837–42. doi: 10.2337/diacare.26.3.837. [DOI] [PubMed] [Google Scholar]
- 29.Meneilly GS, McIntosh CH, Pederson RA, Habener JF, Gingerich R, Egan JM, Glucagon-like ED. peptide-1 (7-37) augments insulin-mediated glucose uptake in elderly patients with diabetes. J Gerontol A Biol Sci Med Sci. 2001;56:M681–5. doi: 10.1093/gerona/56.11.m681. [DOI] [PubMed] [Google Scholar]
- 30.Meneilly GS, McIntosh CH, Pederson RA, Habener JF, Gingerich R, Egan JM, Finegood DT, Elahi D. Effect of glucagon-like peptide 1 on non-insulin-mediated glucose uptake in the elderly patient with diabetes. Diabetes Care. 2001;24:1951–6. doi: 10.2337/diacare.24.11.1951. [DOI] [PubMed] [Google Scholar]
- 31.Egan JM, Meneilly GS, Habener JF, Elahi D. Glucagon-like peptide-1 augments insulin-mediated glucose uptake in the obese state. J Clin Endocrinol Metab. 2002;87:3768–73. doi: 10.1210/jcem.87.8.8743. [DOI] [PubMed] [Google Scholar]
- 32.Toft-Nielson M, Madsbad S, Holst JJ. The effect of glucagon-like peptide I (GLP-I) on glucose elimination in healthy subjects depends on the pancreatic glucoregulatory hormones. Diabetes. 1996;45:552–6. doi: 10.2337/diab.45.5.552. [DOI] [PubMed] [Google Scholar]
- 33.Orskov L, Holst JJ, Moller J, Orskov C, Moller N, Alberti KG, Schmitz O. GLP-1 does not not acutely affect insulin sensitivity in healthy man. Diabetologia. 1996;39:1227–32. doi: 10.1007/BF02658511. [DOI] [PubMed] [Google Scholar]
- 34.Larsson H, Holst JJ, Ahren B. Glucagon-like peptide-1 reduces hepatic glucose production indirectly through insulin and glucagon in humans. Acta Physiol Scand. 1997;160:413–22. doi: 10.1046/j.1365-201X.1997.00161.x. [DOI] [PubMed] [Google Scholar]
- 35.Vella A, Shah P, Reed AS, Adkins AS, Basu R, Rizza RA. Lack of effect of exendin-4 and glucagon-like peptide-1-(7,36)-amide on insulin action in non-diabetic humans. Diabetologia. 2002;45:1410–5. doi: 10.1007/s00125-002-0924-4. [DOI] [PubMed] [Google Scholar]
- 36.Ryan AS, Egan JM, Habener JF, Elahi D. Insulinotropic hormone glucagon-like peptide-1-(7-37) appears not to augment insulin-mediated glucose uptake in young men during euglycemia. J Clin Endocrinol Metab. 1998;83:2399–404. doi: 10.1210/jcem.83.7.4988. [DOI] [PubMed] [Google Scholar]
- 37.D'Alessio DA, Kahn SE, Leusner CR, Ensinck JW. Glucagon-like peptide 1 enhances glucose tolerance both by stimulation of insulin release and by increasing insulin-independent glucose disposal. J Clin Invest. 1994;93:2263–6. doi: 10.1172/JCI117225. [DOI] [PMC free article] [PubMed] [Google Scholar]
- 38.Azuma K, Radikova Z, Mancino J, Toledo FG, Thomas E, Kangani C, Dalla Man C, Cobelli C, Holst JJ, Deacon CF, He Y, Ligueros-Saylan M, Serra D, Foley JE, Kelley DE. Measurements of islet function and glucose metabolism with the dipeptidyl peptidase 4 inhibitor vildagliptin in patients with type 2 diabetes. J Clin Endocrinol Metab. 2008;93:459–64. doi: 10.1210/jc.2007-1369. [DOI] [PubMed] [Google Scholar]
- 39.Dalla Man C, Micheletto F, Sathananthan A, Rizza RA, Vella A, Cobelli C. A model of GLP-1 action on insulin secretion in nondiabetic subjects. Am J Physiol Endocrinol Metab. 2010;298:E1115–21. doi: 10.1152/ajpendo.00705.2009. [DOI] [PMC free article] [PubMed] [Google Scholar]
- 40.Bock G, Dalla Man C, Micheletto F, Basu R, Giesler PD, Laugen J, Deacon CF, Holst JJ, Toffolo G, Cobelli C, Rizza RA, Vella A. The effect of DPP-4 inhibition with sitagliptin on incretin secretion and on fasting and postprandial glucose turnover in subjects with impaired fasting glucose. Clin Endocrinol (Oxf) 2010;73:189–96. doi: 10.1111/j.1365-2265.2009.03764.x. [DOI] [PMC free article] [PubMed] [Google Scholar]
- 41.Herman GA, Stevens C, Van Dyck K, Bergman A, Yi B, De Smet M, Snyder K, Hilliard D, Tanen M, Tanaka W, Wang AQ, Zeng W, Musson D, Winchell G, Davies MJ, Ramael S, Gottesdiener KM, Wagner JA. Pharmacokinetics and pharmacodynamics of sitagliptin, an inhibitor of dipeptidyl peptidase IV, in healthy subjects: results from two randomized, double-blind, placebo-controlled studies with single oral doses. Clin Pharmacol Ther. 2005;78:675–88. doi: 10.1016/j.clpt.2005.09.002. [DOI] [PubMed] [Google Scholar]
- 42.Marfella R, Barbieri M, Grella R, Rizzo MR, Nicoletti GF, Paolisso G. Effects of vildagliptin twice daily vs. sitagliptin once daily on 24-hour acute glucose fluctuations. J Diabetes Complications. 2010;24:79–83. doi: 10.1016/j.jdiacomp.2009.01.004. [DOI] [PubMed] [Google Scholar]


