Abstract
An anti-pertussis toxin (PT) IgG enzyme-linked immunosorbent assay (ELISA) was analytically validated for the diagnosis of pertussis at a cutoff of 94 ELISA units (EU)/ml. Little was known about the performance of this ELISA in the diagnosis of adults recently vaccinated with tetanus-diphtheria-acellular pertussis (Tdap) vaccine, which contains PT. The goal of this study was to determine when the assay can be used following Tdap vaccination. A cohort of 102 asymptomatic health care personnel (HCP) vaccinated with Tdap (Adacel; Sanofi Pasteur) were aged 19 to 79 years (median, 47 years) at vaccination. For each HCP, specimens were available for evaluation at 2 to 10 time points (prevaccination to 24 months postvaccination), and geometric mean concentrations (GMC) for the cohort were calculated at each time point. Among 97 HCP who responded to vaccination, a mixed-model analysis with prediction and tolerance intervals was performed to estimate the time at which serodiagnosis can be used following vaccination. The GMCs were 8, 21, and 9 EU/ml at prevaccination and 4 and 12 months postvaccination, respectively. Eight (8%) of the 102 HCP reached antibody titers of ≥94 EU/ml during their peak response, but none had these titers by 6 months postvaccination. The calculated prediction and tolerance intervals were <94 EU/ml by 45 and 75 days postvaccination, respectively. Tdap vaccination 6 months prior to testing did not confound result interpretation. This seroassay remains a valuable diagnostic tool for adult pertussis.
INTRODUCTION
Pertussis, also known as whooping cough, is a highly contagious disease caused by the bacterium Bordetella pertussis. Pertussis remains endemic in the United States despite high vaccination coverage. Current diagnostic tools include real-time PCR (r-PCR), culture, and serology. Patients, particularly adolescents and adults, often do not present for diagnosis until later in the course of infection, when culture and r-PCR assays are no longer as effective in detecting the presence of the bacterium. Because 2 weeks is typically needed to mount an immune response, serology can be a useful adjunct for later diagnosis.
Numerous pertussis serodiagnostic assays are currently available worldwide, and recommendations for testing, interpretation of results, and harmonization of assays have been recently published (10, 23, 26). An anti-PT IgG enzyme-linked immunosorbent assay (ELISA) was developed in 2004 by the Center for Biologics Evaluation and Research (CBER) and the Centers for Disease Control and Prevention (CDC) as a ready-to-use kit for the diagnosis of pertussis infection in adolescents and adults (19). In 2005, Tdap, the adult tetanus-diphtheria-acellular pertussis vaccine that contains the same antigenic component as the ELISA, was licensed and recommended for adolescents and adults (4, 16). Postvaccination anti-pertussis toxin (PT) IgG antibody decay rates have been previously measured with various vaccine formulations, study populations, and ELISA methods (5, 7, 17, 22). However, little is known about whether a Tdap booster vaccination will induce antibody levels that will confound serodiagnostic interpretation.
In 2006, during a Tdap (Adacel; Sanofi Pasteur [SP]) vaccination campaign in response to a suspected pertussis outbreak, 106 asymptomatic health care personnel (HCP) were enrolled in a study to measure (using an alternate ELISA) their booster responses to vaccination. The initial protocol included prevaccination and 1-, 2-, and 4-week postvaccination blood draws (15). We extended this study to include additional blood samplings at 3, 6, 9, 12, 18, and 24 months postvaccination so that antibody response and decay kinetics could be further characterized specifically using the serodiagnostic ELISA. The objective of this expanded study was to determine the earliest time at which serodiagnosis can be used following Tdap vaccination.
(Part of this report was presented at the 9th International Bordetella Symposium, Baltimore, MD, 30 September to 3 October 2010.)
MATERIALS AND METHODS
Study protocol and ELISA.
The study protocol, including enrollment criteria, vaccine components, and demographics of the 106 enrolled HCP, were previously described (15). Extension of the study protocol was ethically approved by the Dartmouth College Committee for the Protection of Human Subjects and the Institutional Review Board of the CDC. The present study included additional samplings at 3, 6, 9, 12, 18, and 24 months postvaccination. At the time of blood collection, HCP were asked about potential pertussis illness or exposure.
Methods for the anti-PT IgG ELISA have been previously described (13, 19). The diagnostic ELISA is a single-point, single 1:100 dilution assay that contains six ready-to-use standards and three ready-to-use controls (negative, intermediate, and positive). The assay was originally calibrated to CBER lot 3 and later to the World Health Organization international reference standard 06/140 (29). All time points corresponding to an enrollee were tested on the same ELISA plate and added in duplicate wells. All values with a percent coefficient of variation (%CV) ≤25% were considered valid. Reported values of 15 to 480 EU/ml, the range of the four parameter logistic standard curve, were calculated as the average of two valid values from separate plates run on two different days. Specimens with values of <15 EU/ml and %CVs of >25% were tested a maximum of three times; thus, reported values of <15 EU/ml were either the average of two valid values or the average of three valid/invalid values. Antibody concentrations were classified according to proposed infection categories of negative (<49 EU/ml), indeterminate (49 to 93 EU/ml), and positive (≥94 EU/ml) and according to other cutoff points of 125 and 200 EU/ml (2, 6, 18, 19).
Study exclusions.
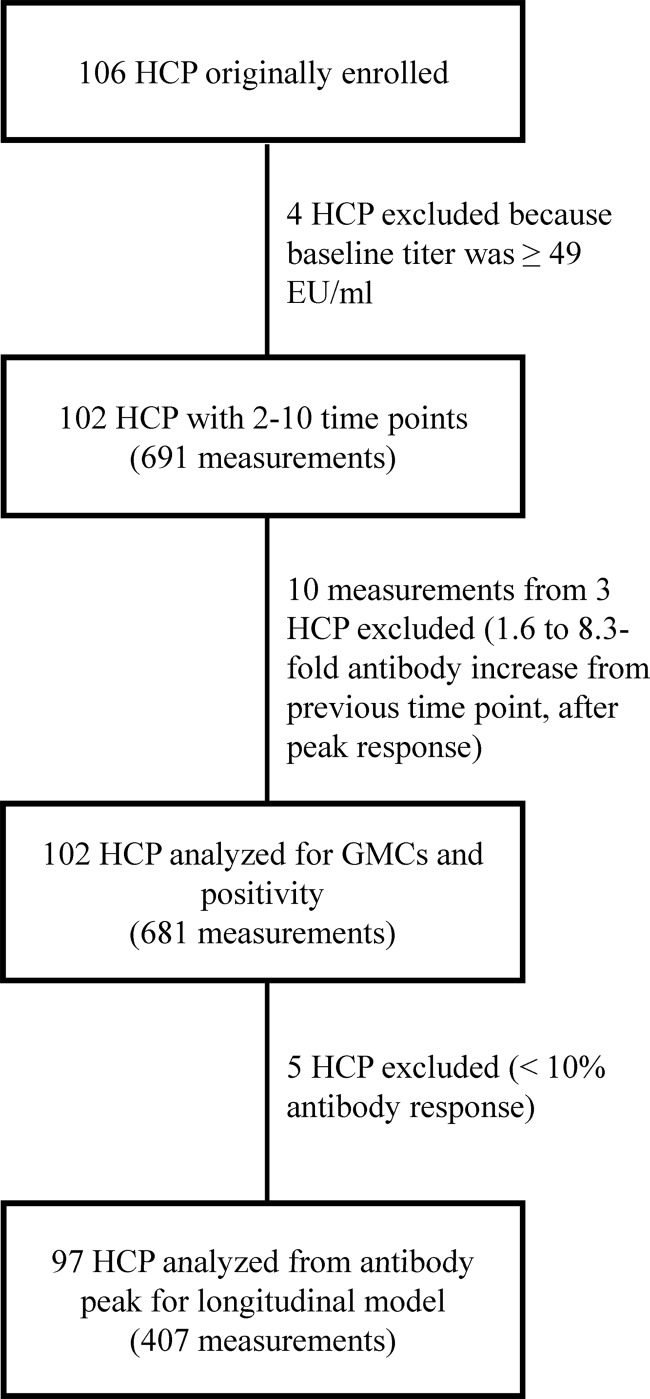
Four HCP with baseline antibody levels of ≥49 EU/ml, indicative of possible active infection by the proposed cutoff of 49 EU/ml (2, 19), were excluded, leaving 102 HCP available for analysis (Fig. 1). Of 101 HCP whose ages at vaccination were known, the median age was 47 years (range, 19 to 79 years), and of 100 HCP whose sexes were known, 59% were female.
Fig 1.
Flow chart of the study populations whose data were analyzed.
Each of the 102 HCPs had antibody titers measured at 2 to 10 of the time points (median, 7 measurements), and 31 subjects had antibody titers measured at all 10 time points (Fig. 1). Three HCPs had significant antibody titer increases (1.6- to 8.3-fold) that occurred weeks to months after the initial booster response and may have indicated possible exposure or infection; therefore, their increased antibody level measurements and all subsequent measurements (n = 10) were excluded. After these exclusions, a total of 681 measurements from the 102 HCP were available for analysis.
Statistical analyses.
Analyses were based on log-transformed antibody concentrations, log (antibody concentration + 1). Geometric mean concentrations (GMCs) and their 95% confidence intervals (CIs) were calculated in two ways. First, GMCs using all values were calculated, including those that fell outside the range of the standard curve. GMCs were also calculated using a statistical model that censored values of <15 EU/ml and assumed that all values followed a normal distribution (12). The mean and standard deviation in the model were estimated by maximum likelihood using the Newton-Raphson algorithm. The Newton-Raphson algorithm was carried out using SAS PROC NLP (25).
A longitudinal mixed-model analysis of antibody decay was used to estimate the time points at which certain antibody level thresholds were crossed (1, 9). The mixed-model analysis was restricted to HCP who had evidence of an antibody response within the first 4 weeks after vaccination and later decay. For each subject, we modeled the antibody decay starting at the peak level. The mixed model was fitted using restricted maximum-likelihood estimation in SAS PROC MIXED (24). The best-fitting model included a random intercept and slope for each subject and a first-order autoregressive within-subject covariance structure.
The population average antibody concentration for each day of the study period was calculated based on the results of the mixed model. The one-sided 95% upper prediction limits that measure the uncertainty of the estimated average antibody concentration for a single future specimen were then calculated. In addition to prediction limits, one-sided 95% upper tolerance limits that accounted for variation in the prediction limits were also calculated by bootstrapping methods (8, 11). Tolerance intervals are wider than prediction intervals because they contain at least a specified proportion (e.g., 95%) of the population with a high degree of confidence (e.g., 95%) (11, 14).
RESULTS
Four HCP experienced a prolonged cough, and three HCP had been exposed to someone with pertussis during the course of the extended study; however, only one HCP was excluded because the baseline titer was >49 EU/ml, indicative of possible recent infection or exposure. Of the 94 HCP (Fig. 1) who were tested at all of the time points from the baseline to 4 weeks postvaccination, 66 (70%), 30 (32%), and 13 (14%) had 2-, 4-, and 8-fold titer increases, respectively. Despite these increases, more than half of all specimens (397/681 or 58%) had antibody concentrations lower than the quantitative range of the standard curve, i.e., <15 EU/ml (Table 1). When values of <15 EU/ml were modeled by a normal distribution, the GMCs changed only slightly at 8.2 EU/ml, 21.3 EU/ml, and 9.4 EU/ml at prevaccination, 4 weeks postvaccination, and 12 months postvaccination, respectively (Table 1).
Table 1.
Anti-PT IgG GMCs of 102 vaccinated subjects by sampling time
| Sampling time (range) | na | GMC (95% CI), all values | No. (%) of values <15 EU/ml | GMC (95% CI), modelb |
|---|---|---|---|---|
| Baseline | 102 | 7.1 (6.0–8.4) | 82 (80.4) | 8.2 (7.1–9.4) |
| 1 (0.9–2.4) wk | 98 | 11.4 (9.4–13.7) | 62 (63.3) | 10.7 (8.8–13.0) |
| 2 (1.9–4.0) wk | 96 | 20.3 (16.7–24.5) | 40 (41.7) | 19.0 (15.6–23.3) |
| 4 (3.6–6.9) wk | 94 | 21.6 (18.0–25.9) | 33 (35.1) | 21.3 (17.7–25.6) |
| 3 (1.1–4.2) mo | 57 | 16.3 (12.8–20.8) | 26 (45.6) | 16.1 (12.7–20.4) |
| 6 (5.7–7.2) mo | 54 | 13.3 (10.4–16.9) | 31 (57.4) | 12.8 (10.1–16.2) |
| 9 (9.0–12.4) mo | 47 | 12.0 (9.4–15.3) | 30 (63.8) | 11.0 (8.6–14.1) |
| 12 (11.8–13.6) mo | 51 | 10.8 (8.6–13.5) | 36 (70.6) | 9.4 (7.4–12.0) |
| 18 (17.8–19.1) mo | 43 | 11.1 (8.6–14.1) | 30 (69.8) | 9.8 (7.5–12.6) |
| 24 (23.9–25.0) mo | 39 | 10.0 (7.6–13.1) | 27 (69.2) | 10.1 (7.8–13.0) |
Number of measurements available at each sampling time for the entire cohort. Note that for several subjects, specimens were not available for all sampling times between their prevaccination and last sampling times.
GMCs and 95% CIs were estimated from a statistical model that censored values of <15 EU/ml and assumed that all values followed a normal distribution.
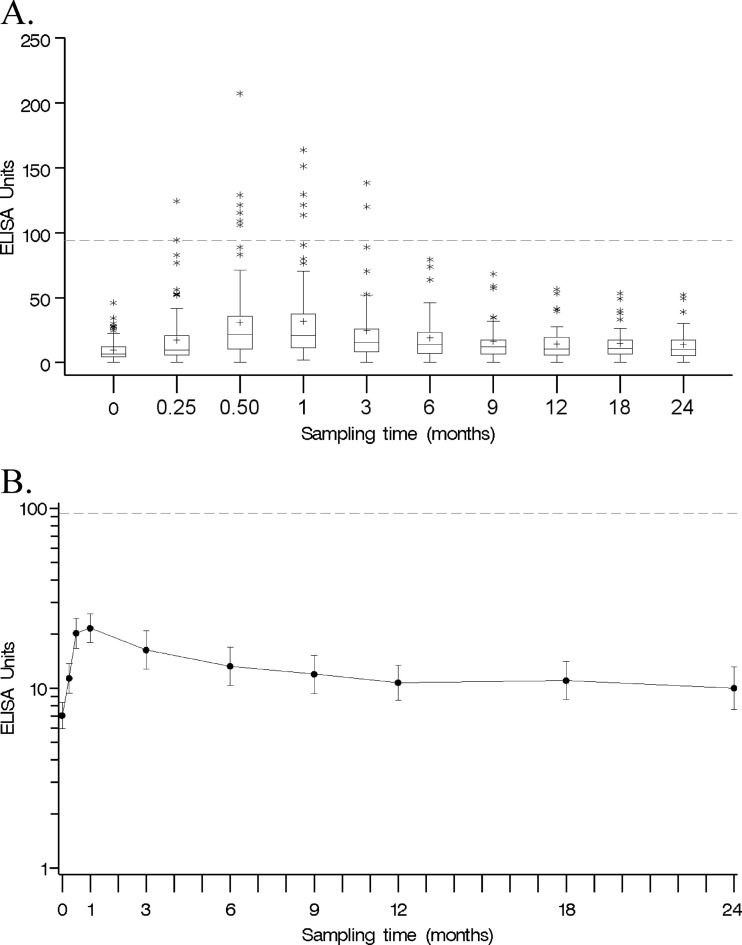
Similar antibody response patterns were observed among the HCP throughout the study period, with the widest difference in concentration observed during the antibody response peak, at 2 and 4 weeks postvaccination (Fig. 2A). The typical antibody decay profile was characterized by a rapid titer rise within 4 weeks of vaccination, followed by an equally rapid titer fall and then a slower decline or plateau (Fig. 2B). GMCs were classified by sampling times, with the lowest and highest concentrations observed at 7.1 and 21.6 EU/ml for the prevaccination and 4-week postvaccination sampling times, respectively (Table 1). The GMC decreased to 16.3 EU/ml at 3 months postvaccination and finally stabilized at 10.8 EU/ml at 12 months postvaccination (Table 1).
Fig 2.
(A) Box plot of antibody concentrations of 102 vaccinated subjects by sampling time. Each box displays the 25th percentile, median, mean (+), and 75th percentile. Whiskers are 1.5 times the interquartile range in length. Outliers are displayed as stars. Note that the x axis is not drawn to scale. The dashed line represents the proposed cutoff of 94 EU/ml. (B) Antibody GMCs (solid line) of 102 vaccinated subjects and 95% CIs of Tdap-vaccinated subjects by sampling time. The dashed line represents the proposed cutoff of 94 EU/ml.
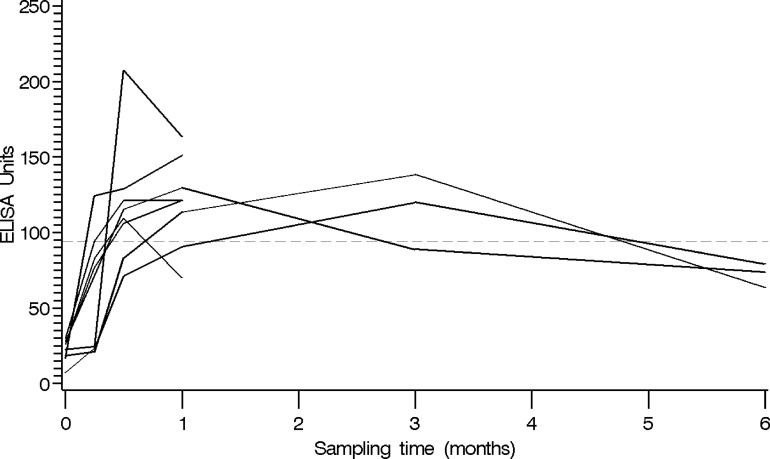
Only 8 (8%) of the 102 HCP ever had concentrations of ≥94 EU/ml, and fewer still (4% and 1%) reached the higher proposed cutoffs of 125 EU/ml and 200 EU/ml, respectively (Table 2). Of the eight subjects whose titers exceeded the ELISA positive cutoff, five discontinued enrollment after 4 weeks; however, the titers of three of these five subjects were stable or declining by their 4-week postvaccination blood draw (Fig. 3). The remaining three subjects who remained in the study had values below the proposed diagnostic cutoff of 94 EU/ml by 6 months postvaccination.
Table 2.
Numbers of positive specimens at various proposed cutoffs
| Sampling time | na | No. (%) of specimens positive at proposed cutoff of: |
||
|---|---|---|---|---|
| 94 EU/ml | 125 EU/ml | 200 EU/ml | ||
| Baseline | 102 | 0 (0) | 0 (0) | 0 (0) |
| 1 wk | 98 | 2 (2) | 0 (0) | 0 (0) |
| 2 wk | 96 | 6 (6.2) | 2 (2.1) | 1 (1) |
| 4 wk | 94 | 6 (6.4) | 3 (3.2) | 0 (0) |
| 3 mo | 57 | 2 (3.5) | 1 (1.8) | 0 (0) |
| 6 mo | 54 | 0 (0) | 0 (0) | 0 (0) |
| 9 mo | 47 | 0 (0) | 0 (0) | 0 (0) |
| 12 mo | 51 | 0 (0) | 0 (0) | 0 (0) |
| 18 mo | 43 | 0 (0) | 0 (0) | 0 (0) |
| 24 mo | 39 | 0 (0) | 0 (0) | 0 (0) |
Number of measurements available at each sampling time for the entire cohort. Note that for several subjects, specimens were not available for all sampling times between their prevaccination and last sampling times.
Fig 3.
Antibody level peak and decline patterns of the eight subjects who surpassed the 94-EU/ml cutoff (dashed line).
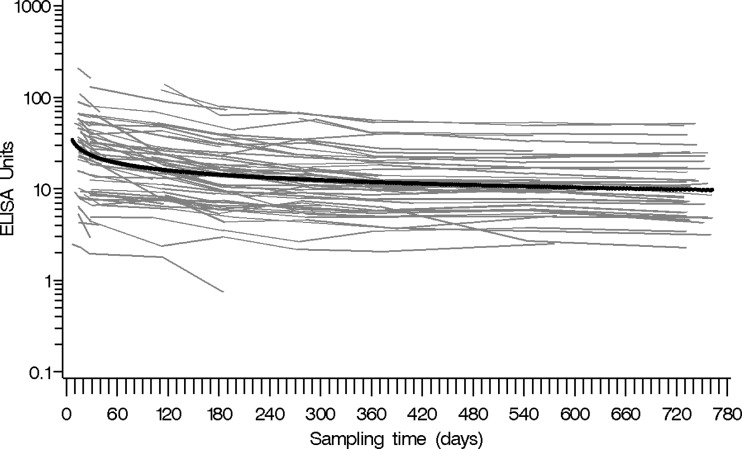
A longitudinal mixed-model analysis was employed to model the antibody profile of a larger population vaccinated with Tdap (Fig. 4). In our cohort of 102 HCP, the number of study subjects with available specimens dropped 39%, from 94 subjects at 4 weeks postvaccination to 57 subjects at 3 months postvaccination, with subsequent attrition during the rest of the study period. The longitudinal analysis assumed that any missing data were missing at random. Five of the 102 subjects were excluded because they had very little (<10%) or no antibody level increase after vaccination during the first 4 weeks after vaccination (n = 4) or had low antibody levels (<4 EU/ml) throughout the study (n = 1), leaving 97 subjects for further analysis (Fig. 1, 4). Accounting for both the exclusion of 5 subjects and modeling each of the 97 antibody profiles from the peak level, the number of measurements per subject ranged from 1 to 9 (median, 4), for a total of 407 measurements. The estimated population mean from the mixed model fell in the middle of the individual profiles, indicating a good fit to the data (Fig. 4).
Fig 4.
Time plot of antibody level versus time after vaccination (in days) for 97 subjects, beginning from the peak antibody level. The estimated population mean (thick line) from the mixed model is superimposed on the plot.
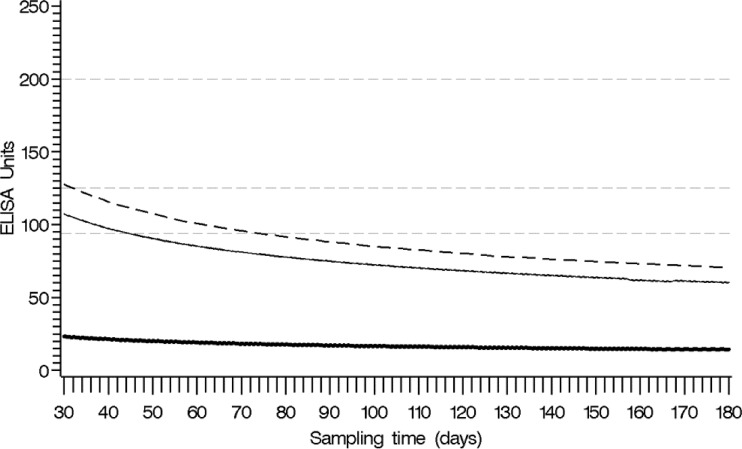
To determine the earliest time at which serodiagnosis can be used following Tdap vaccination, one-sided 95% upper prediction and tolerance limits at each time point for future specimens were used. The prediction limit for a single future specimen suggested that the antibody level would be <94 EU/ml by 45 days after vaccination (Fig. 5). The tolerance limit suggested that the predicted antibody level for at least 95% of the vaccinated population would be <94 EU/ml by 75 days after vaccination (Fig. 5).
Fig 5.
Plot of estimated population mean (thick line) after the peak antibody response, based on the mixed-model analysis for 97 subjects with the pointwise one-sided 95% upper prediction limit (solid line) and the pointwise one-sided 95% upper tolerance limit (dashed line). Reference lines for the proposed thresholds at 94 EU/ml, 125 EU/ml, and 200 EU/ml are superimposed on the plot (gray dashed lines).
DISCUSSION
In a population of Tdap-vaccinated HCP who demonstrated expected booster responses to vaccination within the first 3 months, only 8% had antibody levels high enough to interfere with the diagnostic interpretation of the anti-PT IgG ELISA. Based on the upper prediction limit estimated by our model, the use of serology for diagnostic purposes should be considered valid in patients who have not received Tdap vaccination in the prior 45 days. Using the upper tolerance limit (75 days), it appears that a slightly longer time frame would provide even more confidence regarding the use of serodiagnosis in a population that will now be getting routinely vaccinated.
An elevated anti-PT IgG titer is currently the most sensitive and specific indicator of recent pertussis infection (10, 27). Previous kinetic studies have shown that HCP vaccinated with acellular vaccines can have anti-PT IgG antibody concentrations as high as ∼331 EU/ml (22). In response, many countries have adopted specific waiting periods, up to a year, before suggesting the use of serodiagnosis in a vaccinated patient (10). However, study objectives, criteria, vaccine formulations, and ELISA methodology can be highly variable among previously published work, resulting in a wide range of observed decay rates and kinetic patterns (5, 7, 17, 22). Our modeling results suggest a waiting period of 3 months postvaccination in order to use our serodiagnostic ELISA.
While the GMCs were far below the diagnostic cutoff for a recent infection, the antibody levels of eight individuals still surpassed the diagnostic cutoff. A possible explanation is that these asymptomatic individuals had a stronger response because of previous or recent exposure, which could be likely since the cohort is composed of HCP. High antibody titers have been observed in previous population studies and may simply be a reflection of the normal variation observed in the population (2).
This study was an extension of a study which measured antibody levels 1, 2, and 4 weeks postvaccination using a different ELISA performed at another laboratory (15). Anti-PT IgG GMCs were much higher in that study than those seen here (112 EU/ml rather than 19.0 EU/ml and 109.5 EU/ml rather than 21.3 EU/ml for the 2- and 4-week postvaccination sampling times, respectively). Further inspection led us to examine if the PT antigen source alone or in combination with possible differences in ELISA methodology could have been a potential source of the differences in concentrations. Reanalysis of these sera by SP using a more highly purified antigen preparation produced values lower than those originally reported (personal communication with SP). These results led to a recently completed study to compare the effects of four sources of PT antigen preparations on four different ELISA methods. Results demonstrated that if the preparations are highly purified and well qualified and the ELISAs are calibrated to a reference standard and well validated, these different PT sources could be interchangeably used (13).
One important limitation of our study is that the data were derived from subjects who received only one Tdap formulation. Vaccine formulations can differ by antigen type, quantity, and purification or detoxification processes. This study used the Tdap formulation Adacel from SP (Lyon, France), which contains 2.5 μg of PT. Formulations that contain larger amounts of PT may elicit a stronger antibody response that could take longer to decay and thus delay the time frame for the applicability of serodiagnosis with the ELISA. Recent vaccine response studies with a formulation that contains a higher concentration of PT (8 μg) observed higher peak postvaccination GMCs (126.5, 90.3, and 62.7 EU/ml) (3, 20, 28); one observed a decay sampling at 1 year postvaccination with a GMC of 22.7 EU/ml (28). Based on the data of these studies and the well-recognized rapid decline in titers soon after the peak, we believe that a 6-month waiting period after vaccination is sufficient.
Another potential limitation is that the postvaccination titers of adolescents may be different from those of adults. The time between vaccinations for adolescents is much shorter than that for adults, and therefore there may be a stronger response to the booster. However, Rieber et al. observed post-Tdap booster GMCs of 16.4, 17.1, and 50.3 EU/ml 1 month after vaccination in adolescents with five-dose acellular, four-dose acellular, and four-dose whole-cell vaccine primary series, respectively (21). In addition, Mertsola et al. observed comparable antibody decay profiles from booster vaccinations of adolescents and adults (20). These findings suggest that our results with the diagnostic ELISA for adults may be similarly interpreted for adolescents.
The need for a serological diagnostic tool has been increasing substantially as the public health community seeks to understand the true burden of pertussis. The anti-PT IgG assay is an ideal complement to culture and PCR to determine infection in the later phases of disease and in adolescents and adults who do not display typical pertussis symptoms. The late nature of reporting is the primary reason that outbreak investigations are often retrospective and dependent on serological testing for confirmation. Given recent initiatives to improve Tdap vaccination in adolescents and adults, clarifying confounding interpretations of serological results is crucial.
In summary, our study predicts that the anti-PT IgG ELISA will remain useful for the measurement of PT antibody levels in Tdap-vaccinated patients beginning as early as 75 days postvaccination. Certainly by 6 months postvaccination, predicted antibody levels of vaccinated adult populations fell far below the diagnostic cutoff, making interference with serodiagnosis interpretation quite unlikely. For epidemiological studies and as part of a public health response, public health laboratories may use this ELISA for pertussis diagnostics regardless of vaccination history. Clinicians managing individual patients should maintain a more comprehensive approach to diagnosing pertussis in a recently vaccinated person, considering symptoms and the appropriateness of other diagnostic tools, but should feel confident using this serologic test if vaccination has occurred more than 6 months previously.
ACKNOWLEDGMENTS
We thank GlaxoSmithKline for kindly providing PT and the CBER for the lot 3 reference sera. We are also grateful to Terre Currie for her work with the recruitment and collection of specimens.
The findings and conclusions in this report are those of the author(s) of each section and do not necessarily represent the entire group of participants or the official position of the CDC/Agency for Toxic Substances and Disease Registry.
Footnotes
Published ahead of print 25 April 2012
REFERENCES
- 1. Amanna IJ, Carlson NE, Slifka MK. 2007. Duration of humoral immunity to common viral and vaccine antigens. N. Engl. J. Med. 357:1903–1915 [DOI] [PubMed] [Google Scholar]
- 2. Baughman AL, et al. 2004. Establishment of diagnostic cutoff points for levels of serum antibodies to pertussis toxin, filamentous hemagglutinin, and fimbriae in adolescents and adults in the United States. Clin. Diagn. Lab Immunol. 11:1045–1053 [DOI] [PMC free article] [PubMed] [Google Scholar]
- 3. Booy R, et al. 2010. A decennial booster dose of reduced antigen content diphtheria, tetanus, acellular pertussis vaccine (Boostrix) is immunogenic and well tolerated in adults. Vaccine 29:45–50 [DOI] [PubMed] [Google Scholar]
- 4. Broder KR, et al. 2006. Preventing tetanus, diphtheria, and pertussis among adolescents: use of tetanus toxoid, reduced diphtheria toxoid and acellular pertussis vaccines recommendations of the Advisory Committee on Immunization Practices (ACIP). MMWR Recommend. Rep. 55(RR-3):1–34 [PubMed] [Google Scholar]
- 5. Dalby T, Petersen JW, Harboe ZB, Krogfelt KA. 2010. Antibody responses to pertussis toxin display different kinetics after clinical Bordetella pertussis infection than after vaccination with an acellular pertussis vaccine. J. Med. Microbiol. 59:1029–1036 [DOI] [PubMed] [Google Scholar]
- 6. de Melker HE, et al. 2000. Specificity and sensitivity of high levels of immunoglobulin G antibodies against pertussis toxin in a single serum sample for diagnosis of infection with Bordetella pertussis. J. Clin. Microbiol. 38:800–806 [DOI] [PMC free article] [PubMed] [Google Scholar]
- 7. Edelman K, et al. 2007. Immunity to pertussis 5 years after booster immunization during adolescence. Clin. Infect. Dis. 44:1271–1277 [DOI] [PubMed] [Google Scholar]
- 8. Efron B, Tibshirani RJ. 1998. An introduction to the bootstrap. Chapman & Hall/CRC, New York, NY [Google Scholar]
- 9. Fraser C, et al. 2007. Modeling the long-term antibody response of a human papillomavirus (HPV) virus-like particle (VLP) type 16 prophylactic vaccine. Vaccine 25:4324–4333 [DOI] [PubMed] [Google Scholar]
- 10. Guiso N, et al. 2011. What to do and what not to do in serological diagnosis of pertussis: recommendations from EU reference laboratories. Eur. J. Clin. Microbiol. Infect. Dis. 30:307–312 [DOI] [PMC free article] [PubMed] [Google Scholar]
- 11. Hahn G, Meeker WQ. 1991. Statistical intervals: a guide for practitioners. John Wiley & Sons, Inc., New York, NY [Google Scholar]
- 12. Hornung RW, Reed LD. 1990. Estimation of average concentration in the presence of nondetectable values. Appl. Occup. Environ. Hyg. 5:46–51 [Google Scholar]
- 13. Kapasi A, et al. 2012. Comparative study of different sources of pertussis toxin (PT) as coating antigens in IgG anti-PT enzyme-linked immunosorbent assays. Clin. Vaccine Immunol. 19:64–72 [DOI] [PMC free article] [PubMed] [Google Scholar]
- 14. Katki HA, Engels EA, Rosenberg PS. 2005. Assessing uncertainty in reference intervals via tolerance intervals: application to a mixed model describing HIV infection. Stat. Med. 24:3185–3198 [DOI] [PubMed] [Google Scholar]
- 15. Kirkland KB, Talbot EA, Decker MD, Edwards KM. 2009. Kinetics of pertussis immune responses to tetanus-diphtheria-acellular pertussis vaccine in health care personnel: implications for outbreak control. Clin. Infect. Dis. 49:584–587 [DOI] [PubMed] [Google Scholar]
- 16. Kretsinger K, et al. 2006. Preventing tetanus, diphtheria, and pertussis among adults: use of tetanus toxoid, reduced diphtheria toxoid and acellular pertussis vaccine recommendations of the Advisory Committee on Immunization Practices (ACIP) and recommendation of ACIP, supported by the Healthcare Infection Control Practices Advisory Committee (HICPAC), for use of Tdap among health-care personnel. MMWR Recommend. Rep. 55(RR-17):1–37 [PubMed] [Google Scholar]
- 17. Le T, et al. 2004. Immune responses and antibody decay after immunization of adolescents and adults with an acellular pertussis vaccine: the APERT study. J. Infect. Dis. 190:535–544 [DOI] [PubMed] [Google Scholar]
- 18. Marchant CD, et al. 1994. Pertussis in Massachusetts, 1981-1991: incidence, serologic diagnosis, and vaccine effectiveness. J. Infect. Dis. 169:1297–1305 [DOI] [PubMed] [Google Scholar]
- 19. Menzies SL, et al. 2009. Development and analytical validation of an immunoassay for quantifying serum anti-pertussis toxin antibodies resulting from Bordetella pertussis infection. Clin. Vaccine Immunol. 16:1781–1788 [DOI] [PMC free article] [PubMed] [Google Scholar]
- 20. Mertsola J, et al. 2010. Decennial administration of a reduced antigen content diphtheria and tetanus toxoids and acellular pertussis vaccine in young adults. Clin. Infect. Dis. 51:656–662 [DOI] [PubMed] [Google Scholar]
- 21. Rieber N, et al. 2008. Differences of humoral and cellular immune response to an acellular pertussis booster in adolescents with a whole cell or acellular primary vaccination. Vaccine 26:6929–6935 [DOI] [PubMed] [Google Scholar]
- 22. Riffelmann M, Littmann M, Hulsse C, von Konig CH. 2009. Antibody decay after immunisation of health-care workers with an acellular pertussis vaccine. Eur. J. Clin. Microbiol. Infect. Dis. 28:275–279 [DOI] [PubMed] [Google Scholar]
- 23. Riffelmann M, Thiel K, Schmetz J, Wirsing von Koenig CH. 2010. Performance of commercial enzyme-linked immunosorbent assays for detection of antibodies to Bordetella pertussis. J. Clin. Microbiol. 48:4459–4463 [DOI] [PMC free article] [PubMed] [Google Scholar]
- 24.SAS Institute, Inc 2009. The mixed procedure. SAS/STAT 9.2 user's guide, second ed. SAS Institute, Inc, Cary, NC [Google Scholar]
- 25.SAS Institute, Inc 2010. The NLP procedure. SAS/OR 9.22 user's guide: mathematical programming. SAS Institute, Inc., Cary, NC [Google Scholar]
- 26. Tondella ML, et al. 2009. International Bordetella pertussis assay standardization and harmonization meeting report. Centers for Disease Control and Prevention, Atlanta, Georgia, United States, 19-20 July 2007. Vaccine 27:803–814 [DOI] [PMC free article] [PubMed] [Google Scholar]
- 27. Watanabe M, Connelly B, Weiss AA. 2006. Characterization of serological responses to pertussis. Clin. Vaccine Immunol. 13:341–348 [DOI] [PMC free article] [PubMed] [Google Scholar]
- 28. Weston W, Messier M, Friedland LR, Wu X, Howe B. 2011. Persistence of antibodies 3 years after booster vaccination of adults with combined acellular pertussis, diphtheria and tetanus toxoids vaccine. Vaccine 29:8483–8486 [DOI] [PubMed] [Google Scholar]
- 29. Xing D, et al. 2009. Characterization of reference materials for human antiserum to pertussis antigens by an international collaborative study. Clin. Vaccine Immunol. 16:303–311 [DOI] [PMC free article] [PubMed] [Google Scholar]


