

Abstract
Lactobacillus equigenerosi strain Le1, a natural inhabitant of the equine gastrointestinal tract, survived pH 3.0 and incubation in the presence of 1.5% (wt/vol) bile salts for at least 2 h. Strain Le1 showed 8% cell surface hydrophobicity, 60% auto-aggregation, and 47% coaggregation with Clostridium difficile C6. Only 1% of the cells adhered to viable buccal epithelial cells and invaded the cells within 20 min after contact. Preincubation of strain Le1 in a buffer containing pronase prevented adhesion to viable epithelial cells. Preincubation in a pepsin buffer delayed invasion from 20 min to 1 h. Strain Le1 did not adhere to nonviable epithelial cells. Administration of L. equigenerosi Le1 (1 × 10⁹ CFU per 50 kg body weight) to healthy horses did not increase white blood cell numbers. Differential white blood cell counts and aspartate aminotransferase levels remained constant. Glucose, lactate, cholesterol, and urea levels remained constant during administration with L. equigenerosi Le1 but decreased during the week after administration.
INTRODUCTION
Horses are hindgut fermenters; i.e., most of the microbial activity takes place in the cecum and colon (13). Production of large quantities of saliva (10 to 12 liters per day) helps to transport the feed through a 1.2- to 1.5-m-long esophagus and buffers the digesta (13). Transition of digesta through the stomach is relatively rapid, although a large portion remains for 2 to 6 h in the anaerobic fundic (lower) section of the stomach. Digesta reaches the cecum and colon approximately 3 h after feeding (13). The pH of the cecum and colon is approximately 6.0 and forms the ideal condition for lactic acid bacteria, anaerobic bacteria, fungi, and protozoa to degrade residual starch, hemicelluloses, and pectins (4, 17). Survival at low pH, tolerance to bile salts, and adherence to epithelial cells and mucus are considered important characteristics for any strain to survive the gastrointestinal tract (GIT) (8, 14).
The equine gut is host to only a selected few species of lactic acid bacteria, e.g., Lactobacillus equigenerosi, Lactobacillus buchneri, Lactobacillus hayakitensis, Lactobacillus kitasatonis, Lactobacillus delbrueckii, Lactobacillus equi, Lactobacillus johnsonii, Lactobacillus mucosae, Lactobacillus reuteri, Lactobacillus salivarius, Enterococcus faecalis, and Enterococcus faecium. Of these species, L. equigenerosi, L. equi, and L. hayakitensis have not been isolated from other niches and are considered host specific (11, 23). Several Clostridium spp. have been isolated from horses. Although naturally present, toxins produced by clostridia, especially Clostridium difficile, may lead to death (2, 3, 16, 20, 21).
Little is known about the survival of lactic acid bacteria in the equine gastrointestinal tract (GIT) and its effect on the host. This study sheds some light on the survival of L. equigenerosi at different pHs and in the presence of bile salts and on the ability of the cells to aggregate, auto-aggregate, and coaggregate with C. difficile. The adhesion of L. equigenerosi Le1 to equine epitehelial cells was studied to determine if the two cell types have a unique association. We also report on changes in blood cell numbers, aspartate aminotransferase, glucose, lactate, cholesterol, and urea of horses that have been administered L. equigenerosi Le1.
MATERIALS AND METHODS
Isolation and identification of bacteria.
Feces collected from healthy horses, receiving no probiotic treatment, were inoculated (10%, wt/vol) into De Man Rogosa (MRS) broth (Biolab, Biolab Diagnostics, Midrand, South Africa) and incubated at 37°C for 24 h. From this, plates with MRS agar (Biolab) were streaked and incubated at 37°C for 48 to 72 h in anaerobic flasks with gas-generating envelopes (Anaerobic system BR0038B; Oxoid Ltd., Basingstoke, Hants, United Kingdom). Smooth cream-colored colonies of approximately 1 to 2 mm in diameter were selected. Colonies with oval-shaped morphology, typical of that described for L. equigenerosi (11), were restreaked to obtain pure cultures. The selected isolates were tested for growth in MRS broth adjusted to pH 4.0 and pH 3.5 and in MRS broth supplemented with 2.5% and 5.0% (wt/vol) NaCl. Species identity was confirmed by 16S rRNA gene sequencing, using primers 8F and 1512R (Table 1). DNA was isolated according to the method of Endo and Okada (10). This isolate that corresponds to the description of L. equigenerosi was selected for further studies.
Table 1.
DNA primers used in this study
Samples of gut contents collected from a diseased horse, diagnosed with clinical signs of colic, were streaked onto Clostridium difficile agar base CM0601, supplemented with the selective reagent SR0096 (Oxoid Ltd., Cambridge, England). The plates were incubated in anaerobic flasks at 37°C for 6 days. Gray-white colonies, resembling the morphology of Clostridium difficile, were selected, Gram stained, and tested for catalase activity by dropping 5% (vol/vol) H2O2 onto the colonies.
Tolerance to pH and bile salts.
Strain Le1, confirmed as being L. equigenerosi, was cultured in MRS broth for 18 h at 37°C and then inoculated (100 μl) into 10 ml MRS broth preadjusted with dl-lactic acid to pH 2.0, 2.6, 3.0, 4.0, 5.0, and 5.4. The pH of the medium was determined after autoclaving and readjusted if necessary. In another experiment, the strain was inoculated (100 μl) into 10 ml MRS broth, supplemented with 0.5%, 1.0%, and 1.5% (wt/vol) Oxbile (Oxoid). Incubation was for 2 h at 37°C, followed by serial dilution in sterile saline and plating onto MRS agar. Bile salt hydrolase (BSH) activity was determined by streaking strain Le1 onto MRS agar supplemented with 0.37 g CaCl2 and 0.5% (wt/vol) taurodeoxycholic acid (Sigma, St. Louis, MO). Plates were incubated at 37°C for 24 h, and BSH activity was recorded as positive if a precipitate formed around the colonies. Incubation was always anaerobic in anaerobic flasks with gas-generating envelopes (Oxoid).
Cell surface hydrophobicity, auto-aggregation, and coaggregation.
Hydrophobicity, auto-aggregation, and coaggregation were determined according to the methods described by Botes et al. (5). L. equigenerosi Le1 was grown anaerobically in MRS broth for 18 h at 37°C, and the cells were harvested (10,000 × g, 10 min, 4°C) and washed twice with quarter-strength Ringer's solution (1.5 g NaCl, 0.02 g KCl, 0.03 g CaCl2, and 0.03 g NaHCO3). The optical density (OD) of the cell suspension was recorded at 580 nm (reading 1). To the cell suspension an equal volume of n-hexadecane was added and mixed for 2 min, and the mixture was left at 26°C for 30 min to separate into two phases. One milliliter of the top phase was carefully extracted, and the OD was recorded at 580 nm (reading 2). The level of hydrophobicity was expressed as a percentage value, calculated by using the equation of Doyle and Rosenberg (9):
Auto-aggregation of L. equigenerosi Le1 was determined by washing the cells, as described before, and resuspending them in sterile saline (0.8%, wt/vol, NaCl). The cell density was adjusted to 0.3 (measured at 660 nm). One milliliter of the cell suspension was transferred to a sterile 2-ml plastic cuvette and centrifuged for 2 min at 2,000 × g. The cell density in the supernatant was recorded immediately after centrifugation (OD6600) and 60 min later (OD66060). The percentage of cells that aggregated was calculated using the equation of Malik et al. (22):
Coaggregation of L. equigenerosi Le1 and C. difficile C6 was determined as follows. Strain Le1 was cultured anaerobically in MRS broth for 18 h at 37°C and strain C6 anaerobically in DRCM broth (Biolab) for 24 to 48 h at 37°C. Cells were harvested (10,000 × g, 10 min, 18°C) and washed with sterile saline (0.8%, wt/vol, NaCl). The cells were resuspended in sterile saline, and the cell density (OD660) of each was adjusted to 0.3. Equal volumes of the two cell suspensions were mixed and allowed to stand for 20 min at 25°C. The cell density of the combined cell suspension was recorded (OD660Tot) to represent the initial OD. Cells were then harvested (2,000 × g, 2 min, 18°C) to determine the OD of the nonaggregated cells in the supernatant (OD660S). The percentage coaggregation was calculated using the equation of Malik et al. (22):
To determine how many cells of L. equigenerosi Le1 coaggregated with C. difficile C6, the number of viable cells in the pellet was determined. The pellet was resuspended in sterile saline, serially diluted, and then plated onto MRS agar and DRCM (Biolab) agar, respectively. Incubation was at 37°C (24 h for MRS plates and 48 to 72 h for DRCM plates).
Adhesion to epithelial cells.
Fresh buccal (cheek) epithelial cells were collected from healthy horses. The swabs were immediately suspended in minimal essential medium (MEM) Earle's base (Highveld Biological Pty. Ltd., Kelvin, Johannesburg, South Africa). A sterile eight-chamber slide (Nalge Nunc International, Rochester, NY) was seeded with 200 μl epithelium cells per well. L. equigenerosi Le1 was cultured in MRS broth for 18 h at 37°C. The cells were harvested (10,000 × g, 5 min, 18°C), washed in sterile distilled water, and resuspended in 1 ml sterile phosphate-buffered saline (PBS) to 1 × 10⁴ CFU ml−1 (OD600 = 1.5). From this suspension 150 μl (1.5 × 10³ CFU) was added to each of the wells with epithelial cells and the plates were incubated for 2 h at 37°C. Bacterial cells that did not adhere to the epithelial cells were withdrawn, serially diluted in sterile saline, plated onto MRS agar, and incubated anaerobically at 37°C for 24 h. Adherence of the bacteria to epithelial cells was expressed as a percentage value, calculated by using the equation
CFU ml−10 refers to the initial number of bacteria and CFU ml−1120 to the number of bacteria that adhered to the epithelial cells after 2 h.
In another experiment, the bacterial cells were stained to differentiate viable from dead cells. To 1 ml washed cell suspension (1 × 10⁴ CFU), 1.5 μl SYTO 9 (3.34 mM stock solution), and 1.5 μl propidium iodide (20 mM stock solution) from the LIVE/DEAD BacLight bacterial viability kit, L34856 (Leiden, The Netherlands), were added, and the suspensions were incubated for 15 min at 25°C. The epithelium-seeded wells, containing either viable or dead buccal epithelial cells, were each inoculated with 150 μl (1.5 × 10³ CFU) of the bacterial suspension. Images of the bacteria and epithelial cells were recorded using an Olympus cell^R system, attached to an IX-81 inverted fluorescence microscope equipped with an F-view-II cooled charge-coupled-device (CCD) camera (Soft Imaging Systems). Cells were excited by exposure to 472 nm and 572 nm using a Xenon-Arc burner (Olympus Biosystems GMBH). Emission was collected using a UBG triple-bandpass emission filter cube. For the z-stack image frame acquisition, an Olympus UPlan Apo N 100× oil objective and the cell^R imaging software were used. Images were processed and background subtracted using the cell^R software. Three-dimensional images were obtained using the cell^R software with a step width of 0.26 μm represented in fence view and either a 60× (Olympus PlanApo) or a 100× (UPlanApo N) oil immersion objective. Specific conditions were maintained for z-stack analysis. Parameters for image acquisition were defined and maintained for all experiments. Z-stacks were processed and displayed in the slice view mode, using the cell^R software. For the time lapse series, images were acquired over 20 min with a cycle time of 5 s.
The adhesion experiment was repeated but with cells of L. equigenerosi Le1 that had been pretreated with pronase and pepsin, respectively. Cells were grown in MRS broth to 1 × 10⁴ CFU ml−1, harvested, washed, and resuspended in PBS as described before. One milliliter of the cell suspension was resuspended in either 500 μl pronase or 500 μl pepsin (Roche Diagnostics GmbH, Mannheim, Germany) and incubated for 2 h at 37°C. The pronase and pepsin solutions were prepared by suspending 5.0 mg of each in 1 ml sterile PBS. The cells were then harvested (14,000 × g, 10 min, 4°C), washed using 2 volumes of 0.8 ml sterile PBS to remove residual enzymes, and resuspended in 1 ml sterile PBS. The cells were stained with BacLight as described before, and adhesion to epithelial cells was studied under the fluorescence microscope. Images were taken immediately after adding strain Le1 to the epithelial cells and 20 min, 1 h, and 2 h later.
Competition with Clostridium difficile for adherence to viable epithelial cells.
To determine if L. equigenerosi Le1 has the ability to compete with C. difficile C6 for adherence to viable epithelial cells, the adhesion experiment was repeated but with a mixed bacterial cell suspension. Epithelium-seeded wells were inoculated with a combination of 100 μl (approximately 1 × 10³) of strains Le1 and C6, respectively. After 2 h of incubation, bacterial cells that did not adhere to the epithelial cells were withdrawn and plated onto MRS and DRCM agar. The percentage of adhesion to the epithelial cells was determined as described before. The experiment was repeated with cells that had been stained with BacLight, and adhesion to epithelial cells was studied as described before. Images were taken after 20 min, 1 h, and 2 h of contact between the bacteria and the epithelial cells.
Administration of Lactobacillus equigenerosi Le1 to horses.
Four healthy crossbreed horses, stabled at the Welgevallen experimental farm of the University of Stellenbosch, were included in this study. Permission to perform the research was granted by the Ethical Committee (ethical clearance number 2009B03002). The horses were stabled separately in 9-m2 quarters and were fed high-quality alfalfa, hay, and a commercial energy-rich feed supplement twice a day. The horses were dewormed 4 weeks before the onset of the experiment.
L. equigenerosi Le1 was cultured in 10% (wt/vol) sterile molasses at 37°C for 48 h. Viable cell numbers were determined by plating onto MRS agar, and the dosage was calculated based on 1 × 10⁹ CFU per 50 kg body weight. Each horse received 20 ml of a cell suspension early morning and another 20 ml 10 h later. The experiment was conducted over 24 days, consisting of a first 7-day period before dosing the horses with strain Le1, a second 10-day period during dosage, and a third 7-day postadministration period.
Screening of feces for the presence of Lactobacillus equigenerosi Le1.
Fecal samples were collected from the horses on each of the 24 days of the trial. Serial dilutions of the samples were prepared in sterile saline and plated onto MRS agar and modified MRS agar, i.e., MRS agar adjusted to pH 4.0 and supplemented with 2.5% (wt/vol) NaCl. Microbial DNA was isolated from fecal samples collected on days 6, 4, and 1 before administering strain Le1 to the horses, on days 2, 4, and 7 during the dosage period, and every second day for 1 week following the last dosage. The ZR fungal/bacterial DNA kit (Zymo Research, CA) was used. DNA was amplified using primers Lac1, Lac2GC, and Lac3 (Table 1). PCR conditions were as described by Walter et al. (36). PCR products were analyzed with denaturing gradient gel electrophoresis (DGGE), using a DCode system (Bio-Rad Laboratories, Hercules, CA). The denaturing gradient of the 8% (wt/vol) polyacrylamide gels (acrylamide/bisacrylamide ratio, 37.5:1) ranged from 35% to 50%. In this case a 100% denaturant represents 40% formamide and 7 M urea. Electrophoresis was performed at 70 V for 16 h in a Tris-acetate-EDTA buffer. Immediately after electrophoresis, the gels were stained with SYBR green I nucleic acid gel stain (BioWhittaker Molecular Applications, Rockland, ME) for approximately 30 min. Clearly visible bands on the DGGE gels were excised with sterile toothpicks, and the DNA fractions were amplified by using the same primer sets and conditions used to amplify DNA for DGGE.
Blood analyses.
Three Vacutainers of whole blood were drawn from the jugular vein of each of the horses every third day of the trial, starting 1 week before dosage with L. equigenerosi Le1. The first was anti-coagulated with EDTA and kept at room temperature until analysis (within 4 h) for full and differential white blood cell (WBC) counts, using the Celldyne 3700CS hematology analyzer with the veterinary software package. The second sample was collected in serum separating tubes (SST) and kept on ice until centrifugation, after which serum was separated and stored at −80°C. Stored serum was used to determine aspartate aminotransferase (AST), glucose, cholesterol, lactate, and urea levels. The third sample, collected in sodium fluoride, was kept on ice until analysis for glucose and lactate levels using standard automated pathology laboratory procedures. Blood chemistry tests were conducted by Pathcare (Pty) Ltd. (Stellenbosch, Western Cape, South Africa). Statistical analysis was performed on the blood data by using two-way analysis of variance (ANOVA). Variability between groups was noted when P was ≤0.05 and the F-value was more than the F-crit value.
RESULTS
Identification of bacteria.
A total of 120 colonies were selected from MRS agar plates that were incubated anaerobically at 37°C. From these colonies, 10 were smooth and cream-colored and had an oval-shaped morphology. An isolate selected from one of these colonies grew in MRS broth adjusted to pH 4.0, but not in broth at pH 3.5, and in MRS broth supplemented with 2.5% (wt/vol) NaCl, but not in the same medium supplemented with 5.0% (wt/vol) NaCl. This isolate, designated Le1, corresponded to the description of L. equigenerosi and was selected for further studies. The 16S rRNA gene sequence shared 100% homology with its closest relative (GenBank accession no. AB425935, deposited as L. equigenerosi). Gray-white colonies isolated from Clostridium difficile agar base supplemented with the selective reagent SR0096 were Gram positive and catalase negative.
Resistance to pH and bile salts.
L. equigenerosi Le1 cell numbers of 1 × 10⁸ CFU ml−1 were recorded in MRS broth at pH 6.4. No significant changes in cell numbers were recorded after 2 h of incubation in MRS broth adjusted to pH 5.4 or pH 5.0. However, after 2 h at pH 4.0 the cell numbers decreased to 7 × 10⁶ CFU ml−1. At pH 3.0 numbers decreased to 5 × 10⁶ CFU ml−1. No viable cells were recorded after 2 h of incubation in medium adjusted to pH 2.0 or pH 2.6. Cell numbers decreased from 1 × 10⁸ CFU ml−1 in MRS broth without bile salts to 5 × 10⁶ CFU ml−1 after 2 h in the same medium supplemented with either 0.5%, 1.0%, or 1.5% (wt/vol) bile salts. No BSH activity was recorded.
Cell surface hydrophobicity, auto-aggregation, and coaggregation.
L. equigenerosi Le1 displayed 8% hydrophobicity and an auto-aggregation level of 60%. Forty-seven percent of the Le1 cells coaggregated with C. difficile C6.
Adhesion to epithelial cells.
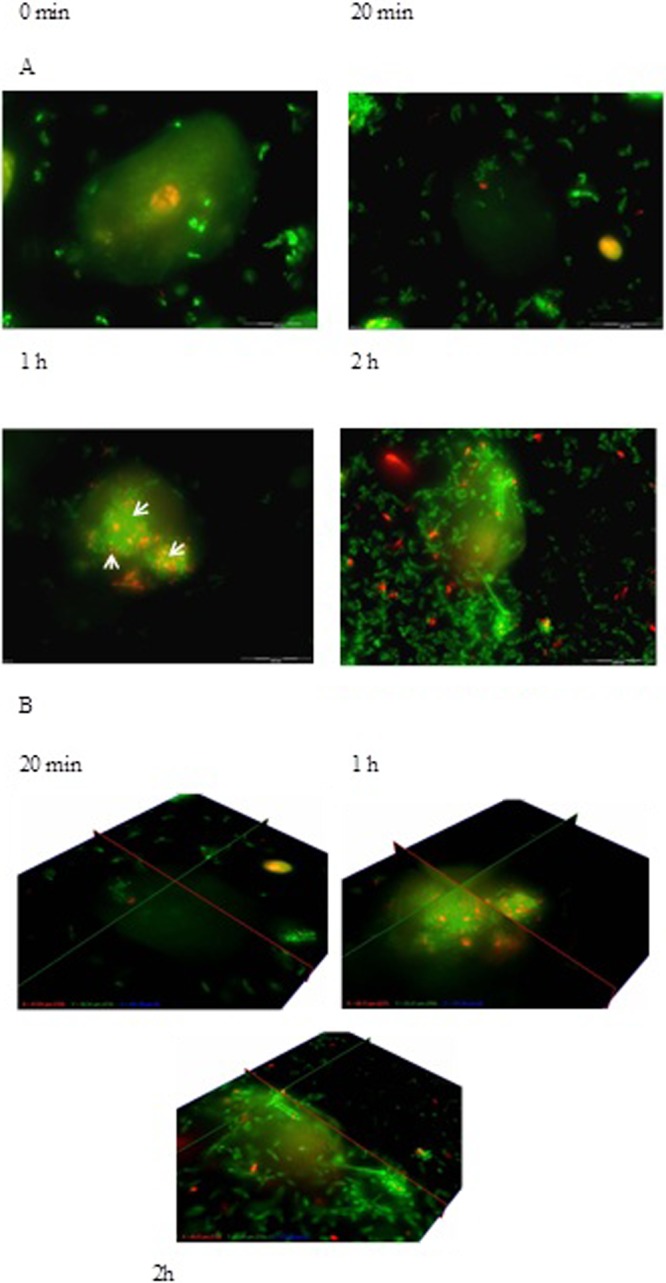
Only 1% of L. equigenerosi Le1 cells adhered to viable epithelial cells, as determined from growth on MRS agar plates. Visual images of adhesion of L. equigenerosi Le1 to viable and nonviable buccal epithelial cells, as distinguished by propidium iodide-positive nuclei, are shown in Fig. 1. Cells of L. equigenerosi Le1 clearly adhered to viable epithelial cells (Fig. 1A) and invaded the cells within 20 min (Fig. 1B and E). No bacterial cells adhered to (Fig. 1C) or entered (Fig. 1D and F) nonviable epithelial cells. Bacterial cells pretreated with pronase did not adhere to or invade epithelial cells (Fig. 2), as indicated by the lack of bacterial aggregates at the cell membrane or within its cytoplasm. However, bacteria pretreated with pepsin adhered to and invaded viable epithelial cells after 1 h of incubation and remained in the cells for at least another hour (Fig. 3). In the presence of Clostridium difficile C6, 3% of L. equigenerosi Le1 cells adhered to viable epithelial cells, as determined from growth on MRS agar plates. Competition between the cells for adherence to the epithelial cells was clearly visible in the fluorescent images (Fig. 4).
Fig 1.

Adhesion of L. equigenerosi Le1 to viable buccal epithelial cells (indicated by arrows), as observed with z-stack immediately after addition of the bacteria (A) and 20 min later (B). Adhesion to nonviable buccal epithelial cells is shown immediately after addition of the bacteria (C) and 20 min later (D). (E and F) Fence view images taken 20 min after strain Le1 had been in contact with viable and nonviable buccal epithelial cells, respectively. Nuclei of viable cells stained green with BacLight, and nuclei of nonviable cells stained orange or red.
Fig 2.

Adhesion of L. equigenerosi Le1, pretreated with pronase, to buccal epithelium cells. (A) Z-stack images were taken immediately after addition of the bacteria and 20 min, 1 h, and 2 h later. (B) Fence view images were taken after 20 min, 1 h, and 2 h. Nuclei of viable cells stained green with BacLight, and nuclei of nonviable cells stained orange or red.
Fig 3.
Adhesion of L. equigenerosi Le1, pretreated with pepsin, to buccal epithelium cells immediately after addition of the bacteria and 20 min, 1 h, and 2 h later. Z-stack (A) and fence view (B) images taken after 20 min, 1 h, and 2 h. Nuclei of viable cells stained green with BacLight, and nuclei of nonviable cells stained orange or red.
Fig 4.

Adhesion of L. equigenerosi Le1 to viable buccal epithelial cells in the presence of Clostridium sp. C6 after 20 min, 1 h, and 2 h. (A) Z-view. (B) Fence view. Nuclei of viable cells stained green with BacLight, and nuclei of nonviable cells stained orange or red.
Presence of L. equigenerosi Le1 in the intestine.
The number of total lactic acid bacteria, recorded from growth on MRS agar, remained between 107 and 108 CFU g−1 feces, irrespective of the sampling point during the trial. However, only 20% of the colonies grew on modified MRS agar. Results obtained with DGGE confirmed the presence of L. equigenerosi in all four horses before they were administered strain Le1 and during the 10-day dosage period but not in the week after dosage (Fig. 5).
Fig 5.
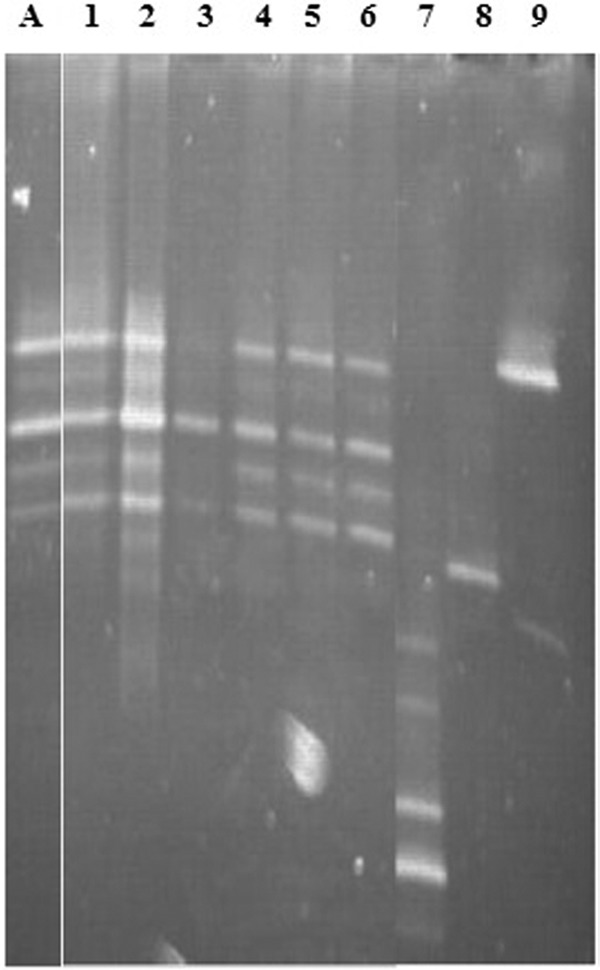
Composite gel, showing the DNA banding patterns of L. equigenerosi Le1 in feces, as recorded with DGGE. Lane A, L. equigenerosi Le1; lanes 1 to 3, 6 days, 4 days, and 1 day, respectively, before administration of strain Le1; lanes 4 to 7, days 2, 4, and 7 during administration of strain Le1; lanes 7 to 9, days 12, 14, and 16 after administration of strain Le1.
Blood analyses.
Results of blood analyses are shown in Table 2. The white blood cell, neutrophil, lymphocyte, monocyte, eosinophil, and basophil counts remained more or less constant (P > 0.05) throughout the trial. A statistically significant (P ≤ 0.05) decrease in levels of red blood cell (RBC) counts, hemoglobin, and hematocrit was recorded for 7 days immediately after treatment compared to average values prior and during treatment. The average platelet count decreased nonsignificantly from 2.0 × 10¹¹ liter−1 before and during administration of strain Le1 to 1.8 × 10¹¹ liter−1 after administration, i.e., during the last 7 days of the trial. The aspartate aminotransferase levels remained between 291 and 283 U liter−1, thus without significant variation. Cholesterol levels remained constant before and during administration with L. equigenerosi Le1 but decreased significantly (P ≤ 0.05) from 2.3 mmol liter−1 to 2.2 mmol liter−1 during the 7-day postadministration period. Glucose levels decreased significantly (P ≤ 0.05) from 5.5 mmol liter−1 before and during administration to 4.6 mmol liter−1 in the week postadministration. Lactate levels remained more or less constant before and during administration (between 0.8 and 0.9 mmol liter−1) but decreased (P ≤ 0.05) to 0.7 mmol liter−1 during the week postadministration. Urea levels decreased from 5.3 mmol liter−1 before administration to 4.6 mmol liter−1 during administration and 4.3 mmol liter−1 in the week postadministration.
Table 2.
Blood analysis profile of horses before, during, and after administration with L. equigenerosi Le1
| Cell typea | Number or percentage of cellsb |
||
|---|---|---|---|
| B | D | A | |
| WBC | 7.6 × 10⁹ liter−1 | 7.5 × 10⁹ liter−1 | 7.3 × 10⁹ liter−1 |
| NEU | 3.3 × 10⁹ liter−1 | 3.6 × 10⁹ liter−1 | 3.4 × 10⁹ liter−1 |
| LYM | 3.3 × 10⁹ liter−1 | 3.1 × 10⁹ liter−1 | 2.8 × 10⁹ liter−1 |
| MONO | 3.7 × 10⁸ liter−1 | 3.6 × 10⁸ liter−1 | 3.4 × 10⁸ liter−1 |
| EOS | 1.3 × 10⁸ liter−1 | 1.1 × 10⁸ liter−1 | 1.2 × 10⁸ liter−1 |
| BASO | 1.5 × 10⁸ liter−1 | 1.4 × 10⁸ liter−1 | 1.6 × 10⁸ liter−1 |
| RBC | 7.7 × 10¹² liter−1 | 7.7 × 10¹² liter−1 | 7.1 × 10¹² liter−1 |
| HGB | 13.5 g dl−1 | 13.5 g dl−1 | 12.4 g dl−1 |
| HCT | 64.9% | 64.9% | 60.5% |
| PLT | 2.0 × 10¹¹ liter−1 | 2.0 × 10¹¹ liter−1 | 1.8 × 10¹¹ liter−1 |
| AST | 291 U liter−1 | 291 U liter−1 | 283 U liter−1 |
| Cholesterol | 2.3 mmol liter−1 | 2.3 mmol liter−1 | 2.2 mmol liter−1 |
| Glucose | 5.5 mmol liter−1 | 5.5 mmol liter−1 | 4.6 mmol liter−1 |
| Lactate | 0.8 mmol liter−1 | 0.9 mmol liter−1 | 0.7 mmol liter−1 |
| Urea | 5.3 mmol liter−1 | 4.6 mmol liter−1 | 4.3 mmol liter−1 |
WBC, white blood cells; NEU, neutrophils; LYM, lymphocytes; MONO, monocytes; EOS, eosinophils; BASO, basophils; RBC, red blood cells; HGB, hemoglobin; HCT, hematocrit; PLT, platelets; AST, aspartate aminotransferase.
B, D, and A refer to before, during, and after administration of L. equigenerosi Le1. Values are averaged from three repeats.
DISCUSSION
The pH within the equine stomach varies between 2.6 and 5.4 (25). Digesta rapidly passes onto the rest of the GIT, but a portion remains in the stomach for 2 to 6 h (13). During fermentation of carbohydrates, lactic acid is produced, which lowers the intestinal pH to 2.6 (13). Only 5% of L. equigenerosi Le1 survived pH 3.0 after 2 h, as shown by a decrease in cell numbers from 1 × 10⁸ CFU ml−1 to 5 × 10⁶ CFU ml−1. Survival in MRS broth at pH 4.0 was slightly better (7%), as shown by a decrease from 1 × 10⁸ CFU ml−1 to 7 × 10⁶ CFU ml−1. These results conform to the description of the species, i.e., growth at pH 4.0 but no growth at pH 3.5 (11). L. equigenerosi Le1 did not survive 2 h in MRS broth adjusted to pH 2.0 and 2.6, suggesting that the cells would be killed in the stomach. However, strain Le1 was originally isolated from feces, suggesting that it did survive conditions in the GIT. A complex environment such as digesta may provide some protection to the cells. The duodenum is less acidic and approximately pH 3.7, depending on the diet (25). However, secretion of bile in the duodenum may repress bacterial growth. Strain Le1 survived bile salt concentrations of 1.5% (wt/vol) for 2 h in vitro and may survive passage through the small intestine. No BSH activity was recorded for strain Le1, suggesting that tolerance to bile salts has to be attributed to other factors.
The 8% hydrophobicity recorded for strain Le1 compares with the 13% published for L. casei Shirota, but it is far below the 54% recorded for L. rhamnosus GG, 50% for L. plantarum 423, 45% for L. casei MB1, and 28% for L. johnsonii La1 (5). Cell surface hydrophobicity is thought to play an important role in adherence between lactic acid bacteria and to epithelial cells or mucus (32). Lactobacillus strains with high cell surface hydrophobicity adhered in high numbers to porcine enterocytes (32). However, in other studies (5, 24, 32) no correlation was found between cell surface hydrophobicity and adhesion to mucus or epithelial cells. These discrepancies may be ascribed to differences in methods used or to the influence of unknown physiological factors.
Auto-aggregation plays an important role in biofilm formation (6). The auto-aggregation value of 60% suggests that L. equigenerosi Le1 forms strong aggregates, which may increase adhesion to epithelial cells. The level of auto-aggregation compares well with the 48% to 64% values recorded for the probiotic strains Enterococcus mundtii ST4SA, L. plantarum 423, L. casei Shirota, L. johnsonii La1, L. casei MB1, and L. rhamnosus GG (5).
Coaggregation with a pathogen is important in that it may prevent the pathogen from binding to mucus or epithelial cells. In the case of bacteriocin-producing strains, coaggregation forces the cell closer to the target (28). Approximately half (47%) of the L. equigenerosi Le1 cells coaggregated with C. difficile C6. Botes and coworkers (5) reported 48% coaggregation of L. rhamnosus GG with Listeria monocytogenes ScottA. L. johnsonii La1, on the other hand, did not coaggregate with L. monocytogenes ScottA (5). Coaggregation seems to be species and, most probably, strain specific. L. casei Shirota did not coaggregate with L. monocytogenes ScottA, whereas L. casei MB1 coaggregated with L. monocytogenes ScottA (5). Strain Le1 does not produce bacteriocins. It would thus be interesting to determine how many of the coaggregated C. difficile cells remained viable and if they could recolonize the GIT. These questions need to be addressed with in vivo studies on healthy horses.
Adhesion of lactic acid bacteria to epithelial cells has been reported in many studies. Most of the in vitro studies have been done with colon adenocarcinoma cell lines Caco-2 and HT-29 (5, 15, 18, 24, 31, 35). Adhesion of L. equigenerosi Le1 to viable buccal epithelial cells is not surprising, although interaction between the cells, based on the low percentage of adhesion (1%), is probably very weak. As far as we could determine, this is the first report on the invasion of lactic acid bacteria into epithelial cells. The fact that L. equigenerosi Le1 did not adhere to or invade dead epithelial cells suggests that the physiological condition of the cells plays an important role in cellular interaction. The inability of pronase-treated cells to adhere to, or invade, viable epithelial cells suggests that a specific protein on the surface of strain Le1 plays a key role. Invasion of viable epithelial cells after treatment of the bacteria with pepsin suggests that the protein on the surface of L. equigenerosi Le1 that may be involved in adhesion to epithelial cells is less sensitive to pepsin. In another study (5), treatment of L. plantarum 423 and E. mundtii ST4SA with pepsin, pronase, and trypsin led to a decrease in adhesion to Caco-2 cells.
Only a few cells (1%) of L. equigenerosi Le1 and C. difficile C6 adhered to viable epithelial cells. The increase in adherence of L. equigenerosi Le1 to epithelial cells (from 1 to 3%) in the presence of C. difficile C6 may be ascribed to the high level of aggregation (47%) recorded between the two strains. Coaggregation with C. difficile C6 could have enforced physical contact between L. equigenerosi Le1 and the epithelial cells. No visual signs of the opposite, i.e., an increase in adherence of C. difficile C6 to epithelial cells in the presence of L. equigenerosi Le1, were observed; this rules out the possibility of L. equigenerosi Le1 stimulating the adhesion of C. difficile C6 to epithelial cells. Ramiah et al. (27) have reported the opposite. In their study, L. plantarum 423 prevented the adherence of Clostridium sporogenes LMG 13570 to Caco-2 cells.
L. equigenerosi Le1 is present in feces but at low numbers, as recorded from growth on modified MRS agar plates. Furthermore, L. equigenerosi cell numbers in the feces remained more or less constant during the trial. This suggests that many of the L. equigenerosi cells administered either have not survived transit or have colonized the GIT. The absence of DNA bands specific for L. equigenerosi (Fig. 5) in feces sampled after the 10-day administration period does not mean that no cells were present. According to Endo et al. (11), cell numbers below 1 × 10³ CFU g−1 feces cannot be detected with DGGE.
Pathogenicity is usually recorded as an increase in WBC counts (7, 29). Constant levels recorded for WBC and neutrophil counts suggest that the equine immune system did not recognize L. equigenerosi Le1 as a pathogen. Furthermore, the stability in lymphocyte, monocyte, eosinophil, and basophil numbers recorded throughout the trial suggests that L. equigenerosi Le1 did not elicit an allergic response. The decreases in RBC count, hemoglobin, and hematocrit levels observed during the 7 days after administration of L. equigenerosi Le1 have also been observed in horses that were not administered L. equigenerosi Le1 (controls). The reason for this phenomenon is not clear. It might well be that the RBC, hemoglobin, and hematocrit levels were abnormally high at the beginning of the trial due to stress, accompanied by an elevated heart rate. The lower RBC, hemoglobin, and hematocrit levels recorded at the end of the trial (last 7 days) may thus present normal levels. The opposite findings in hemoglobin and hematocrit levels, from low to high, have been reported when piglets were administered enterocin-A, a bacteriocin produced by Enterococcus faecium EK13 (33). L. equigenerosi Le1 does not produce a bacteriocin.
High levels of aspartate aminotransferase are usually observed in horses with clinical signs of acute colic (26, 34). The constant levels recorded in our study correlate with the observation that all horses were healthy throughout the trial. L. equigenerosi Le1 did not initiate colic.
The reason why cholesterol levels decreased during the week after administration with L. equigenerosi Le1 is not known. Similar results were reported when Enterococcus faecium EK13 was administered to piglets (33). The results suggest that strain Le1 has anti-cholesterol properties. Although the decrease in cholesterol levels was significant (P ≤ 0.05), the values (2.3 mmol liter−1 to 2.2 mmol liter−1) fall within the range that has been recorded for healthy horses (25) and are not considered to be biologically significant. Cholesterol and bile salt metabolism are closely linked. Bile salts are deconjugated during enterohepatic circulation by bile salt hydrolase (BSH) (EC 3.5.1.24), and the free bile acids, including glycine and taurine, are excreted in the feces. Lactobacillus equigenerosi Le1 did not display extracellular BSH activity, which correlates with the finding that cholesterol levels remained constant during administration. This may also explain why no drastic decrease in cholesterol levels has been recorded after 1 week of administration with strain Le1.
Blood glucose and lactate levels vary according to the physiological state of the animal; e.g., higher glucose levels have been reported in horses at the start of training (34). Elevated glucose levels may cause colic (13). Lactate levels usually increase with exercise but are also related to diet (37). If not controlled, abnormally high levels of lactate in the blood may lead to lactic acidosis (1). The gradual decrease in blood glucose and lactate levels in animals that have been administered L. equigenerosi Le1 is viewed as a positive change.
High levels of urea in blood may lead to encephalopathy. Salminen and coworkers (30) have shown that L. acidophilus may lower blood ammonia levels. Similar findings have been reported for Enterococcus faecium SF68 (19). Our results have shown that L. equigenerosi Le1 has similar properties.
Conclusions.
Lactobacillus equigenerosi Le1 survived low pH and bile salts in vitro, suggesting that the species may survive similar conditions in the GIT. However, the steep decline (an estimated 80%) in viable cell numbers during the administration period and the further decline in cell numbers to an estimated level of below 1 × 10³ CFU g−1 feces suggest that many of the cells did not survive conditions in the lumen. The findings that L. equigenerosi Le1 has high auto-aggregation properties and that the cells invade epithelial cells suggest that the species is well adapted to colonize the equine GIT. Strain Le1 is not pathogenic and did not elicit an allergy response. The decreases in glucose, lactate, cholesterol, and urea levels are considered positive attributes. Lactobacillus equigenerosi Le1 may be used as an equine probiotic.
ACKNOWLEDGMENTS
We thank E. Dicks, S. Dicks, R. Williams, and C. Pretorius for attending to the horses and Animal Science, University of Stellenbosch, for providing the animal housing facilities.
Footnotes
Published ahead of print 13 April 2012
REFERENCES
- 1. Al Jassim RAM, Scott PT, Trebbin AL, Trott D, Pollitt CC. 2005. The genetic diversity of lactic acid producing bacteria in the equine gastrointestinal tract. FEMS Microbiol. Lett. 248:75–81 [DOI] [PubMed] [Google Scholar]
- 2. Arroyo LG, Staempfli H, Weese JS. 2007. Molecular analysis of Clostridium difficile isolates recovered from horses with diarrhea. Vet. Microbiol. 120:179–183 [DOI] [PubMed] [Google Scholar]
- 3. Båverud V, Gustafsson A, Franklin A, Aspán A, Gunnarsson A. 2003. Clostridium difficile: prevalence in horses and environment, and antimicrobial susceptibility. Equine Vet. J. 35:465–471 [DOI] [PubMed] [Google Scholar]
- 4. Bonhomme-Florentin A. 1988. Degradation of hemicellulose and pectin by horse caecum contents. Br. J. Nutr. 60:185–192 [DOI] [PubMed] [Google Scholar]
- 5. Botes M, Loos B, Van Reenen CA, Dicks LMT. 2008. Adhesion of the probiotic strains Enterococcus mundtii ST4SA and Lactobacillus plantarum 423 to Caco-2 cells under conditions simulating the intestinal tract, and in the presence of antibiotics and anti-inflammatory medicaments. Arch. Microbiol. 190:573–584 [DOI] [PubMed] [Google Scholar]
- 6. Collado MC, Meriluoto J, Salminen S. 2008. Interactions between pathogens and lactic acid bacteria: aggregation and coaggregation abilities. Eur. J. Food Res. Technol. 226:1065–1073 [Google Scholar]
- 7. De la Rebière de Pouyade G, Serteyn D. 2010. The role of activated neutrophils in the early stage of equine laminitis. Vet. J. 189:27–33 [DOI] [PubMed] [Google Scholar]
- 8. Dicks LMT, Botes M. 2010. Probiotic lactic acid bacteria in the gastro-intestinal tract: health benefits, safety and mode of action. Benef. Microbes 1:11–29 [DOI] [PubMed] [Google Scholar]
- 9. Doyle RJ, Rosenberg M. 1995. Measurement of microbial adhesion to hydrophobic substrata. Methods Enzymol. 253:542–550 [DOI] [PubMed] [Google Scholar]
- 10. Endo A, Okada S. 2005. Monitoring the lactic acid bacterial diversity during Shochu fermentation by PCR-denaturing gradient gel electrophoresis. J. Biosci. Bioeng. 99:216–221 [DOI] [PubMed] [Google Scholar]
- 11. Endo A, Roos S, Satoh E, Morita H, Okada S. 2008. Lactobacillus equigenerosi sp. nov., a coccoid species isolated from faeces of thoroughbred racehorses. Int. J. Syst. Evol. Microbiol. 58:914–918 [DOI] [PubMed] [Google Scholar]
- 12. Felske A, Rheims H, Wolterink A, Stackebrandt E, Akkermans ADL. 1997. Ribosome analysis reveals prominent activity of an uncultured member of the class Actinobacteria in grassland soils. Microbiology 143:2983–2989 [DOI] [PubMed] [Google Scholar]
- 13. Frape D. 2010. Equine nutrition and feeding, 4th ed Wiley-Blackwell, Chichester, United Kingdom [Google Scholar]
- 14. Gaggìa F, Mattarelli P, Biavati B. 2010. Probiotics and prebiotics in animal feeding for safe food production. Int. J. Food Microbiol. 141:S15–S28 [DOI] [PubMed] [Google Scholar]
- 15. Gopal PK, Prasad J, Smart J, Gill HS. 2001. In vitro adherence properties of Lactobacillus rhamnosus DR20 and Bifidobacterium lactis DR10 strains and their antagonistic activity against an enterotoxigenic Escherichia coli. Int. J. Food Microbiol. 67:207–216 [DOI] [PubMed] [Google Scholar]
- 16. Jones RL, Adney WS, Shideler RK. 1987. Isolation of Clostridium difficile and detection of cytotoxin in the feces of diarrheic foals in the absence of antimicrobial treatment. J. Clin. Microbiol. 25:1225–1227 [DOI] [PMC free article] [PubMed] [Google Scholar]
- 17. Kern DL, Slyter LL, Leffel EC, Weaver JM, Oltjen RR. 1974. Ponies vs. steers: microbial and chemical characteristics of intestinal ingesta. J. Anim. Sci. 38:559–564 [DOI] [PubMed] [Google Scholar]
- 18. Kirjavainen P, Ouwehand A, Isolauri E, Salminen S. 1998. The ability of probiotic bacteria to bind to human intestinal mucus. FEMS Microbiol. Lett. 167:185–189 [DOI] [PubMed] [Google Scholar]
- 19. Loguercio C, Del Vecchio Blanco C, Coltorti M. 1987. Enterococcus lactic acid bacteria strain SF68 and lactulose in hepatic encephalopathy: a controlled study. J. Int. Med. Res. 15:335–343 [DOI] [PubMed] [Google Scholar]
- 20. Madewell BR, et al. 1995. Apparent outbreaks of Clostridium difficile-associated diarrhea in horses in a veterinary medical teaching hospital. J. Vet. Diagn. Invest. 7:343–346 [DOI] [PubMed] [Google Scholar]
- 21. Magdesian KG, Hirsh DC, Jang SS, Hansen LM, Madigan JE. 2002. Characterization of Clostridium difficile isolates from foals with diarrhea: 28 cases (1993–1997). J. Am. Vet. Med. Assoc. 220:67–73 [DOI] [PubMed] [Google Scholar]
- 22. Malik A, et al. 2003. Coaggregation among nonflocculating bacteria isolated from activated sludge. Appl. Environ. Microbiol. 69:6056–6063 [DOI] [PMC free article] [PubMed] [Google Scholar]
- 23. Morita H, et al. 2009. Lactobacillus hayakitensis, L. equigenerosi and L. equi, predominant lactobacilli in the intestinal flora of healthy thoroughbreds. Anim. Sci. J. 80:339–346 [DOI] [PubMed] [Google Scholar]
- 24. Ouwehand AC, Kirjavainen PV, Grönland Isolauri M-ME, Salminen SJ. 1999. Adhesion of probiotic micro-organisms to intestinal mucus. Int. Dairy J. 9:623–630 [Google Scholar]
- 25. Pagan JD. 1998. Advances in equine nutrition, 1st ed Nottingham University Press, Thrumpton, Nottingham, United Kingdom [Google Scholar]
- 26. Patton K, Wright A, Kuroki K, Beard L. 2009. Hemorrhagic gastritis associated with renal failure, hemoglobinuria, and isolation of Clostridium perfringens in a horse. J. Equine Vet. Sci. 29:633–638 [Google Scholar]
- 27. Ramiah K, Van Reenen CA, Dicks LMT. 2008. Surface-bound proteins of Lactobacillus plantarum 423 that contribute to adhesion of Caco-2 cells and their role in competitive exclusion and displacement of Clostridium sporogenes and Enterococcus faecalis. Res. Microbiol. 159:470–475 [DOI] [PubMed] [Google Scholar]
- 28. Reid G, McGroarty JA, Angotti R, Cook RL. 1988. Lactobacillus inhibitor production against Escherichia coli and coaggregation ability of uropathogens. Can. J. Microbiol. 34:344–351 [DOI] [PubMed] [Google Scholar]
- 29. Rubino G, et al. 2006. Hematology and some blood chemical parameters as a function of tick-borne disease (TBD) signs in horses. J. Equine Vet. Sci. 26:475–480 [Google Scholar]
- 30. Salminen S, Deighton M, Gorbach S. 1993. Lactic acid bacteria in health and disease, p 199–225 In Salminen S, Von Wright A. (ed), Lactic acid bacteria. Marcel Dekker, Inc, New York, NY [Google Scholar]
- 31. Sambuy Y, et al. 2005. The Caco-2 cell line as a model of the intestinal barrier: influence of cell and culture-related factors on Caco-2 cell functional characteristics. Cell Biol. Toxicol. 21:1–26 [DOI] [PubMed] [Google Scholar]
- 32. Schillinger U, Guigas C, Holzapfel WH. 2005. In vitro adherence and other properties of lactobacilli used in probiotic yoghurt-like products. Int. Dairy J. 15:1289–1297 [Google Scholar]
- 33. Strompfová V, et al. 2006. Enterococcus faecium EK13—an enterocin-A producing strain with probiotic character and its effect in piglets. Anaerobe 12:242–248 [DOI] [PubMed] [Google Scholar]
- 34. Tateo A, Valle E, Padalino B, Centoducati P, Bergero D. 2008. Change in some physiologic variables induced by Italian traditional conditioning in starndardbred yearling. J. Equine Vet. Sci. 28:743–750 [Google Scholar]
- 35. Tuomola EM (née Lehto), Salminen SJ. 1998. Adhesion of some probiotic and dairy Lactobacillus strains to Caco-2 cell cultures. Int. J. Food Microbiol. 41:45–51 [DOI] [PubMed] [Google Scholar]
- 36. Walter J, et al. 2001. Detection of Lactobacillus, Pediococcus, Leuconostoc, and Weissella species in human feces by using group-specific PCR primers and denaturing gradient gel electrophoresis. Appl. Environ. Microbiol. 67:2578–2585 [DOI] [PMC free article] [PubMed] [Google Scholar]
- 37. Zobba R, et al. 2011. Physical, hematological, and biochemical responses to acute intense exercise in polo horses. J. Equine Vet. Sci. 31:542–548 [Google Scholar]