

Abstract
In Staphylococcus aureus, the SaeRS two-component system controls the expression of multiple virulence factors. Of the two promoters in the sae operon, P1 is autoinduced and has two binding sites for the response regulator SaeR. In this study, we examined the organizational requirements of the SaeR binding sites in P1 for transcription activation. Mutational studies showed that both binding sites are essential for binding to phosphorylated SaeR (P-SaeR) and transcription activation. When the 21-bp distance between the centers of the two SaeR binding sites was altered to 26 bp, 31 bp, 36 bp, or 41 bp, only the 31-bp mutant retained approximately 40% of the original promoter activity. When the −1-bp spacing (i.e.,1-bp overlap) between the primary SaeR binding site and the −35 promoter region was altered, all mutant P1 promoters failed to initiate transcription; however, when the first nucleotide of the −35 region was changed from A to T, the mutants with 0-bp or 22-bp spacing showed detectable promoter activity. Although P-SaeR was essential for the binding of RNA polymerase to P1, it was not essential for the binding of the enzyme to the alpha-hemolysin promoter. When the nonoptimal spacing between promoter elements in P1 or the coagulase promoter was altered to the optimal spacing of 17 bp, both promoters failed to initiate transcription. These results suggest that SaeR binding sites are under rather strict organizational restrictions and provide clues for understanding the molecular mechanism of sae-mediated transcription activation.
INTRODUCTION
Staphylococcus aureus is a Gram-positive human pathogen that commonly inhabits the skin, anterior nares, and mucous membranes. It causes a wide spectrum of diseases, ranging from superficial skin infections to life-threatening infections (2, 37). Its pathogenic versatility is due partly to the production of numerous virulence factors, such as surface- and cell-associated proteins, secreted toxins, and enzyme proteins (2, 17). The expression of most virulence factors is coordinated by various regulatory factors, including DNA binding proteins (e.g., MgrA, SarA, and Rot), alternative sigma factors (e.g., σB, σH, and σS), and two-component systems (TCSs; e.g., agr, saeRS, srrAB, and arlRS) (9, 13, 18, 30, 34, 38, 41, 42, 46).
In bacteria, TCSs play an important role in the sensing of and response to a wide range of environmental stimuli (48). The key elements of this signaling system are a sensor histidine kinase (HK) and a response regulator (RR). Upon the recognition of cognate stimuli, the HK autophosphorylates the conserved histidine residue and then the phosphate group is transferred to an aspartate residue of its cognate RR. The phosphorylation typically activates the function of the RR, such as protein-protein interaction, enzymatic activity, or DNA binding activity, and brings about the desired response to the environmental stimuli (20, 48).
S. aureus genomes typically contain 16 TCSs; among them, the SaeRS TCS is essential for the production of multiple virulence factors such as alpha-hemolysin (Hla), coagulase (Coa), and fibronectin-binding proteins (24, 25, 42, 47). The sae operon consists of two promoters, P1 and P3, and four open reading frames (ORFs), saeP, saeQ, saeR, and saeS (Fig. 1) (22, 23). P3, located inside saeQ, is a fairly constitutive promoter and transcribes saeR and saeS, the genes for the RR and HK, respectively. On the other hand, P1, located in front of saeP, can transcribe all four ORFs (Fig. 1) (21, 31, 50). P1 is a well-characterized target promoter of sae, and its transcription requires phosphorylated SaeR (P-SaeR) (43, 50). P1 contains two SaeR binding sites, the primary binding site with no mismatch and the secondary binding site with one mismatch (Fig. 1). Previously, we showed that the primary binding site is essential for SaeR binding and P1 promoter activity (50). However, the role of the secondary binding site in SaeR-mediated transcription activation remains to be determined.
Fig 1.

Schematic of the sae operon and sae target promoters. The sae operon consists of four ORFs and two promoters, P1 and P3. The sequence of P1 is illustrated under the map with other sae target promoters whose TSSs and promoter elements are reported. The SaeR binding sequence (GTTAAN6GTTAA) is in boldface and shaded in gray. The boxed nucleotides at the binding sites are the nucleotides mismatched with the consensus sequence. The −35 and −10 promoter regions are boxed and indicated. The TSS is in boldface and indicated by a right-angled arrow. Primary, the primary binding site; Secondary, the secondary binding site; Pcoa, promoter for coagulase (coa); Phla, promoter for alpha-hemolysin (hla); Pemp, promoter for extracellular matrix binding protein (emp). Note that Pemp contains three half-binding sites for SaeR.
Depending on strain backgrounds, the SaeRS TCS has been reported to control from 18 to more than 220 genes (36, 52). In our previous study, when one mismatch was allowed, more than 130 genes were found to contain at least one SaeR binding site, and more than 20 genes carry more than one SaeR binding site (50). In addition, among the sae target promoters whose transcription start sites (TSSs) are known, the spacing between the SaeR binding site and the −35 promoter region seems to vary; for example, while the spacing is −1 bp (i.e., 1-bp overlap) in P1 and the promoter for coagulase (Pcoa), it is 0 bp or 22 bp in the promoters for emp (Pemp) and alpha-hemolysin (Phla), respectively (10, 11, 47) (Fig. 1). Without further knowledge of the organizational requirements for functional SaeR binding sites, however, it is difficult to differentiate the functional SaeR binding sites from nonfunctional ones in the putative sae targets. In addition, it is unclear what roles the spacing between the SaeR binding site and the −35 region plays in SaeR-mediated transcription activation. In this study, therefore, we investigated the organizational requirement for the functional SaeR binding site using the sae P1 promoter as a model system. In addition, we purified RNA polymerase (RNAP) from S. aureus RN4220 to study the role of SaeR binding in transcription activation of the target promoters.
MATERIALS AND METHODS
Bacterial strains and culture conditions.
The strains and plasmids used in this study are listed in Table 1. Escherichia coli and S. aureus were grown in Luria-Bertani broth and tryptic soy broth (TSB), respectively. When necessary, antibiotics were added to the growth medium at the following concentrations: ampicillin, 100 μg/ml; erythromycin, 10 μg/ml; chloramphenicol, 5 μg/ml.
Table 1.
Bacterial strains and plasmids used in this study
| Strain or plasmid | Relevant characteristic(s) | Source or reference |
|---|---|---|
| E. coli DH5α | Plasmid fee, restriction deficient | New England Biolabs |
| S. aureus | ||
| RN4220 | Restriction deficient, prophage free | 33 |
| Newman | Clinical isolate, L18P substitution in SaeS | 15 |
| USA300-P23 | USA300-0114 without plasmids 2 and 3, wild-type SaeS | 32 |
| ΦΝΞ-01594 | Newman with saeR transposon mutation | Phoenix mutant library |
| RN4220rpoChis | RN4220 with pKOR1-rpoC integrated into chromosome | This study |
| Plasmids | ||
| pCL-lacZ | pCL55 carrying promoterless lacZ | 50 |
| pCL-PgyrB-lacZ | gyrB-lacZ fusion in pCL-lacZ | This study |
| pCL-P1-lacZ | P1-lacZ fusion in pCL-lacZ | 50 |
| pCL-P1-M1-lacZ | P1 mutant with perfect secondary SaeR binding site | This study |
| pCL-P1-M2-lacZ | P1 mutant with no secondary SaeR binding site | This study |
| pCL-P1-M3-lacZ | P1 mutant with no primary SaeR binding site | This study |
| pCL-P1+5-lacZ | 10-bp spacing between SaeR binding sites | This study |
| pCL-P1+10-lacZ | 15-bp spacing between SaeR binding sites | This study |
| pCL-P1+15-lacZ | 20-bp spacing between SaeR binding sites | This study |
| pCL-P1+20-lacZ | 25-bp spacing between SaeR binding sites | This study |
| pCL-P1+1A-lacZ | 0-bp spacing between SaeR binding site and promoter | This study |
| pCL-P1+1T-lacZ | pCL-P1+1A-lacZ with A-T mutation in −35 region | This study |
| pCL-P1+6A-lacZ | 5-bp spacing between SaeR binding site and promoter | This study |
| pCL-P1+6T-lacZ | pCL-P1+6A-lacZ with A-T mutation in −35 region | This study |
| pCL-P1+11A-lacZ | 10-bp spacing between SaeR binding site and promoter | This study |
| pCL-P1+11T-lacZ | pCL-P1+11A-lacZ with A-T mutation in −35 region | This study |
| pCL-P1+23A-lacZ | 22-bp spacing between SaeR binding site and promoter | This study |
| pCL-P1+23T-lacZ | pCL-P1+23A-lacZ with A-T mutation in −35 region | This study |
| pCL-P1−1-lacZ | pCL-P1-lacZ with 17-bp spacing between promoter elements | This study |
| pCL-Pcoa-lacZ | Pcoa-lacZ fusion in pCL-lacZ | 32 |
| pCL-Pcoa+1-lacZ | pCL-Pcoa-lacZ with 17-bp spacing between promoter elements | This study |
| pCL-Phla-lacZ | Phla-lacZ fusion in pCL-lacZ | 32 |
| pKOR1 | Allelic replacement plasmid | 3 |
| pKOR1-rpoC | pKOR1 carrying rpoC with His10 tag at C terminus | This study |
DNA manipulation.
The restriction enzymes and DNA modification enzymes were purchased from New England BioLabs (NEB). DNA isolation and manipulation in E. coli and S. aureus were carried out according to standard procedures (26, 32). Plasmids and genomic DNA were extracted with the Zyppy plasmid miniprep kit (Zymo reseach) and the Wizard genomic DNA purification kit (Promega), respectively. The primers used in this study are listed in Table 2. DNA fragments were PCR amplified with the high-fidelity DNA polymerase Phusion (NEB), and the PCR products were purified with the QuickClean PCR extraction kit (GenScript).
Table 2.
Primers used in this study
| Purpose and primer | Sequence (5′→ 3′)a |
|---|---|
| RNAP | |
| P1038 | GGGGACAAGTTTGTACAAAAAAGCAGGCTCACCTGAAATTGCTAAGAAAATTAC |
| P1079 | TTATTAATGATGGTGATGATGATGATGGTGATGATGTTCCGTTACTTCAGTTTGAGATTC |
| P1156 | GGGGACCACTTTGTACAAGAAAGCTGGGTTTATTAATGATGGTGATGATGATG |
| P1 amplification | |
| P671 | AACGAATTCTTGGTACTTGTATTTAATCGTCTATC |
| P673 | AAAGGTACCGTTGTGATAACAGCACCAGCT GC |
| PgyrB amplification | |
| P918 | CTAGAATTCAAAGGTGACGACTCGGTAACG |
| P919 | CTAGGTACCGTGTATTTAACTTCATTGTTCACC |
| Phla amplification | |
| P931 | CCCGAATTCGAGTTTATAATATTATTCAACTCTGTC |
| P639 | CCCGGTACCCTGAGCTGACTATACGTGTTTTC |
| P1306 | TTTTCTCTATTTCTATTTATTAATTTACACTA |
| P1307 | CTTTAAAACTAATGATTTGTTTGATTTAAAAA |
| Pcoa amplification | |
| P1161 | GGAATTCGAATTGTAAATACTTTCTAATC |
| P1162 | GGGGTACCGCGCCTAGCGAAATTATTTGC |
| P1492 | GTTGTCATGCTTTGTTACTCCTTTG |
| In vitro transcription | |
| P641 | TAACGCCAGGGTTTTCCCGGTCGAC |
| P850 | CCACCTGACGTCTAAGAAACC |
| Mutagenesis of SaeR binding sites | |
| P1080 | CTTAACTTCGTTTAACTATCGCTTAAC |
| P1081 | GTTAAGCGATAGTTAAACGAAGTTAAG |
| P1082 | CTTAACTTCGTTATAATATCGCTATACTAAATTG |
| P1083 | CAATATTAGTATAGCGATATTATAACGAAGTTAAG |
| P1157 | CCATTAACTAATTCTTGGCTTCGTTTAACTATCGC |
| P1158 | GCGATAGTTAAACGAAGCCAAGAATTAGTTAATGG |
| Insertion mutagenesis between SaeR binding sites | |
| P1471 | GTTAAGCGATATTTAAACGAAACGAAGTTAAGAATTAG |
| P1472 | CTAATTCTTAACTTCGTTTCGTTTAAATATCGCTTAAC |
| P1473 | GTTAAGCGATATTTAAACGAAACGAAACGAAGTTAAGAATTAG |
| P1474 | CTAATTCTTAACTTCGTTTCGTTTCGTTTAAATATCGCTTAAC |
| P1507 | CTAATTCTTAACTTCGTTTCGTTTCGTTTGTTTAAATATCGCTTAAC |
| P1508 | GTTAAGCGATATTTAAACGAAACGAAACGAAACGAAGTTAAGAATTAG |
| P1509 | CTAATTCTTAACTTCGTTTCGTTTCGTTTCGTTTCGTTTAAATATCGCTTAAC |
| P1510 | CTAATTCTTAACTTCGTTTCGTTTCGTTTCGTTTCGTTTAAATATCGCTTAAC |
| Insertion mutagenesis between SaeR binding site and −35 region | |
| P1579 | GTTAAGAATTAGTTAAGAATTATGGCATATTATTTGC |
| P1580 | GCAAATAATATGCCATAATTCTTAACTAATTCTTAAC |
| P1581 | GTTAAGAATTAGTTAAGAATTAGAATATGGCATATTATTTGC |
| P1582 | GCAAATAATATGCCATATTCTAATTCTTAACTAATTCTTAAC |
| P1583 | GTTAAGAATTAGTTAATTTTTATTTAATATTTAATTAATTTGGCATATTATTTGC |
| P1584 | GCAAATAATATGCCAATTAATTAAATATTAAATAAAAATTAACTAATTCTTAAC |
| P1603 | GTTAAGAATTAGTTAAATGGCATATTATTTGC |
| P1604 | GCAAATAATATGCCATTTAACTAATTCTTAAC |
| P1605 | GTTAAGAATTAGTTAATTGGCATATTATTTGC |
| P1606 | GCAAATAATATGCCAATTAACTAATTCTTAAC |
| P1607 | GTTAAGAATTAGTTAAGAATTTTGGCATATTATTTGC |
| P1608 | GCAAATAATATGCCAAAATTCTTAACTAATTCTTAAC |
| P1609 | GTTAAGAATTAGTTAAGAATTAGAATTTGGCATATTATTTGC |
| P1610 | GCAAATAATATGCCAAATTCTAATTCTTAACTAATTCTTAAC |
| P1611 | GTTAAGAATTAGTTAATTTTTATTTAATATTTAATTAAATGGCATATTATTTGC |
| P1612 | GCAAATAATATGCCATTTAATTAAATATTAAATAAAAATTAACTAATTCTTAAC |
| Spacing mutagenesis between promoter elements | |
| P1672 | GAATTAGTTAATGGCATATTATTGCCTTCATTTTAAACTTAACTTATC |
| P1673 | GATAAGTTAAGTTTAAAATGAAGGCAATAATATGCCATTAACTAATTC |
| P1682 | GTCTTTTAATATTTTTGTTTCTTTAATGTAGATTGGG |
| P1683 | CCCAATCTACATTAAAGAAACAAAAATATTAAAAGAC |
Underlined sequences are restriction enzyme sites.
Mutagenesis of P1 and Pcoa.
To mutate the SaeR binding sites in P1, two DNA fragments were PCR amplified from pCL-P1-lacZ (Table 1) (50) with primer pair P671/P1081, P671/P1083, or P671/P1671 for the first fragment and primer pair P673/1080, P673/P1082, or P673/P1670 for the second fragment (Table 2). To increase the spacing between the primary and secondary binding sites, the primer pairs used were P671/P1472, P671/P1474, P671/P1508, or P671/P1510 for the first fragment and P673/P1471, P673/P1473, P673/P1507, or P673/P1509 for the second fragment. To insert nucleotides between the primary SaeR binding site and the −35 promoter region, the primer pairs used were P671/P1064, P671/P1580, P671/P1582, P671/P1584, P671/P1606, P671/P1608, P671/P1610, or P671/P1612 for the first fragment and P673/P1063, P673/P1579, P673/P1581, P673/P1583, P673/P1605, P673/P1607, or P673/P1609 for the second fragment. To alter the spacing between the promoter elements, DNA fragments were PCR amplified using primer pairs P671/P1673 (P1) and P1161/P1683 (Pcoa) for the first fragment and P673/P1672 (P1) and P1162/P1682 (Pcoa) for the second fragment. The first and second fragments were mixed and further subjected to PCR amplification with primer pair P671/P673 (P1) or P1161/P1162 (Pcoa). The resulting fragments were digested with EcoRI and KpnI and inserted into plasmid pCL-lacZ (50). The intended mutations were all verified by DNA sequencing analysis. The resulting plasmids were electroporated into S. aureus RN4220 and then transduced with ϕ85 into strain Newman or USA300-P23 (Table 1).
Electrophoretic mobility shift assay.
The DNA probes were PCR amplified from plasmid DNA carrying the target promoter sequences (Table 1) with primer pairs P671/P673 (P1), P1492/P1162 (Pcoa), and P1306/P1307 (Phla) (Table 2), and then the 5′ ends of the PCR products were labeled with [γ-32P]ATP (Perkin-Elmer) using T4 polynucleotide kinase (NEB). The purified SaeR protein (32 μM) was phosphorylated with the cytoplasmic domain of SaeS (SaeSc, 4 μM) in 10 mM Tris-HCl (pH 7.4)–50 mM KCl–5 mM MgCl2–10% glycerol as described previously (50). The probe (2 ng) was mixed with various amounts of phosphorylated SaeR (P-SaeR) in a 20-μl reaction mixture containing 10 mM Tris-HCl (pH 7.4), 50 mM KCl, 5 mM MgCl2, 10% glycerol, and 3 μg/ml sheared salmon sperm DNA. In RNAP binding experiments, purified RNAP (0.7 μg) was mixed with the probes in the presence of either nonphosphorylated SaeR or P-SaeR. Binding reaction mixtures were incubated at room temperature for 15 min, and then samples were analyzed by 5% PAGE. The gels were dried and exposed to X-ray film (Fuji). Images were quantified with the ImageJ software (NIH).
Insertion of His10 tag sequence into C terminus of rpoC.
A 1,068-bp rpoC fragment containing a His10 tag sequence at its C terminus was PCR amplified with primer pair P1038/P1079 and reamplified with primer pair P1038/P1156. The PCR product was inserted into pKOR1 (3) using the BP clonase (Invitrogen). The resulting plasmid, pKOR1-rpoC, was electroporated into S. aureus RN4220 and incubated at 42°C. A strain with the plasmid integrated into the chromosome was identified by PCR analysis and named RN4220rpoChis.
Purification of S. aureus RNAP.
S. aureus RN4220rpoChis was grown in TSB at 30°C for 16 h and cooled down to 4°C. Cells were harvested by centrifugation, suspended in column buffer (50 mM Tris-HCl, pH 7.8, 300 mM NaCl, 5 mM MgCl2, 20% glycerol) containing lysostaphin (100 μg/ml), and incubated on ice for 1 h. After sonication, cell debris was precipitated by centrifugation at 12,000 × g for 1 h. The supernatant was applied to an Ni-nitrilotriacetic acid (GenScript) affinity column, and then the column was washed with column buffer containing 60 mM imidazole (Sigma). Proteins were eluted with column buffer containing 400 mM imidazole and dialyzed against storage buffer (10 mM Tris-HCl, pH 8.0, 10 mM MgCl2, 1 mM EDTA, 100 mM KCl, 10% glycerol). Protein concentrations were determined with the bicinchoninic acid protein assay kit (Pierce). Purified RNAP was separated by sodium dodecyl sulfate-polyacrylamide gel electrophoresis (SDS-PAGE), and the first four protein bands were analyzed by liquid chromatography-tandem mass spectrometry (MS) analysis at the Proteomics Core of the Indiana University School of Medicine.
In vitro transcription assays.
In vitro transcription assays were performed as described previously (19), with minor modifications. DNA templates were PCR amplified from a plasmid carrying the target promoter sequences with primer pair P850/P641 (Table 2). The purified RNAP (0.3 μg) and DNA templates (87.5 nM) were mixed with SaeR (4 μM) or P-SaeR (4 μM) in transcription buffer (20 mM Tris-HCl, pH 7.9, 20 mM NaCl, 20 mM MgCl2, 0.1 mM EDTA) containing10 mM β-mercaptoethanol; 0.25 mM ATP, CTP, and GTP; 0.025 mM UTP; 10 U of RNase inhibitor (Invitrogen); and 5 μCi of [α-32P]UTP. After incubation at 37°C for 15 min, transcripts were extracted with phenol-chloroform-isoamyl alcohol (25:24:1) and suspended in 3× loading buffer (6 M urea, 0.1 M EDTA, 5% glycerol, 0.25% bromophenol blue, 0.25% xylene cyanol). Samples were denatured at 95°C for 2 min, electrophoresed with a 6% acrylamide gel containing 6 M urea, and exposed to X-ray film (Fuji). The gel images were quantified by ImageJ (NIH).
β-Galactosidase assays.
β-Galactosidase activity was measured as described previously (50), with minor modifications. Briefly, the test strains were grown in TSB containing appropriate antibiotics at 37°C for 16 h. For human neutrophil peptide 1 (HNP-1) induction assays, the test strains were grown to an optical density at 600 nm (OD600) of 0.6 and induced with HNP-1 (5 μg/ml; Bachem) for 2 h. The cells in 1 ml of culture were collected by centrifugation, washed with AB buffer (100 mM potassium phosphate, 100 mM NaCl, pH 7.0), and suspended in 100 μl of AB buffer containing lysostaphin (0.1 μg/ml). After incubation at 37°C for 15 min, 900 μl of ABT buffer (AB buffer containing 0.1% Triton X-100) was added. Then 50 μl of cell lysate or its diluent was mixed with 10 μl of 4-methylumbelliferyl-β-d-galactopyranoside (4 mg/ml; Sigma) and incubated at room temperature for 1 h. A standard curve was obtained by using MU (4-methylumbiliferone; Sigma). The emission of fluorescence was measured with a plate reader (355-nm excitation and 455-nm emission wavelengths; Molecular Devices). β-Galactosidase activity was normalized by cell density (OD600), and then the activity was determined in AU (arbitrary units), where 1 AU corresponds to the generation of 1.2 × 10⁻⁸ mol of MU h−1 ml−1 OD600 unit−1.
RESULTS
The secondary SaeR binding site of P1 is essential for promoter function.
Of the two SaeR binding sites in P1, the primary binding site was shown to be essential for SaeR-mediated transcription activation; however, the role of the secondary binding site remains unknown. Therefore, to identify the role of the secondary binding site, we altered the SaeR binding sequence such that mutant M1 has two binding sites with a perfect sequence match, M2 does not have the secondary binding site, and M3 does not have the primary binding site but has the secondary binding site with a perfect sequence match (Fig. 2A). Then we examined the effects of the sequence alterations on the SaeR binding and in vivo promoter activities. As shown in Fig. 2B and C, the M1 mutant promoter showed approximately normal SaeR binding and promoter activities. On the other hand, the mutant M2 and M3 promoters showed similarly reduced affinities for P-SaeR (M2 and M3 in Fig. 2B), as well as either greatly reduced (M2) or no (M3) transcription activity (Fig. 2C).
Fig 2.

The secondary SaeR binding site in P1 is essential for promoter function. (A) Sequences of WT and mutant P1 promoters. SaeR binding sequences are indicated by gray shading. Mutated nucleotides are in boldface and underlined. (B) Effects of mutations on affinity for phosphorylated SaeR (P-SaeR). The P1 promoter probes were PCR amplified and end labeled with [γ-32P]ATP. The labeled DNAs (2 ng) were incubated with 3 μg/ml salmon sperm DNA and increasing amounts of P-SaeR (0 μM, 0.25 μM, 0.5 μM, 1 μM, 2 μM, 4 μM, and 8 μM in lanes 1 to 7). The protein-DNA complexes were analyzed by 6% PAGE. The white arrowhead indicates free DNA probes. (C and D) Effects of mutations on in vivo promoter activity in strains Newman (C) and USA300 (D). The data presented are representative of results obtained from three independent experiments. Error bars indicate standard deviations.
The assays described above were done with strain Newman (15), in which SaeS is in a constitutively active state due to the L18P mutation in the first transmembrane domain (1, 21). To examine whether the SaeR binding sites play the same role in a strain with wild-type (WT) SaeS activity, we repeated the assays with strain USA300-P23, a strain producing WT SaeS (21, 31). As shown in Fig. 2D, although the promoter activities were much lower, similar results were obtained: without either binding site, the promoter activity was either greatly reduced (M2) or abolished (M3). In addition, neither defective P1 promoter responded to induction by HNP-1, a known inducer of the SaeRS TCS (Fig. 2D) (21). Taken together, these data demonstrate that, at P1, both the primary and secondary sites are essential for SaeR-mediated transcriptional activation and the response to HNP-1.
In vitro transcription assays confirm the essential role of the secondary binding site.
To gain further insight into the molecular mechanism of transcription activation by SaeR, we performed in vitro transcription assays by using RNAP purified from S. aureus RN4220 (see Materials and Methods; Fig. 3A). SDS-PAGE analysis of purified RNAP produced five protein bands, and MS analysis identified the first four protein bands as β′, β, and α subunits and σA, respectively. Although not analyzed by MS, the last protein band is presumed to be the ϖ subunit (Fig. 3A) (45). When used for an in vitro transcription assay for the gyrB promoter, a SaeR-independent constitutive promoter, the purified RNAP produced transcripts in a concentration-dependent manner (Fig. 3B), confirming the functionality of the enzyme. When the P1 promoter was subjected to the in vitro transcription assay, WT P1 produced transcripts only when both P-SaeR and RNAP were present (Fig. 3C), confirming the essential role of P-SaeR in P1 transcription (compare lanes 3 and 4). Of the mutant P1 promoters, M1 produced transcripts at the WT level (lane 8 in Fig. 3C), recapitulating the in vivo lacZ assay result in Fig. 2C. However, no transcripts were produced from either M2 or M3, demonstrating the essential roles of both the primary and secondary binding sites in transcription initiation at P1.
Fig 3.
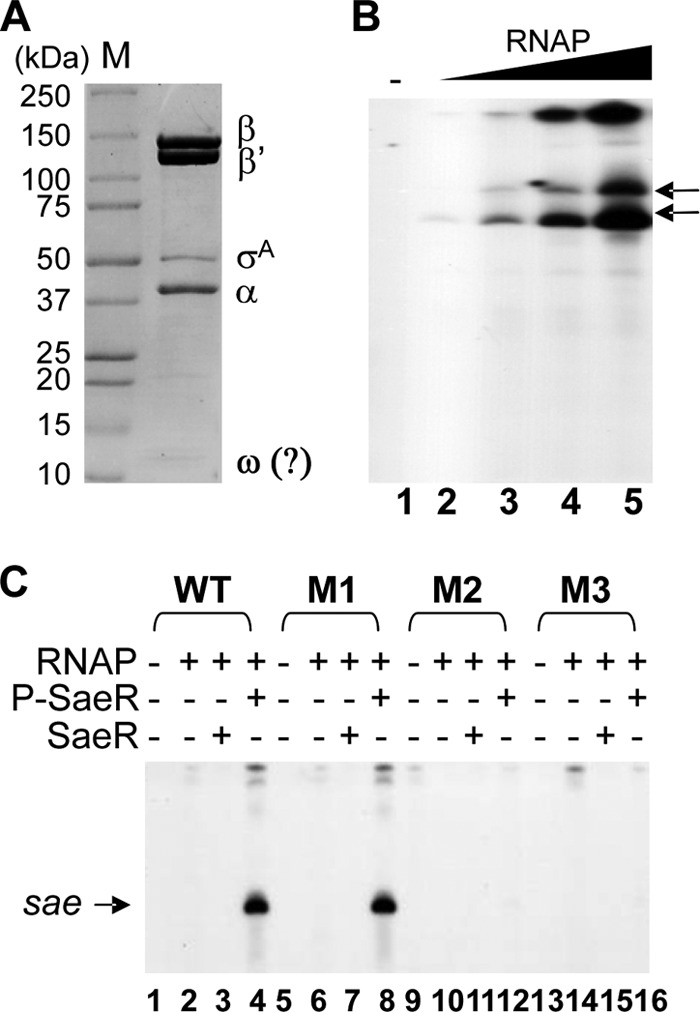
In vitro transcription assays confirm the essential role of the secondary SaeR binding site in P1 transcription. (A) SDS-PAGE analysis of purified S. aureus RNAP. The subunits of S. aureus RNAP (β, β′, σA, α, and ω) are indicated. M, molecular size marker proteins. (B) In vitro transcription assay for gyrB promoter. The PCR-amplified gyrB promoter was subjected to in vitro transcription assays in the presence of increasing amounts of S. aureus RNAP (0 μg, 0.15 μg, 0.3 μg, 0.6 μg, and 1.2 μg in lanes 1 to 5). The gyrB transcripts are indicated by arrows. −, no RNAP. (C) In vitro transcription assays for WT and mutant P1 promoters. DNA templates were PCR amplified and mixed with the RNAP (0.3 μg), SaeR (4 μM), and P-SaeR (4 μM) proteins in various combinations. M1 to M3, mutant P1 promoters shown in Fig. 2A. +, presence; −, absence.
SaeR binding sites should be on the same side of the DNA helix.
As the centers of the primary and the secondary binding sites are 21 bp apart, a distance allowing two turns of the DNA helix, the P-SaeR molecules bound to DNA are expected to reside on the same side of the DNA helix (WT in Fig. 4A). To further examine the binding requirement of SaeR, we altered the binding phases by inserting 5 bp, 10 bp, 15 bp, or 20 bp of random nucleotides between the binding sites and then measured their SaeR binding and promoter activities. As shown in Fig. 4B to D, the insertion of either 5 bp or 15 bp (+5 and +15), which puts the centers of the binding sites on opposite sides, greatly reduced both SaeR binding and promoter activities. On the other hand, the insertion of 10 bp, which would increase the distance to 31 bp (i.e., three helix turns), did not alter SaeR binding significantly, and the resulting mutant retained 30% to 40% of the WT promoter activity (+10 in Fig. 4B to D). The insertion of 20 bp, although it would be expected to maintain the binding phase, greatly reduced the SaeR binding and promoter activities (+20 in Fig. 4B to D). We also noted that the in vitro results did not always agree with the in vivo results. For example, although the +5-, +15-, and +20-bp insertion mutants showed similar in vitro promoter activities (16% to 18% of the WT level), under in vivo conditions, only the +5-bp insertion mutant showed significant promoter activity (approximately 10% of the WT level) and the other mutants completely lost their promoter activities (+5, +15, and +20 in Fig. 4D). These results imply that the requirements for efficient transcription are not identical under those two conditions. When the measurement of the in vivo promoter activity was repeated in the strain USA300-P23 background, we observed similar results. When the SaeR binding sites are expected to be on opposite sides of the DNA helix, only the +5 mutant showed detectable promoter activity while the +15 mutant lost its activity completely (+5 and +15 in Fig. 4E). When SaeR binding sites are expected to reside on the same side of the DNA helix, the promoter activity was inversely correlated with the distance of the binding sites (compare WT, +10, and +20 in Fig. 4D). Intriguingly, HNP-1 treatment induced promoter activity in the WT and the +5, and +20 mutants but not in the +10 mutant. These results suggest that for efficient SaeR-mediated transcription at P1, the SaeR binding sites should be on the same side of the DNA helix and that their optimal spacing is 21 bp.
Fig 4.

SaeR needs to bind to the same side of the DNA helix. (A) Sequences of WT and insertion mutant P1 promoters. SaeR binding sites are indicated by capital letters and gray shading. Shown to the left are the numbers of nucleotides inserted, which are in boldface italics and underlined. The distance between the centers (▽) of the SaeR binding sites is shown with the corresponding number of DNA helix turns. (B) Effects of nucleotide insertions on SaeR binding affinity. P1 promoters (2 ng) labeled with 32P were incubated with 3 μg/ml salmon sperm DNA and 0 μM, 0.25 μM, 0.5 μM, 1 μM, 2 μM, 4 μM, or 8 μM P-SaeR (lanes 1 to 7) and then subjected to 6% PAGE and autoradiography. The white arrowhead indicates free DNA probes, and the asterisks denote contaminant DNA unrelated to P1. (C) In vitro transcription assays for WT and mutant P1 promoters in various combinations of RNAP (0.3 μg), SaeR (4 μM), and P-SaeR (4 μM). The P1 transcript is indicated by the arrow. The quantification values of the transcripts are shown at the bottom, where the level of transcripts from WT P1 was set to 100%. +, presence; −, absence. (D and E) In vivo activity of WT and mutant P1 promoters measured by promoter-lacZ fusion assays in the background of strain Newman (D) or USA300 (E). Data are representative of results obtained from three independent experiments. Error bars indicate standard deviations. In panel E, statistical analysis was carried out by two-tailed t test. *, P < 0.05; **, P < 0.005; ns, not significant.
In P1, the optimal spacing between the SaeR binding site and the −35 region is −1 bp.
Next, we investigated the role of the spacing between the SaeR binding site and the −35 region in P1 transcription. Although the spacing is −1 bp in P1 (i.e., there is a 1-bp overlap), in other sae target promoters, such as Pemp and Phla, it is 0 bp and 22 bp, respectively (Fig. 1) (11, 27). To investigate whether that spacing is also optimized for SaeR-mediated transcription activation, we altered the spacing to 0 bp and 22 bp (Fig. 5A). In addition, to examine the effect of the binding phase, we also changed the spacing to 5 bp or 10 bp. When their promoter activity was measured by in vitro transcription and the lacZ reporter assays, the mutant P1 promoters showed no or very low activity (0, 5, 10, and 22 in Fig. 5B and C), suggesting that in P1, the −1-bp spacing is critical for SaeR-mediated transcriptional activation.
Fig 5.

In P1, the optimal spacing between the SaeR binding site and the −35 region is −1 bp. (A) Nucleotide insertion mutations and A-T transversion mutation in P1. The resulting spacing between the primary SaeR binding site and the −35 region is shown to the left. The consensus −35 and −10 promoter sequences are shown at the top. Gray shading indicates the half sequence of the primary SaeR binding site. The inserted nucleotides are italicized and underlined. The position of the A-T transversion mutation is indicated by a vertical rectangle and an arrow. The spacing between the −35 and −10 regions is indicated by the letter N with the nucleotide number. (B) In vitro transcription assays for the WT and mutant P1 promoters. Each reaction mixture contained 0.3 μg of RNAP and 4 μM either SaeR (−) or P-SaeR (+). Shown above is the spacing between the primary SaeR binding site and the −35 region, where T denotes the A-T transversion mutation in the −35 region. The arrow points to the specific sae transcripts from the promoters. At the bottom are the quantified values for the transcripts, where the level of transcripts from the WT P1 was set to 100%. (C) In vivo activity of the WT and spacing mutant promoters. Data are representative of results obtained from three independent experiments. Error bars depict standard deviations. (D) Effects of spacing mutations on binding to P-SaeR and RNAP. The WT and mutant promoters were mixed with RNAP (0.7 μg) and/or P-SaeR (0.5 μM), incubated for 15 min at room temperature, and then loaded onto a 5% polyacrylamide gel. The promoters tested are shown at the top. The white arrowhead indicates the free DNA probe, and the black arrowhead points to the DNA probes bound to P-SaeR. The black pinhead denotes the ternary complex of the DNA probe, P-SaeR, and RNAP. +, presence; −, absence.
Considering the fact that the 0-bp and 22-bp spacings are found in other known sae target promoters, the nearly complete loss of promoter activity was unexpected. Since successful transcription at sae target promoters would require intricate interactions between SaeR and RNAP, we suspected that the poor sequence conservation of the P1 promoter might be responsible for the inability of those spacing mutants to initiate transcription. Comparison of the promoter sequences shows that one of the main differences between P1 and Pemp/Phla is the first nucleotide of the −35 region: it is nonconsensus nucleotide A in P1, while it is consensus nucleotide T in Pemp and Phla (Fig. 1). Therefore, we changed the first nucleotide of the −35 region of P1 from A to T (Fig. 5A) and measured the promoter activity in the presence or absence of P-SaeR. As shown in Fig. 5B and C, while the mutant P1 promoters with 5-bp or10-bp spacing still completely lost their promoter activity, partial restoration of P-SaeR-dependent promoter activity was observed in mutant P1 with 0-bp or 22-bp spacing (5T and 10T versus 0T and 22T), suggesting that, along with −1 bp, the 0-bp and 22-bp spacings allow efficient interaction between P-SaeR and RNAP.
RNAP requires phosphorylated SaeR for binding to P1.
The −1-bp spacing between the primary SaeR binding site and the −35 sequence in P1 suggests that SaeR directly interacts with RNAP and, possibly, recruits RNAP to the promoter. To test this possibility, we examined RNAP binding to P1 in the presence of either unphosphorylated SaeR or phosphorylated SaeR (P-SaeR). As shown in Fig. 6, when unphosphorylated SaeR was present, RNAP binding to P1 was almost undetectable (top panel of Fig. 6). Intriguingly, the free probe appears to shift slightly in the presence of RNAP (compare lanes 1 to 5 and 6 to 10). However, since it was not consistently reproducible (data not shown), it seems that the slight shift might be caused by irregularity in the electrophoresis conditions. When P-SaeR was used in the binding assay, RNAP bound to P1 in a P-SaeR concentration-dependent manner (lanes 7 to 10 in the bottom panel of Fig. 6), demonstrating that P-SaeR is essential for efficient RNAP binding to P1. When the same assay was repeated for the mutant P1 with a T substitution, as shown in Fig. 5A, the functional promoters (i.e., WT and 0T and 22T mutant P1) produced a ternary complex of P-SaeR, RNAP, and P1 (WT, 0T, and 22T in Fig. 5D). On the other hand, the nonfunctional promoters, 5T and 10T, only showed a faster-migrating band or smears, implying that the promoters cannot form a stable ternary complex with RNAP and P-SaeR. These results further demonstrate that P-SaeR can efficiently interact with RNAP at a spacing of −1 bp, 0 bp, or 22 bp.
Fig 6.
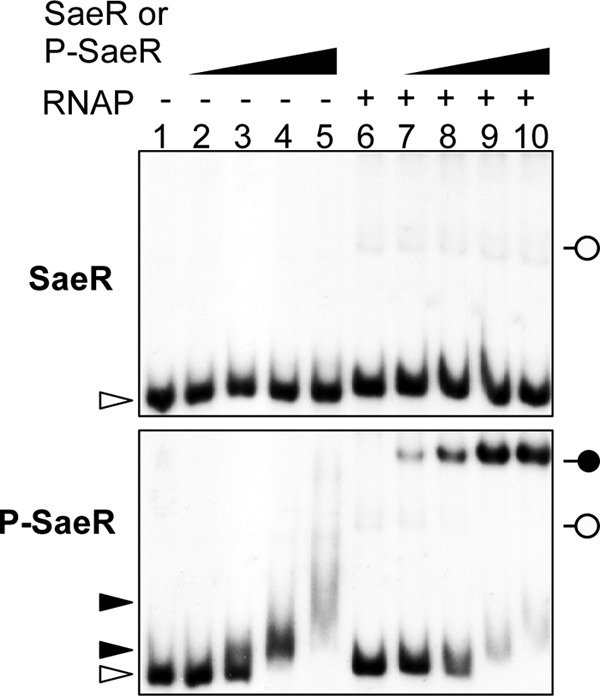
RNAP requires P-SaeR for efficient binding to P1. The P1 probe labeled with 32P was mixed with RNAP (0.7 μg) and increasing amounts of either unphosphorylated SaeR (SaeR) or phosphorylated SaeR (P-SaeR). Lanes 1 and 6, no SaeR proteins; lanes 2 and 7, 62.5 nM; lanes 3 and 8, 125 nM; lanes 4 and 9, 250 nM; lanes 5 and 10, 500 nM. The mixtures were incubated for 15 min at room temperature and then loaded onto a 5% polyacrylamide gel. The white arrowheads indicate free DNA probe, while black arrowheads denote DNA probes bound to P-SaeR. The white pinheads indicate possible P1-RNAP complexes, while the black pinhead depicts the ternary complex of P1, P-SaeR, and RNAP.
RNAP can bind to the alpha-hemolysin promoter without P-SaeR.
Unlike P1 or Pcoa, the alpha-hemolysin promoter (Phla) has only one binding site and a relatively large spacing, 22 bp, between the SaeR binding site and the −35 region (Fig. 1). In addition, for transcription initiation, Phla requires a lower concentration of P-SaeR than P1 or Pcoa does (31, 39). Nevertheless, we observed that all of the promoters bound to P-SaeR with similar affinities under in vitro conditions (Fig. 7A) and required SaeR for their activity (Fig. 7B). To examine whether P-SaeR plays a distinct role in Phla transcription, we repeated the RNAP binding assay with this promoter. Surprisingly, although RNAP bound to P1 and Pcoa only in the presence of P-SaeR, RNAP bound to Phla even in the absence of P-SaeR (lane 3 of Phla in Fig. 7C). The presence of P-SaeR increased RNAP binding to P1 2-fold (compare lanes 3 and 4 of Phla in Fig. 7C). These results suggest that RNAP can bind to Phla without P-SaeR and that P-SaeR further accelerates the binding of RNAP to Phla.
Fig 7.

RNAP can bind to Phla without P-SaeR. (A) SaeR binding of the three target promoters. Promoters (2 ng) labeled with 32P were mixed with 3 μg/ml salmon sperm DNA and 0 μM, 0.25 μM, 0.5 μM, 1 μM, 2 μM, 4 μM, or 8 μM P-SaeR (lanes 1 to 7); incubated at room temperature for 15 min; and analyzed by 5% PAGE and autoradiography. The white arrowhead indicates free probes. (B) Dependence of the three sae target promoters on the SaeRS TCS. Promoter-lacZ fusion plasmids were inserted into WT or saeR mutant strain Newman, and then promoter activity was measured by lacZ expression. saeR, saeR mutant. Data are representative of results obtained from three independent experiments. Error bars represent standard deviations. (C) Binding of RNAP to the three target promoters. DNA probes were mixed with RNAP (0.7 μg) and/or P-SaeR (0.5 μM), incubated for 15 min at room temperature, and then analyzed by 5% PAGE and autoradiography. The white and black arrowheads indicate free and P-SaeR-bound probes, respectively. The white pinhead denotes the DNA probe-RNAP complex, and the black pinhead represents the DNA probe–P-SaeR–RNAP ternary complex. The percentage of DNA probe in the protein-DNA complex is shown at the bottom.
In P1 and Pcoa, alteration of the spacing between promoter elements abolishes promoter activities.
The spacing between the −35 and −10 promoter elements in P1 and Pcoa is 18 bp and 16 bp, respectively, and deviates from the optimal spacing of 17 bp. Recently, Reynolds and Wigneshweraraj reported that when the 20-bp spacing of the agr P3 promoter was reduced to 17 bp, the resulting mutant promoter showed improved promoter activity (45). To examine whether the spacing between promoter elements plays any role in SaeR-mediated transcriptional activation, we altered the spacing of both promoters to 17 bp (P1−1 and Pcoa+1 in Fig. 8A) and measured the resulting promoter activity by using lacZ reporter assays. As shown in Fig. 8B and C, the mutations almost abolished the promoter activity of P1 and Pcoa in both the Newman and USA300-P23 backgrounds. Importantly, those mutant promoters did not respond to induction by HNP-1, suggesting that in P1 and Pcoa, the spacing of the promoter elements is required for their SaeR-mediated transcriptional activation.
Fig 8.
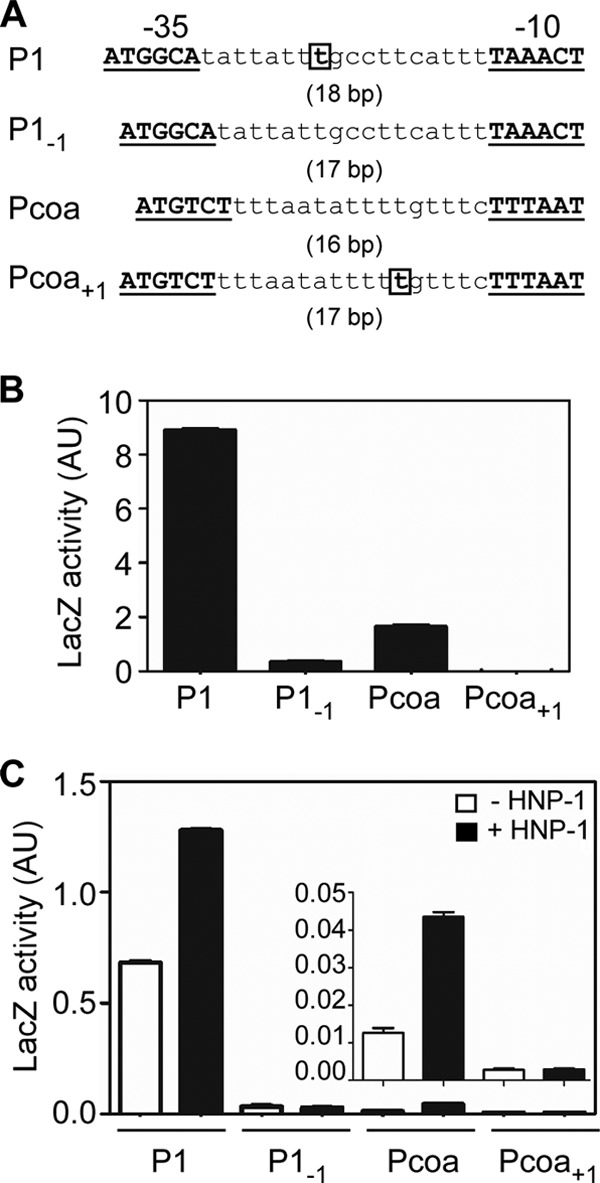
In P1 and Pcoa, alteration of the spacing between promoter elements abolishes promoter activity. (A) Promoters with altered spacing between the promoter elements. The nucleotides either deleted (in P1) or inserted (in Pcoa) are in boldface and boxed. The spacing of each promoter is shown in parentheses. (B and C) In vivo activities of the WT and mutant promoters, measured by promoter-lacZ reporter assay, in the background of strains Newman (B) and USA300 (C). Since Pcoa activity was very low in the USA300 background, a magnified graph image is shown for Pcoa above the original graph. Data are representative of results from three independent experiments. Error bars denote standard deviations.
DISCUSSION
The importance of the SaeRS TCS in staphylococcal pathogenesis has been well recognized. It can affect the expression of more than 200 genes and is required for bacterial survival in mouse models and human blood (52). Not surprisingly, the binding sequence for SaeR has been identified in more than 130 genes (43, 50). However, it has not been clear why only some of the more than 130 genes are regulated by the TCS. In this study, using RNAP purified from S. aureus RN4220 and the sae P1 promoter, we investigated various organizational requirements of SaeR binding sites, as well as the role of SaeR in transcription activation. Although our study focused mainly on the sae P1 promoter, the results of this study can probably be applied to other sae targets and assist in identifying genuine targets of the SaeRS TCS.
When two SaeR binding sites are present, both sites appear to be essential for SaeR binding and transcription activation. In P1, when either the primary or the secondary binding site was eliminated by mutation, the resulting promoter failed to effectively initiate transcription under both in vitro and in vivo conditions (Fig. 2 and 3). SaeR binding to those two binding sites might be cooperative. Mutant P1 with only one binding site did not show the supershifted bands, an indicator of multiple bindings of P-SaeR, and reduced the affinity for P-SaeR (compare lanes 5 of WT and M1 with those of M2 and M3 in Fig. 2B). When we assume that P-SaeR binds to DNA as a dimer, the disappearance of the supershifted band might indicate the loss of dimer-dimer interactions. When the SaeR binding sites were placed on opposite sides of the DNA helix, the resulting mutant P1 promoters showed greatly reduced SaeR binding and transcription activities (+5 and +15 in Fig. 4B to E), suggesting that P-SaeR molecules need to be on the same side of the DNA helix for efficient protein-protein interactions. This notion is further corroborated by the finding that the 10-bp insertion mutant form of P1 showed normal SaeR binding and retained a significant level of in vivo promoter activity (40% of the WT level) (+10 in Fig. 4). On the other hand, when a 20-bp sequence was inserted, the resulting mutant P1 lost both the P-SaeR binding and promoter activities in the Newman background (+20 in Fig. 4B to D), implying that the distance imposed by the 20-bp insertion (∼6.8 nm in the B-form DNA helix) might be prohibitive for P-SaeR protein-protein interactions. Since a single SaeR binding site alone cannot activate transcription at P1 (M2 and M3 in Fig. 2C), the occupation of both binding sites by P-SaeR seems to be essential for the interaction with RNAP and subsequent transcription initiation (Fig. 6 and 7). Certainly, further research is required to examine whether P-SaeR binds to DNA as a dimer and whether the protein-protein interactions of P-SaeR are cooperative.
Depending on the locations of their DNA binding sites in the promoter region, transcription factors activate transcription by different mechanisms. For promoters whose transcription is activated by a single transcription factor, three mechanisms have been suggested, class I and II activation and activation by conformation change (6, 16). In class I activation, the binding site is located upstream of the −35 region and the bound transcription factor recruits RNAP by interaction with αCTD of RNAP (16, 54, 55). In class II activation, the binding site overlaps the −35 region and the bound transcription activator can interact with various components of RNAP (i.e., αCTD, αNTD, and sigma factor), recruiting RNAP and activating the conversion from a closed to an open RNAP complex (8, 14, 35, 53). In activation by conformation change, the transcription activator most often binds to near promoter elements and elicits conformational changes in the promoter region, resulting in enhanced interaction of the region with RNAP (5, 28). Since, in Phla, the SaeR binding site resides 22 bp upstream of the −35 region, Phla seems to be a class I promoter and P-SaeR probably interacts with αCTD and recruits RNAP to the promoter. Indeed, the presence of P-SaeR enhanced the binding of RNAP to Phla (Phla in Fig. 7C). Interestingly, however, RNAP appears to be able to bind to Phla without P-SaeR at least under in vitro conditions (Phla in Fig, 7C, lane 3). Since the presence of P-SaeR is essential for transcription from Phla (39), the results suggest that RNAP bound to Phla cannot initiate transcription without P-SaeR. Therefore, in Phla, P-SaeR seems to play at least two roles, (i) further recruitment of RNAP to Phla and (ii) assistance with transcription initiation, possibly by repositioning of RNAP in Phla. On the other hand, because the SaeR binding sites overlap the −35 region by 1 bp (Fig. 1), P1 and Pcoa resemble class II promoters. In those promoters, P-SaeR is expected to activate transcription by interacting with sigma factor, αNTD, or αCTD.
Several studies have suggested that certain transcription activators and RNAP need to be on the same side of the DNA helix for their interactions and subsequent transcription activation (40, 49, 51, 55). The cyclic AMP receptor protein (CRP), a DNA binding protein, regulates the transcription of a large number of genes by directly interacting with RNAP (7, 12). With the lac promoter, where the CRP binding site is located at −61.5 bp from the TSS, Mandecki and Caruthers showed that while a 5-bp insertion between the CRP binding site and the −35 promoter region abolished transcription activation, an 11-bp insertion partially restored activation (40). Indeed, CRP and FNR, another well-studied transcription factor, can activate transcription when their binding sites are positioned −41.5 bp, −61.5 bp, −72.5 bp, 82.5 bp, or 92.5 bp from the TSS (16, 40, 49, 51, 55). In the P1 promoter, where the center of the SaeR binding site is at −40.5 bp, when the position of the SaeR binding site was altered to −45.5 (5-bp insertion), −50.5 (10-bp insertion), or −62.5 (22-bp insertion), only mutant P1 with the SaeR binding site at −62.5 showed significant SaeR-mediated transcription activation (22T in Fig. 5B), suggesting that, for successful transcription activation, SaeR might also need to be on the same side of the DNA helix as RNAP. Noteworthy is that, like CRP and FNR (55), SaeR failed to activate transcription at the P1 mutant, where the SaeR binding site resides at the −50.5-bp position, suggesting that positioning P-SaeR and RNAP on the same side of the DNA helix is not sufficient and that a certain minimum distance is also required for efficient interaction between P-SaeR and αCTD.
Recently, staphylococcal RNAP has been purified and used to study the molecular mechanism of transcription regulators (44, 45). Reynolds and Wigneshweraraj purified core RNAP from S. aureus NCTC 8325 by affinity chromatography and formed a holoenzyme by adding the vegetative sigma factor σA that was expressed and purified from E. coli (45). On the other hand, Reyes et al. attached a His10 tag sequence to the C terminus of rpoC, the gene encoding the RNAP β′ subunit, and purified RNAP from a sarA agrA sarR triple mutant of S. aureus SH1000, a σB-positive strain, by Ni column chromatography (30, 44). As Reyes et al. did, we also attached a His10 tag sequence at the C terminus of the RNAP β′ subunit (rpoC, NWMN_0505) and purified RNAP by Ni column chromatography from S. aureus strain RN4220, a strain derived from the 8325-4 (= RN0450) (29). Since strain RN4220 contains inactive σB (4), the majority of the sigma factors in the purified RNAP holoenzymes are expected to be σA (rpoD, NWMN_1464). In fact, MS analysis confirmed that the 51-kDa protein in purified RNAP is σA (Fig. 3A). Interestingly, despite its higher molecular mass, the band intensity of σA was lower than that of the RNAP α subunit, implying that a significant portion of the purified RNAPs are core enzymes without a sigma factor. Since S. aureus has two additional alternative sigma factors, σH (23 kDa) and σS (19 kDa) (41, 46), we cannot exclude the possibility that a certain portion of the purified RNAP contains one of the alternative sigma factors. However, the absence of protein bands corresponding to those alternative sigma factors in Fig. 3A suggests that the portion of RNAP with those alternative sigma factors, if there is any, will be minor. Nonetheless, the overall agreement of in vitro transcription assays with lacZ reporter assays demonstrates that purified RNAP can be utilized for functional analysis of σA-dependent promoters.
ACKNOWLEDGMENTS
We thank Gary M. Dunny and Christopher M. Johnson at the University of Minnesota for their technical assistance in generating staphylococcal RNAP and conducting in vitro transcription assays. We also thank Olaf Schneewind and Dominique Missiakas at the University of Chicago for providing the saeR transposon mutant.
This study was supported by scientist development grant 0835158N from the American Heart Association and by AI077564 from the National Institute of Allergy and Infectious Diseases.
Footnotes
Published ahead of print 23 March 2012
REFERENCES
- 1. Adhikari RP, Novick RP. 2008. Regulatory organization of the staphylococcal sae locus. Microbiology 154:949–959 [DOI] [PubMed] [Google Scholar]
- 2. Archer GL. 1998. Staphylococcus aureus: a well-armed pathogen. Clin. Infect. Dis. 26:1179–1181 [DOI] [PubMed] [Google Scholar]
- 3. Bae T, Schneewind O. 2006. Allelic replacement in Staphylococcus aureus with inducible counter-selection. Plasmid 55:58–63 [DOI] [PubMed] [Google Scholar]
- 4. Bischoff M, Entenza JM, Giachino P. 2001. Influence of a functional sigB operon on the global regulators sar and agr in Staphylococcus aureus. J. Bacteriol. 183:5171–5179 [DOI] [PMC free article] [PubMed] [Google Scholar]
- 5. Brown NL, Stoyanov JV, Kidd SP, Hobman JL. 2003. The MerR family of transcriptional regulators. FEMS Microbiol. Rev. 27:145–163 [DOI] [PubMed] [Google Scholar]
- 6. Browning DF, Busby SJ. 2004. The regulation of bacterial transcription initiation. Nat. Rev. Microbiol. 2:57–65 [DOI] [PubMed] [Google Scholar]
- 7. Busby S. 1986. Positive regulation in gene expression, p 51–77 In Booth I, Higgins C. (ed), Regulation of gene expression. Cambridge University Press, Cambridge, United Kingdom [Google Scholar]
- 8. Busby S, Ebright RH. 1997. Transcription activation at class II CAP-dependent promoters. Mol. Microbiol. 23:853–859 [DOI] [PubMed] [Google Scholar]
- 9. Cheung AL, Nishina K, Manna AC. 2008. SarA of Staphylococcus aureus binds to the sarA promoter to regulate gene expression. J. Bacteriol. 190:2239–2243 [DOI] [PMC free article] [PubMed] [Google Scholar]
- 10. Chevalier C, et al. 2010. Staphylococcus aureus RNAIII binds to two distant regions of coa mRNA to arrest translation and promote mRNA degradation. PLoS Pathog. 6:e1000809. [DOI] [PMC free article] [PubMed] [Google Scholar]
- 11. Chien Y, Manna AC, Projan SJ, Cheung AL. 1999. SarA, a global regulator of virulence determinants in Staphylococcus aureus, binds to a conserved motif essential for sar-dependent gene regulation. J. Biol. Chem. 274:37169–37176 [DOI] [PubMed] [Google Scholar]
- 12. de Crombrugghe B, Busby S, Buc H. 1984. Cyclic AMP receptor protein: role in transcription activation. Science 224:831–838 [DOI] [PubMed] [Google Scholar]
- 13. Deora R, Tseng T, Misra TK. 1997. Alternative transcription factor sigmaSB of Staphylococcus aureus: characterization and role in transcription of the global regulatory locus sar. J. Bacteriol. 179:6355–6359 [DOI] [PMC free article] [PubMed] [Google Scholar]
- 14. Dove SL, Darst SA, Hochschild A. 2003. Region 4 of sigma as a target for transcription regulation. Mol. Microbiol. 48:863–874 [DOI] [PubMed] [Google Scholar]
- 15. Duthie ES, Lorenz LL. 1952. Staphylococcal coagulase; mode of action and antigenicity. J. Gen. Microbiol. 6:95–107 [DOI] [PubMed] [Google Scholar]
- 16. Ebright RH. 1993. Transcription activation at class I CAP-dependent promoters. Mol. Microbiol. 8:797–802 [DOI] [PubMed] [Google Scholar]
- 17. Foster TJ, Hook M. 1998. Surface protein adhesins of Staphylococcus aureus. Trends Microbiol. 6:484–488 [DOI] [PubMed] [Google Scholar]
- 18. Fournier B, Klier A, Rapoport G. 2001. The two-component system ArlS-ArlR is a regulator of virulence gene expression in Staphylococcus aureus. Mol. Microbiol. 41:247–261 [DOI] [PubMed] [Google Scholar]
- 19. Fujita M, Sadaie Y. 1998. Rapid isolation of RNA polymerase from sporulating cells of Bacillus subtilis. Gene 221:185–190 [DOI] [PubMed] [Google Scholar]
- 20. Gao R, Mack TR, Stock AM. 2007. Bacterial response regulators: versatile regulatory strategies from common domains. Trends Biochem. Sci. 32:225–234 [DOI] [PMC free article] [PubMed] [Google Scholar]
- 21. Geiger T, Goerke C, Mainiero M, Kraus D, Wolz C. 2008. The virulence regulator Sae of Staphylococcus aureus: promoter activities and response to phagocytosis-related signals. J. Bacteriol. 190:3419–3428 [DOI] [PMC free article] [PubMed] [Google Scholar]
- 22. Giraudo AT, Calzolari A, Cataldi AA, Bogni C, Nagel R. 1999. The sae locus of Staphylococcus aureus encodes a two-component regulatory system. FEMS Microbiol. Lett. 177:15–22 [DOI] [PubMed] [Google Scholar]
- 23. Giraudo AT, Cheung AL, Nagel R. 1997. The sae locus of Staphylococcus aureus controls exoprotein synthesis at the transcriptional level. Arch. Microbiol. 168:53–58 [DOI] [PubMed] [Google Scholar]
- 24. Giraudo AT, Rampone H, Calzolari A, Nagel R. 1996. Phenotypic characterization and virulence of a sae- agr- mutant of Staphylococcus aureus. Can. J. Microbiol. 42:120–123 [DOI] [PubMed] [Google Scholar]
- 25. Giraudo AT, Raspanti CG, Calzolari A, Nagel R. 1994. Characterization of a Tn551-mutant of Staphylococcus aureus defective in the production of several exoproteins. Can. J. Microbiol. 40:677–681 [DOI] [PubMed] [Google Scholar]
- 26. Hanahan D. 1983. Studies on transformation of Escherichia coli with plasmids. J. Mol. Biol. 166:557–580 [DOI] [PubMed] [Google Scholar]
- 27. Harraghy N, et al. 2005. sae is essential for expression of the staphylococcal adhesins Eap and Emp. Microbiology 151:1789–1800 [DOI] [PubMed] [Google Scholar]
- 28. Heldwein EE, Brennan RG. 2001. Crystal structure of the transcription activator BmrR bound to DNA and a drug. Nature 409:378–382 [DOI] [PubMed] [Google Scholar]
- 29. Herbert S, et al. 2010. Repair of global regulators in Staphylococcus aureus 8325 and comparative analysis with other clinical isolates. Infect. Immun. 78:2877–2889 [DOI] [PMC free article] [PubMed] [Google Scholar]
- 30. Horsburgh MJ, et al. 2002. sigmaB modulates virulence determinant expression and stress resistance: characterization of a functional rsbU strain derived from Staphylococcus aureus 8325-4. J. Bacteriol. 184:5457–5467 [DOI] [PMC free article] [PubMed] [Google Scholar]
- 31. Jeong DW, et al. 2011. Identification of the P3 promoter and distinct roles of the two promoters of the SaeRS two-component system in Staphylococcus aureus. J. Bacteriol. 193:4672–4684 [DOI] [PMC free article] [PubMed] [Google Scholar]
- 32. Kraemer GR, Iandolo JJ. 1990. High-frequency transformation of Staphylococcus aureus by electroporation. Curr. Microbiol. 21:373–376 [Google Scholar]
- 33. Kreiswirth BN, et al. 1983. The toxic shock syndrome exotoxin structural gene is not detectably transmitted by a prophage. Nature 305:709–712 [DOI] [PubMed] [Google Scholar]
- 34. Kuroda M, et al. 2003. Two-component system VraSR positively modulates the regulation of cell-wall biosynthesis pathway in Staphylococcus aureus. Mol. Microbiol. 49:807–821 [DOI] [PubMed] [Google Scholar]
- 35. Li M, Moyle H, Susskind MM. 1994. Target of the transcriptional activation function of phage lambda cI protein. Science 263:75–77 [DOI] [PubMed] [Google Scholar]
- 36. Liang X, et al. 2006. Inactivation of a two-component signal transduction system, SaeRS, eliminates adherence and attenuates virulence of Staphylococcus aureus. Infect. Immun. 74:4655–4665 [DOI] [PMC free article] [PubMed] [Google Scholar]
- 37. Lowy FD. 1998. Staphylococcus aureus infections. N. Engl. J. Med. 339:520–532 [DOI] [PubMed] [Google Scholar]
- 38. Luong TT, Newell SW, Lee CY. 2003. Mgr, a novel global regulator in Staphylococcus aureus. J. Bacteriol. 185:3703–3710 [DOI] [PMC free article] [PubMed] [Google Scholar]
- 39. Mainiero M, et al. 2010. Differential target gene activation by the Staphylococcus aureus two-component system saeRS. J. Bacteriol. 192:613–623 [DOI] [PMC free article] [PubMed] [Google Scholar]
- 40. Mandecki W, Caruthers MH. 1984. Mutants of the lac promoter with large insertions and deletions between the CAP binding site and the −35 region. Gene 31:263–267 [DOI] [PubMed] [Google Scholar]
- 41. Morikawa K, et al. 2003. A new staphylococcal sigma factor in the conserved gene cassette: functional significance and implication for the evolutionary processes. Genes Cells. 8:699–712 [DOI] [PubMed] [Google Scholar]
- 42. Novick RP. 2003. Autoinduction and signal transduction in the regulation of staphylococcal virulence. Mol. Microbiol. 48:1429–1449 [DOI] [PubMed] [Google Scholar]
- 43. Nygaard TK, et al. 2010. SaeR binds a consensus sequence within virulence gene promoters to advance USA300 pathogenesis. J. Infect. Dis. 201:241–254 [DOI] [PMC free article] [PubMed] [Google Scholar]
- 44. Reyes D, et al. 2011. Coordinated regulation by AgrA, SarA, and SarR to control agr expression in Staphylococcus aureus. J. Bacteriol. 193:6020–6031 [DOI] [PMC free article] [PubMed] [Google Scholar]
- 45. Reynolds J, Wigneshweraraj S. 2011. Molecular insights into the control of transcription initiation at the Staphylococcus aureus agr operon. J. Mol. Biol. 412:862–881 [DOI] [PubMed] [Google Scholar]
- 46. Shaw LN, et al. 2008. Identification and characterization of sigma, a novel component of the Staphylococcus aureus stress and virulence responses. PLoS One 3:e3844. [DOI] [PMC free article] [PubMed] [Google Scholar]
- 47. Steinhuber A, Goerke C, Bayer MG, Doring G, Wolz C. 2003. Molecular architecture of the regulatory locus sae of Staphylococcus aureus and its impact on expression of virulence factors. J. Bacteriol. 185:6278–6286 [DOI] [PMC free article] [PubMed] [Google Scholar]
- 48. Stock AM, Robinson VL, Goudreau PN. 2000. Two-component signal transduction. Annu. Rev. Biochem. 69:183–215 [DOI] [PubMed] [Google Scholar]
- 49. Straney DC, Straney SB, Crothers DM. 1989. Synergy between Escherichia coli CAP protein and RNA polymerase in the lac promoter open complex. J. Mol. Biol. 206:41–57 [DOI] [PubMed] [Google Scholar]
- 50. Sun F, et al. 2010. In the Staphylococcus aureus two-component system sae, the response regulator SaeR binds to a direct repeat sequence and DNA binding requires phosphorylation by the sensor kinase SaeS. J. Bacteriol. 192:2111–2127 [DOI] [PMC free article] [PubMed] [Google Scholar]
- 51. Ushida C, Aiba H. 1990. Helical phase dependent action of CRP: effect of the distance between the CRP site and the −35 region on promoter activity. Nucleic Acids Res. 18:6325–6330 [DOI] [PMC free article] [PubMed] [Google Scholar]
- 52. Voyich JM, et al. 2009. The SaeR/S gene regulatory system is essential for innate immune evasion by Staphylococcus aureus. J. Infect. Dis. 199:1698–1706 [DOI] [PMC free article] [PubMed] [Google Scholar]
- 53. West D, et al. 1993. Interactions between the Escherichia coli cyclic AMP receptor protein and RNA polymerase at class II promoters. Mol. Microbiol. 10:789–797 [DOI] [PubMed] [Google Scholar]
- 54. Williams SM, Savery NJ, Busby SJ, Wing HJ. 1997. Transcription activation at class I FNR-dependent promoters: identification of the activating surface of FNR and the corresponding contact site in the C-terminal domain of the RNA polymerase alpha subunit. Nucleic Acids Res. 25:4028–4034 [DOI] [PMC free article] [PubMed] [Google Scholar]
- 55. Wing HJ, Williams SM, Busby SJ. 1995. Spacing requirements for transcription activation by Escherichia coli FNR protein. J. Bacteriol. 177:6704–6710 [DOI] [PMC free article] [PubMed] [Google Scholar]