

Abstract
How chromatin folds into mitotic and interphase chromosomes has remained a difficult question for many years. We have used three generations of engineered chromosome regions as a means of visualizing specific chromosome regions in live cells and cells fixed under conditions which preserve large-scale chromatin structure. Our results confirm the existence of large-scale chromatin domains and fibers formed by the folding of 10 and 30 nm chromatin fibers into larger, spatially distinct domains. Transcription at levels within several fold of the levels measured for endogenous loci occur within these large-scale chromatin structures on a condensed template linearly compacted several hundred fold to one thousand fold relative to B-form DNA. However, transcriptional induction is accompanied by a several fold decondensation of this large-scale chromatin structure that propagates hundreds of kb beyond the induced gene. Examination of engineered chromosome regions in mouse ES and differentiated cells suggests a surprising degree of plasticity in this large-scale chromatin structure, allowing long-range DNA interactions within the context of large-scale chromatin fibers. Recapitulation of gene specific differences in large-scale chromatin conformation and nuclear positioning using these engineered chromosome regions will facilitate identification of cis and trans determinants of interphase chromosome architecture.
Introduction
An intimate, functional relationship has been demonstrated between local chromatin structure, the spacing and modifications of nucleosomes, and transcriptional regulation (Cairns 2009; Campos and Reinberg 2009; Ho and Crabtree 2010). In contrast, while strong correlations between higher levels of chromatin folding and transcription have existed for decades (Igo-Kemenes et al. 1982; Belmont et al. 1999; Mahy et al. 2000; Cremer et al. 2006; Schneider and Grosschedl 2007; Dillon 2008; de Wit and van Steensel 2009), direct functional relationships between higher levels of chromatin folding and transcription, let alone productive paths for mechanistic dissection of these relationships, have not yet been established.
Similarly, while we have detailed information concerning the structure of nucleosomes and their positioning along the interphase chromosome, our knowledge of higher levels of chromatin structure remains incomplete, as demonstrated by widely varying models of higher order chromatin folding. The “Loop/Scaffold” model (Fig. 1A), postulates DNA loops, ~100 kb in size, anchored to a chromosome or nuclear scaffold by SAR/MAR or boundary element sequences to form independent chromatin domains (Igo-Kemenes et al. 1982; Elgin 1990). These loops provide an explanation for how enhancer activity on distant promoters might be limited or how cis sequences such as locus control regions (LCRs) might decondense an entire domain independent of its neighbor. The “Chromatin Hub” model, based largely on new chromosome conformation capture (3C) derived methods, instead points to multiple, close interactions by a number of different cis elements, including boundary elements, LCRs, enhancers and promoters; prominent looping interactions would bring together elements separated by just several kb, as well as distant elements separated by 100s of kb to many Mbp or even sequences on different chromosomes (de Laat and Grosveld 2003; Cope et al. 2010; Williams et al. 2010). The “Chromonema” model proposes the folding of 10 and 30 nm chromatin fibers into large-scale chromatin fibers ~100 nm in diameter (Belmont et al. 1989; Belmont and Bruce 1994; Kireeva et al. 2004; Kireev et al. 2008) with compaction ratios of roughly ~1000:1, or ~25 fold higher than the 30 nm chromatin fiber (Tumbar et al. 1999; Hu et al. 2009). In this model, transcription occurs within the context of these large-scale chromatin fibers with transcriptional activation associated with a straightening and extension of these fibers (Tumbar et al. 1999; Hu et al. 2009). All of these models are based on extensive but different experimental approaches, and all contain features that in some cases overlap, but in other cases contradict, predictions of competing models.
Figure 1. Higher-order chromatin folding models (left) and changes associated with transcriptional activation (right).

(A) Chromatin domain/loop model postulates loops of chromatin anchored by a nuclear matrix with decondensation from 30 nm chromatin fiber to 10 nm nucleofilament accompanying activation. (B) Chromatin hub postulates a 3D conformation is created by interactions between distant cis regulatory elements; changes in transcriptional activation may depend on which cis elements contribute to this hub. (C) Chromonema model postulates folding of chromatin into large-scale chromatin fibers. Transcription is accompanied by a decondensation, elongation, and straightening of these fibers but still occurs within the context of highly condensed chromatin.
Regardless of the actual details of higher order chromatin folding, several strong correlations have emerged between transcriptional regulation and folding of interphase chromosomes within the nucleus: (1) A more decondensed conformation and a more internal position relative to the nuclear periphery is seen for gene rich versus gene poor chromosome territories (Croft et al. 1999), subterritories (Goetze et al. 2007), or even gene loci (Zink et al. 2004; Shopland et al. 2006); (2) A preferential positioning of genes on the chromosome territory is observed with high level transcriptional activation of gene loci, accompanied in some cases by protrusion of several Mbp size loops outside of the chromosome territory (Volpi et al. 2000; Chambeyron and Bickmore 2004); (3) A preferential association of active genes with nuclear bodies such as nuclear speckles or transcription factories (Smith et al. 1999; Shopland et al. 2003; Osborne et al. 2004; Cope et al. 2010); (4) spatial segregation of gene rich versus gene poor chromosome regions, with association of like regions in cis and trans, possibly mediated by co-association with common nuclear compartments (Shopland et al. 2006; Lieberman-Aiden et al. 2009).
An improved understanding of the relationship between these higher levels of chromatin organization and transcriptional regulation is critical to future progress on fundamental questions in gene regulation and epigenetic research. We need to replace our current cartoon depictions of large-scale chromatin organization with real, high-resolution structures of specific gene loci. We also need experimental methodologies that will allow us to move beyond our current phenomenological, descriptive studies. Here a major problem is scale. We need experimental systems in which we can reconstitute higher levels of folding while simplifying the DNA sequence complexity to allow dissection of cis and trans determinants.
Demonstration of large-scale chromatin folding
Traditional transmission electron microscopy (TEM) of heavy metal stained, plastic thin sections of eukaryotic nuclei led to the now deeply engrained concept of two distinct types of chromatin- highly condensed, transcriptionally inactive “heterochromatin” concentrated near the nuclear periphery and surrounding nucleoli and decondensed, transcriptionally active “euchromatin” dispersed uniformly through the nuclear interior. In contrast, early chromosome FISH paints suggested interphase chromosomes as contiguous, chromatin dense territories with little space within for diffusion of large macromolecular complexes.
In retrospect, both of the above interpretations were questionable in light of the technical limitations of the experimental approaches used. The heavy metal staining of conventional electron microscopy is not DNA specific, or even nuclei acid specific. In an elegant experiment, polytene chromosomes were pelleted by centrifugation to the bottom of nuclei, yet the nucleoplasmic region devoid of chromosomes still showed the same “euchromatic” texture (Skaer and Whytock 1977). In contrast, while the chromosome FISH paints provided specificity, the early protocols for FISH (fluorescence in situ hybridization), together with limitations of conventional light microscopy, produced significant structural perturbation and “blurring” of chromosomal substructure. More recent FISH protocols have revealed significant intra-chromosome territory substructure (Cremer and Cremer 2001).
A completely different view of nuclear genome organization was obtained more than 20 years ago by using live cell imaging with a DNA specific stain (Belmont et al. 1989). Instead of the binary “heterochromatin”/“euchromatin” division suggested by electron microscopy, a more uniform chromatin texture throughout the nucleus was seen by live cell microscopy (Fig. 2A), consistent with packing of chromatin into large-scale chromatin domains. Using buffers that preserved chromosome and nuclear morphology similar to that observed in live cells by light microscopy, and by electron microscopy in nonpermeabilized cells fixed directly, higher-order chromatin structural domains were seen in detergent permeabilized cells with diameters ranging from ~60–200 nm (Fig. 2B). In selected regions of both the light and electron microscopy images, linear fiber segments can be seen, suggestive of a fibrillar nature to this large-scale chromatin structure, at least in some regions. EM tomography showed these domains were formed by the organized folding of 100s–1000s kb DNA regions (Fig. 2C).
Figure 2. Genome organization is dominated by folding of chromatin into large-scale chromatin domains.

(A) Hela cells imaged live by deconvolution light microscopy using Hoescht DNA staining. (B) TEM image of Hela cell nucleus in permeabilized cell reveals large-scale chromatin domains with heavy metal staining. Scale bar 500 nm. (C) Computational slice from EM tomography reconstruction reveals large-scale chromatin fiber-like domains formed by the folding of 10 and 30 nm chromatin corresponding to 100s–1000s kb of DNA. Scale bar 200 nm. (D) Similar large-scale chromatin organization is visualized by TEM energy-loss imaging of the phosphorus distribution within cells fixed directly without permeabilization (image courtesy of Michael Hendzel, University of Alberta).
Follow-up experiments using serial thin section TEM suggested a model in which mitotic chromosome condensation occurs through hierarchical folding and compaction of these large-scale chromatin domains (Belmont and Bruce 1994; Kireeva et al. 2004). In these studies we used the trick of detergent permeabilization to extract the nucleoplasmic sap and reduce the nuclear background created by nonspecific heavy metal staining normally seen in nonpermeabilized cells by conventional TEM. However, we also showed that minor changes in polyvalent cation concentrations could produce dramatic unfolding or hypercondensation of these large-scale chromatin domains. Importantly, independent approaches avoiding these extraction conditions have produced convergent results. Subsequent live cell imaging of cells expressing GFP-histone have produced similar light microscopy images suggestive of large-scale chromatin organization to the Hoescht stained live cell microscopy we previously employed. Meanwhile, at least three independent TEM staining methods applied to cells fixed directly without any prior permeabilization have produced strikingly similar visualization of large-scale chromatin domains to our results using permeabilized cells. This includes post-embedding anti-DNA immunostaining (Bohrmann and Kellenberger 1994), the NAMA staining protocol using heavy metals (Testillano et al. 1991), use of the DNA specific osmium amine stain (Olins et al. 1989), and energy loss ratio imaging to visualize the phosphorus versus nitrogen signals from unstained sections (Fig. 2D) (Bazett-Jones and Hendzel 1999).
Two major conclusions are derived from this work. First, the fraction of the nuclear volume occupied by chromatin is small in typical nuclei, in contrast to initial impressions from early DNA FISH chromosome paints, but consistent with calculations of the total nucleosome volume expected per genome. Second, the vast majority of the genome is packaged into large-scale chromatin structures, at least in the typical cell lines and cell types where this has been examined.
Therefore the details of how chromatin folds into these large-scale chromatin structures, how these structures are positioned relative to the overall chromosome territory, and how these large-scale chromatin structures and positioned relative to specific nuclear compartments are significant questions to address. In particular, we are interested in how large-scale chromatin structure may change to accommodate DNA replication, transcription, repair, and recombination, and the functional impact of packaging chromatin into these structures with regard to regulation of these processes are significant questions to address.
Strategic Approach to Investigation of Large-scale Chromatin Structure
Previous labeling and imaging technology prevented direct visualization of the ultrastructure and dynamics of endogenous genes. In particular, 3D FISH is incompatible with live cell imaging and destroys chromosomal and nuclear ultrastructure (Solovei et al. 2002). Our goals were first to develop a tagging system by which a specific chromosome locus could be identified while preserving structure. In our earlier work, we had demonstrated that mammalian chromosomes in somatic cells showed highly nonsynchronous condensation and decondensation through the cell cycle. Therefore we also wanted the ability to engineer entire chromosome regions to show uniform compaction properties to facilitate structural analysis. We wanted this labeling technology to be applicable to live cell imaging in order to allow direct visualization of large-scale chromatin dynamics, but we also wanted to then fix the cells and visualize the ultrastructure of these same labeled chromosome regions. Finally, we wanted to be able to extend this approach from analysis of chromosome regions to visualization of endogenous, single copy gene loci. One particular goal has been to visualize the changes in large-scale chromatin ultrastructure accompanying transcriptional activation.
Of course, working with engineered chromosome regions there is always the caveat that the large-scale chromatin folding of chromosome regions might differ from native chromosomes. Even tagging of endogenous gene loci could perturb the chromatin folding of these loci. Therefore we have progressed through three generations of engineered chromosome regions with the aim of moving closer to reproducing the large-scale chromatin structure of endogenous chromosomes.
At the same time, the use of engineered chromosome regions provides a potentially powerful route towards exploring cis and trans determinants of large-scale chromatin organization. A major challenge to understanding the large-scale chromatin organization of endogenous chromosomes is simply the size scale involved, which for example in mammalian chromosomes may involve structural motifs extending from 100s of kb to tens of Mbp. Engineered chromosome regions built from multiple copies of smaller genomic regions allows application of a reductionist approach to dissect the principles underlying the self-assembly of large chromosome regions.
Three generations of engineered chromosome regions
To implement our goal of developing a chromosome labeling method which preserved native chromosome structure, we developed an approach based on protein-DNA recognition using the lac operator/lac repressor system (Robinett et al. 1996). A single 256mer lac operator direct repeat produced a detectable signal in Chinese Hamster Ovary (CHO) cells stably expressing GFP-lac repressor. However, while a single insertion is sufficient to localize a gene locus, it does not reveal the large-scale chromatin conformation of this locus. As our first generation approach, we therefore used gene amplification in DHFR minus CHO DG44 cells using a DHFR cDNA mini-gene tagged with the 256mer lac operator repeat. DG44 cells with stable insertions of the DHFR plasmid were subjected to multiple rounds of methotrexate selection, producing homogeneously stained regions (HSRs) from several to ~100 Mbp in size containing multiple copies of the plasmid insertion flanked by 100s–1000s of kb of co-amplified genomic DNA.
Importantly, these gene amplified chromosome regions showed characteristic large-scale chromatin conformations particular to specific cell clones, due to differences in co-amplified DNA sequences. These conformations ranged from unusually condensed, heterochromatic bodies (Fig. 3A) to more extended structures typical of surrounding euchromatin (Fig. 3B) (Li et al. 1998; Dietzel and Belmont 2001; Verschure et al. 2005; Kireev et al. 2008). An advantage of this approach was that the characteristic large-scale chromatin conformation of these amplified chromosome regions was stable for each particular cell clone. A major disadvantage, however, was that the size and chromosome location of these amplified chromosome regions generally were unstable.
Figure 3. Three generations of engineered chromosome regions.
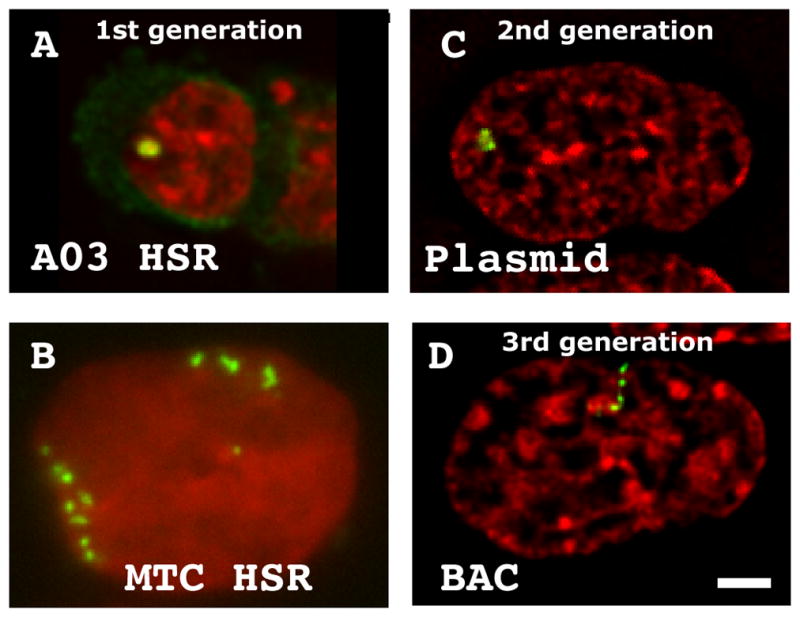
(A–B) Gene amplication produces both condensed (A) and extended (B) amplified chromosome regions. (C) Multi-copy plasmid insertions form condensed, hetereochromatic masses. (D) Multi-copy insertion of BACs containing active gene loci form extended large-scale chromatin conformations typical of surrounding, endogenous chromatin. DAPI (red), GFP-lac repressor (green). Scale bar = 2 μm.
As a second-generation method, we therefore turned to selecting cell lines with multi-copy insertions of a plasmid carrying anywhere from 32–256 copies of the lac operator direct repeat (Strukov et al. 2003; Dietzel et al. 2004). Insertions with hundreds to thousands of plasmid copies produced large, tagged chromosomal regions. The advantage of this second generation approach was that the location and size of the plasmid insertions were highly stable over time in culture. However, the major disadvantage of this approach was that these multi-copy plasmid insertions in mammalian cells nearly invariably form unusually condensed, heterochromatic structures (Fig. 3C). The exceptions are cell clones in which the plasmid copies recombine with genomic DNA such that insertions are spaced by large regions of genomic DNA.
Previous work has demonstrated transgene silencing of multi-copy plasmid insertions, which likely is related to their observed heterochromatin conformation. In contrast, bacterial artificial chromosomes (BACs) carrying 100–300 kb genomic DNA inserts typically show transgene expression levels within several fold of the expression levels of endogenous genes. We hypothesized that this improved gene expression would correlate with a more normal large-scale chromatin structure. Therefore for our third-generation approach, we are using multi-copy insertions of BAC transgenes retrofitted with the 256mer lac operator repeat plus a selectable marker (Hu et al. 2009). This BAC approach combines advantages of both the preceding approaches- sequence specific large-scale chromatin conformation and nuclear positioning mirroring behavior of endogenous gene loci combined with genomic stability of the BAC transgene repeat. For active gene regions a large-scale chromatin conformation similar to surrounding endogenous euchromatin is observed (Fig. 3C) (Kireev et al. 2008; Hu et al. 2009).
Transcription in Tight Places
With these three generations of engineered chromosomal regions, we asked what changes in large-scale chromatin structure might be associated with transcriptional activation. Using the 1st generation approach, we tethered transcription activators using lac repressor fusion proteins to the lac operator repeats within gene amplified chromosome regions to ask whether transcriptional activators also recruit factors capable of decondensing large-scale chromatin structure. We observed dramatic straightening and extension of large-scale chromatin fibers after targeting the acidic activator VP16 to a heterochromatic HSR (Fig. 4A–B) (Tumbar et al. 1999), with transcription occurring within the context of these large-scale chromatin fibers (Fig. 5A–C). Using this experimental system, similar extension of large-scale chromatin structure has been observed for all acidic activator proteins tested (p53, p65, Gal4, Fos, Hap4), other transcription factors including BRCA1, ER, NELF-B, E2F1, and UBF, the transcription factor/boundary element binding protein CTCF, and DNA replication proteins Cdc45 and Cdk2. Decondensation did not require transcription as transcriptionally inactive acidic activator variants still produced unfolding in this assay.
Figure 4. Large-scale chromatin decondensation accompanies transcriptional activation with long-range spreading of decondensation beyond transcription sites.

(A–B) Condensed, gene amplified array (red) (A) unfolds into extended large-scale chromatin fibers after VP16 tethering (B) (DAPI, blue). Scale bars = 1 μm. (C–D) Multi-copy plasmid array (EGFP-lac repressor, green) with β-globin regulatory elements before (C) and after (D) transcriptional activation (DAPI, blue). (E–F) Multi-copy Hsp70 BAC transgene insertion before (E) and after (F) heat shock activation (EGFP-lac repressor, grey). Decondensation occurs through straightening of large-scale chromatin fibers in (B) and (F) formed by hundreds of kb flanking sites of VP16 tethering (B) or Hsp70 genes (F).
Figure 5. Transcription on a condensed template.

(A–C) Tethering of the VP17 acidic activator using a EGFP-lac repressor-VP16 fusion protein (red) to a heterochromatic amplified chromosome region results in extensive decondensation and extended large-scale chromatin fibers. BrUTP pulse labeling (green) shows large amounts of nascent transcripts surrounding these large-scale chromatin fibers. (D) DHFR multi-copy BAC transgenes assemble into a compact large-scale chromatin fiber despite transcriptional activity within 2–3 fold of the endogenous DHFR gene. Fluorescence in situ hybridization using the entire BAC as a probe (green) versus probes covering the 34 kb DHFR gene (red) reveal the absence of any detectable looping of the DHFR genes outside of these large-scale chromatin fibers. DAPI staining is grey.
The above results demonstrated the capability of transcription factors to recruit activities producing large-scale chromatin decondensation. However, the physiological relevance of these results remained uncertain due to the high levels of activators recruited using this engineered system. We therefore turned next to our 2nd generation system in which we used multi-copy insertions of plasmid transgenes and replaced the use of tethered activator proteins with the incorporation of specific cis regulatory elements into the transgene. A first example involved a mini-LCR sequence combined with a beta-globin enhancer/promoter sequence driving a reporter gene (Fig. 4C–D) (Dietzel et al. 2004). Large-scale decondensation was less than that observed after transcription activator tethering. This could be explained as the outcome of using normal regulatory sequences rather than the tethering of nonphysiological amounts of transcriptional activators. Alternatively, the multi-copy transgene silencing phenomenon associated with these 2nd generation plasmid arrays, which are invariably heterochromatic, may limit the normal physiological response of the incorporated cis regulatory elements.
In mammalian genomes, typical intergenic regions may be 10s–100s of kb in size. The real question is whether activation of individual genes by trans factors binding to cis regulatory elements near these genes can lead to conformational changes in large-scale chromatin structure extending over comparable distances. Using BAC transgene arrays generated with our 3rd generation approach, we observed DHFR, MT, and Hsp70 BAC transgene expression levels within several fold per copy of endogenous genes while packaged in large-scale chromatin fibers condensed well above the 30 nm chromatin fiber (Fig. 4E–F, Fig. 5D) (Hu et al. 2009). Large-scale chromatin fibers had a linear compaction ratio of ~1000:1 (~25 fold above the 40:1 compaction estimated for 30 nm chromatin fibers). No evidence for looping of genes outside of these fibers was observed (Fig. 5D). Transcriptional induction was associated with a global ~1.5–3 fold linear decondensation of large-scale chromatin structures extending over the ~200 kb size of each BAC copy, even after induction of specific genes whose cis regulatory and transcribed regions extend over just ~15 kb (Hsp70) or ~1 kb for the Drosophila metallothionein gene (unpublished).
Interestingly, in each of these three systems, transcriptional activation took place within the context of condensed, large-scale chromatin structures with no evidence for looping outwards of active genes or decondensation of the large-scale chromatin fibers into extended 10 or 30 nm chromatin fibers. Conformational changes in large-scale chromatin structure appear to propagate over large distances surrounding tethered activators (Fig. 4B) or BAC transgenes (Fig. 4F). This propagation might provide an explanation for the transcription “ripple” effect in which activation of immediate early genes can increase expression of neighboring genes within an ~100 kb window (Ebisuya et al. 2008).
Dissecting the relationship between nuclear positioning and transcriptional activation
Strikingly, although our attention in the previous studies was on the relationship between transcriptional activation and large-scale chromatin conformation, we also observed an association between transcriptional activation and change in intranuclear positioning of these engineered chromosome regions. Tethering of acidic activators to a heterochromatic HSR produced a change in location towards the nuclear interior of the normally peripheral HSR (Tumbar et al. 1999). A similar relocalization from the nuclear periphery to the interior was observed after tethering acidic activators to a multi-copy plasmid insertion near a normally peripherally associated chromosome site (Tumbar and Belmont 2001). Likewise transcriptional induction of multicopy plasmid transgenes driven by beta-globin regulatory sequences was associated with a consistent redistribution of transgene arrays towards the nuclear interior (Dietzel et al. 2004). Using an inducible VP16 activator tethering approach, we demonstrated a rapid, apparently directed, long-range movement of a plasmid transgene array towards the nuclear interior after VP16 targeting which was directly or indirectly dependent on actin and nuclear myosin I (Chuang et al. 2006). This movement, restricted to short several minute time intervals, showed speeds ranging from 0.1– 09 μm/min but was interspersed with long periods of relative immobility.
More recently, using the BAC transgene approach, we have demonstrated a gene specific association of Hsp70 BAC transgenes with nuclear speckles, nuclear bodies enriched in RNA processing machinery (Hu et al. 2009). Initial live cell imaging showed three pathways for speckle association: (1) a sudden jump, exceeding 1 μm, to a preexisting speckle; (2) wrapping of the BAC transgenes around a preexisting, nearby speckle; (3) nucleation of a new speckle adjacent to the trangene array.
Large-scale chromatin folding motifs
Besides investigations into the link between transcription and large-scale chromatin structure, we have applied these three generations of engineered chromosome regions to analyze the structural motifs underlying large-scale chromatin folding and mitotic chromosome condensation. Using gene amplified regions we have confirmed the existence and demonstrated the long-term stability of large-scale chromatin fibers in live cells. Using a novel in vivo immunogold labeling procedure in which Nanogold labeled antibodies or Fab’ fragments are injected into live cells (Kireev et al. 2008), we have visualized these large-scale chromatin fibers without any prior detergent extraction of nuclei and confirmed at the ultrastructural level the existence of discrete large-scale chromatin fibers with diameters in the ~120–170 nm size range, very similar to that previously observed for endogenous chromatin using permeabilized nuclei.
Analysis of large multi-copy plasmid arrays in mitotic chromosomes suggested the existence of an ~250 nm folding intermediate within metaphase chromosomes (Strukov et al. 2003), further supporting hierarchical folding models (Kireeva et al. 2004). Analysis of several lac operator tagged loci generated by limited gene amplification, demonstrated the absence of any long-range correlation in large-scale chromatin folding within metaphase chromosomes other than longitudinal compaction, with no correlation in axial positioning of the same loci on sister chromatids; these results would imply irregular folding in any hierarchical model (Strukov and Belmont 2009). In contrast, analysis of a particular gene amplified HSR showed a striking repositioning of spots from the periphery of prophase chromatids to the metaphase chromosome axis. Although hints of uncoiling of a ~250 nm chromatid were seen in telophase, these targeting results were not easily explained by hierarchical folding models (Dietzel and Belmont 2001).
Most recently, examining multi-copy BAC transgene arrays in mouse embryonal stem cells (ESCs) and cells differentiated along different lineages from these ESCs has revealed a surprising, dynamic plasticity of large-scale chromatin structure (Sinclair et al. 2010). While reproducing certain features of endogenous chromosomes, including self-assembly into chromosome territory-like domains and positioning of active sequences towards the periphery and repetitive elements to the interior of these domains, unexpectedly this study revealed the capability of linear mitotic and interphase chromosome regions forming from noncontiguously folded DNA topologies (Fig. 6). In particular, our results highlight the potential for large-scale chromatin fibers and hierarchical-like folding to co-exist with stable, long-range cis interactions, as revealed by 3C and other methods.
Figure 6. Looping between distant sequences and complex DNA topologies can coexist with large-scale chromatin folding into linear fibers.

Multi-copy DHFR BAC transgenes in mouse ES cells differentiated into fibroblast-like cells (A- DAPI staining red, EGFP-lac repressor green) or mouse 3T3 (B) cells show an average of one foci of lac operator repeats per 7 BAC copies. In mouse 3T3 cells (B) and some differentiated cells both BAC (red) and lac operator sequences (green) show extensive co-localization. In contrast segregation of lac operator sequences to the sides of large-scale chromatin fibers (C) or foci (D) are seen in other cells. Models E–G correspond to the inferred folding consistent with FISH observations in B–D respectively. (Red, BAC sequence; green, lac operator repeats; blue, the path of one BAC copy).
Conclusions
Our work to date using these engineered chromosome regions has been focused on analyzing the structure and/or dynamics of large-scale chromatin organization. While recognizing the limitations of studying engineered regions versus natural chromosomes, our third generation BAC transgene array approach is getting closer to recapitulating key features of native chromosome behavior. The focus of our laboratory is now shifting to include the use of these engineered chromosome regions to begin to identify cis and trans determinants of large-scale chromatin organization. Starting from the demonstration that the Hsp70 BAC transgene is sufficient to reproduce the heat shock dependent association with nuclear speckles of the endogenous locus, we were able to show that the Hsp70 promoter was sufficient for this speckle targeting (Hu et al. 2010). Similarly, our demonstration that the human β-globin BAC targets to the nuclear periphery in mouse ESCs (Sinclair et al. 2010), suggests a similar approach to dissect what cis elements confer this peripheral targeting. With regard to trans factors, work is in progress using a Drosophila S2 RNAi screen to determine trans factors regulating the large-scale chromatin decondensation of a multi-copy metallothionein BAC transgene array after transcriptional induction. Starting from an ~250 gene set, including chromatin modifying subunits and known genes involved in chromatin and chromosome biology, we have identified a number of genes which when knocked down either lead to decreased or increased levels of decondensation with induction.
One can easily imagine a large number of similar projects to identify cis and trans determinants of large-scale chromatin organization and function, starting from a visual assay based on these engineered chromosome regions. This approach promises a more focused dissection of cell biological phenomenon involving chromosome behavior than standard genetic screens.
Acknowledgments
This work was supported by NIH grants GM42516 and GM58460 to A.S.B. We thank Dr. Michael Hendzel, University of Alberta for kindly providing the image in Fig. 2D.
References
- Bazett-Jones DP, Hendzel MJ. Electron spectroscopic imaging of chromatin. Methods. 1999;17:188–200. doi: 10.1006/meth.1998.0729. [DOI] [PubMed] [Google Scholar]
- Belmont AS, Braunfeld MB, Sedat JW, Agard DA. Large-scale chromatin structural domains within mitotic and interphase chromosomes in vivo and in vitro. Chromosoma. 1989;98:129–143. doi: 10.1007/BF00291049. [DOI] [PubMed] [Google Scholar]
- Belmont AS, Bruce K. Visualization of G1 chromosomes: a folded, twisted, supercoiled chromonema model of interphase chromatid structure. J Cell Biol. 1994;127:287–302. doi: 10.1083/jcb.127.2.287. [DOI] [PMC free article] [PubMed] [Google Scholar]
- Belmont AS, Dietzel S, Nye AC, Strukov YG, Tumbar T. Large-scale chromatin structure and function. Curr Opin Cell Biol. 1999;11:307–311. doi: 10.1016/S0955-0674(99)80041-6. [DOI] [PubMed] [Google Scholar]
- Bohrmann B, Kellenberger E. Immunostaining of DNA in electron microscopy: an amplification and staining procedure for thin sections as alternative to gold labeling. J Histochem Cytochem. 1994;42:635–643. doi: 10.1177/42.5.7512586. [DOI] [PubMed] [Google Scholar]
- Cairns BR. The logic of chromatin architecture and remodelling at promoters. Nature. 2009;461:193–8. doi: 10.1038/nature08450. [DOI] [PubMed] [Google Scholar]
- Campos EI, Reinberg D. Histones: annotating chromatin. Annu Rev Genet. 2009;43:559–99. doi: 10.1146/annurev.genet.032608.103928. [DOI] [PubMed] [Google Scholar]
- Chambeyron S, Bickmore WA. Chromatin decondensation and nuclear reorganization of the HoxB locus upon induction of transcription. Genes Dev. 2004;18:1119–30. doi: 10.1101/gad.292104. [DOI] [PMC free article] [PubMed] [Google Scholar]
- Chuang CH, Carpenter AE, Fuchsova B, Johnson T, de Lanerolle P, Belmont AS. Long-range directional movement of an interphase chromosome site. Curr Biol. 2006;16:825–31. doi: 10.1016/j.cub.2006.03.059. [DOI] [PubMed] [Google Scholar]
- Cope NF, Fraser P, Eskiw CH. The yin and yang of chromatin spatial organization. Genome Biol. 2010;11:204. doi: 10.1186/gb-2010-11-3-204. [DOI] [PMC free article] [PubMed] [Google Scholar]
- Cremer T, Cremer C. Chromosome territories, nuclear architecture and gene regulation in mammalian cells. Nat Rev Genet. 2001;2:292–301. doi: 10.1038/35066075. [DOI] [PubMed] [Google Scholar]
- Cremer T, Cremer M, Dietzel S, Muller S, Solvei I, Fakan S. Chromosome territories- a functional nuclear landscape. Curr Opin Cell Bio. 2006;18:307–316. doi: 10.1016/j.ceb.2006.04.007. [DOI] [PubMed] [Google Scholar]
- Croft JA, Bridger JM, Boyle S, Perry P, Teague P, Bickmore WA. Differences in the localization and morphology of chromosomes in the human nucleus. J Cell Biol. 1999;145:1119–31. doi: 10.1083/jcb.145.6.1119. [DOI] [PMC free article] [PubMed] [Google Scholar]
- de Laat W, Grosveld F. Spatial organization of gene expression: the active chromatin hub. Chromosome Res. 2003:447–59. doi: 10.1023/a:1024922626726. [DOI] [PubMed] [Google Scholar]
- de Wit E, van Steensel B. Chromatin domains in higher eukaryotes: insights from genome-wide mapping studies. Chromosoma. 2009;118:25–36. doi: 10.1007/s00412-008-0186-0. [DOI] [PubMed] [Google Scholar]
- Dietzel S, Belmont AS. Reproducible but dynamic positioning of DNA in chromosomes during mitosis. Nat Cell Biol. 2001;3:767–70. doi: 10.1038/35087089. [DOI] [PubMed] [Google Scholar]
- Dietzel S, Zolghadr K, Hepperger C, Belmont AS. Differential large-scale chromatin compaction and intranuclear positioning of transcribed versus non-transcribed transgene arrays containing beta-globin regulatory sequences. J Cell Sci. 2004;117:4603–14. doi: 10.1242/jcs.01330. [DOI] [PubMed] [Google Scholar]
- Dillon N. The impact of gene location in the nucleus on transcriptional regulation. Dev Cell. 2008;15:182–6. doi: 10.1016/j.devcel.2008.07.013. [DOI] [PubMed] [Google Scholar]
- Ebisuya M, Yamamoto T, Nakajima M, Nishida E. Ripples from neighbouring transcription. Nat Cell Biol. 2008 doi: 10.1038/ncb1771. [DOI] [PubMed] [Google Scholar]
- Elgin SCR. Chromatin structure and gene activity. Curr Opin Cell Biol. 1990;2:437–445. doi: 10.1016/0955-0674(90)90125-x. [DOI] [PubMed] [Google Scholar]
- Goetze S, Mateos-Langerak J, Gierman HJ, de Leeuw W, Giromus O, Indemans MH, Koster J, Ondrej V, Versteeg R, van Driel R. The three-dimensional structure of human interphase chromosomes is related to the transcriptome map. Mol Cell Biol. 2007;27:4475–87. doi: 10.1128/MCB.00208-07. [DOI] [PMC free article] [PubMed] [Google Scholar]
- Ho L, Crabtree GR. Chromatin remodeling during development. Nature. 2010;463:474–84. doi: 10.1038/nature08911. [DOI] [PMC free article] [PubMed] [Google Scholar]
- Hu Y, Kireev I, Plutz MJ, Ashourian N, Belmont AS. Large-scale chromatin structure of inducible genes- transcription on a linear template. J Cell Biol. 2009;185:87–100. doi: 10.1083/jcb.200809196. [DOI] [PMC free article] [PubMed] [Google Scholar]
- Hu Y, Plutz M, Belmont AS. Hsp70 gene association with nuclear speckles is Hsp70 promoter specific. J Cell Biol. 2010;191:711–9. doi: 10.1083/jcb.201004041. [DOI] [PMC free article] [PubMed] [Google Scholar]
- Igo-Kemenes T, Horz W, Zachau HG. Chromatin. Ann Rev Biochem. 1982:89–121. doi: 10.1146/annurev.bi.51.070182.000513. [DOI] [PubMed] [Google Scholar]
- Kireev I, Lakonishok M, Liu W, Joshi VN, Powell R, Belmont AS. In vivo immunogold labeling confirms large-scale chromatin folding motifs. Nat Methods. 2008;5:311–3. doi: 10.1038/nmeth.1196. [DOI] [PubMed] [Google Scholar]
- Kireeva N, Lakonishok M, Kireev I, Hirano T, Belmont AS. Visualization of early chromosome condensation: a hierarchical folding, axial glue model of chromosome structure. J Cell Biol. 2004;166:775–85. doi: 10.1083/jcb.200406049. [DOI] [PMC free article] [PubMed] [Google Scholar]
- Li G, Sudlow G, Belmont AS. Interphase cell cycle dynamics of a late-replicating, heterochromatic homogeneously staining region: precise choreography of condensation/decondensation and nuclear positioning. J Cell Biol. 1998;140:975–989. doi: 10.1083/jcb.140.5.975. [DOI] [PMC free article] [PubMed] [Google Scholar]
- Lieberman-Aiden E, van Berkum NL, Williams L, Imakaev M, Ragoczy T, Telling A, Amit I, Lajoie BR, Sabo PJ, Dorschner MO, Sandstrom R, Bernstein B, Bender MA, Groudine M, Gnirke A, Stamatoyannopoulos J, Mirny LA, Lander ES, Dekker J. Comprehensive mapping of long-range interactions reveals folding principles of the human genome. Science. 2009;326:289–93. doi: 10.1126/science.1181369. [DOI] [PMC free article] [PubMed] [Google Scholar]
- Mahy NL, Bickmore WA, Tumbar T, Belmont AS. Linking large-scale chromatin structure with nuclear function. In: Elgin SCR, Workman JL, editors. Chromatin Structure and Gene Expression. 2. Oxford University Press; 2000. [Google Scholar]
- Olins AL, Moyer BA, Kim SH, Allison DP. Synthesis of a more stable osmium ammine electron-dense DNA stain. J Histochem Cytochem. 1989;37:395–398. doi: 10.1177/37.3.2465337. [DOI] [PubMed] [Google Scholar]
- Osborne CS, Chakalova L, Brown KE, Carter D, Horton A, Debrand E, Goyenechea B, Mitchell JA, Lopes S, Reik W, Fraser P. Active genes dynamically colocalize to shared sites of ongoing transcription. Nat Genet. 2004;36:1065–71. doi: 10.1038/ng1423. [DOI] [PubMed] [Google Scholar]
- Robinett CC, Straight A, Li G, Willhelm C, Sudlow G, Murray A, Belmont AS. In vivo localization of DNA sequences and visualization of large-scale chromatin organization using lac operator/repressor recognition. J Cell Biol. 1996;135:1685–1700. doi: 10.1083/jcb.135.6.1685. [DOI] [PMC free article] [PubMed] [Google Scholar]
- Schneider R, Grosschedl R. Dynamics and interplay of nuclear architecture, genome organization, and gene expression. Genes Dev. 2007;21:3027–43. doi: 10.1101/gad.1604607. [DOI] [PubMed] [Google Scholar]
- Shopland LS, Johnson CV, Byron M, McNeil J, Lawrence JB. Clustering of multiple specific genes and gene-rich R-bands around SC-35 domains: evidence for local euchromatic neighborhoods. J Cell Biol. 2003;162:981–90. doi: 10.1083/jcb.200303131. [DOI] [PMC free article] [PubMed] [Google Scholar]
- Shopland LS, Lynch CR, Peterson KA, Thornton K, Kepper N, Hase J, Stein S, Vincent S, Molloy KR, Kreth G, Cremer C, Bult CJ, O’Brien TP. Folding and organization of a contiguous chromosome region according to the gene distribution pattern in primary genomic sequence. J Cell Biol. 2006;174:27–38. doi: 10.1083/jcb.200603083. [DOI] [PMC free article] [PubMed] [Google Scholar]
- Sinclair P, Bian Q, Plutz M, Heard E, Belmont AS. Dynamic plasticity of large-scale chromatin structure revealed by self-assembly of engineered chromosome regions. J Cell Biol. 2010;190:761–776. doi: 10.1083/jcb.200912167. [DOI] [PMC free article] [PubMed] [Google Scholar]
- Skaer RJ, Whytock S. Chromatin-like artifacts from nuclear sap. J Cell Sci. 1977;26:301–310. doi: 10.1242/jcs.26.1.301. [DOI] [PubMed] [Google Scholar]
- Smith KP, Moen PT, Wydner KL, Coleman JR, Lawrence JB. Processing of endogenous pre-mRNAs in association with SC-35 domains is gene specific. J Cell Biol. 1999;144:617–29. doi: 10.1083/jcb.144.4.617. [DOI] [PMC free article] [PubMed] [Google Scholar]
- Solovei I, Cavallo A, Schermelleh L, Jaunin F, Scasselati C, Cmarko D, Cremer C, Fakan S, Cremer T. Spatial preservation of nuclear chromatin architecture during three-dimensional fluorescence in situ hybridization (3D-FISH) Exp Cell Res. 2002;276:10–23. doi: 10.1006/excr.2002.5513. [DOI] [PubMed] [Google Scholar]
- Strukov YG, Belmont AS. Mitotic chromosome structure: reproducibility of folding and symmetry between sister chromatids. Biophys J. 2009;96:1617–28. doi: 10.1016/j.bpj.2008.10.051. [DOI] [PMC free article] [PubMed] [Google Scholar]
- Strukov YG, Wang Y, Belmont AS. Engineered chromosome regions with altered sequence composition demonstrate hierarchical large-scale folding within metaphase chromosomes. J Cell Biol. 2003;162:23–35. doi: 10.1083/jcb.200303098. [DOI] [PMC free article] [PubMed] [Google Scholar]
- Testillano PS, Sanchez-Pina MA, Olmedilla A, Ollacarizqueta MA, Tandler CJ, Risueno MC. A specific ultrastructural method to reveal DNA: the NAMA-Ur. J Histochem Cytochem. 1991;39:1427–38. doi: 10.1177/39.10.1719069. [DOI] [PubMed] [Google Scholar]
- Tumbar T, Belmont AS. Interphase movements of a DNA chromosome region modulated by VP16 transcriptional activator. Nat Cell Biol. 2001;3:134–139. doi: 10.1038/35055033. [DOI] [PubMed] [Google Scholar]
- Tumbar T, Sudlow G, Belmont AS. Large-scale chromatin unfolding and remodeling induced by VP16 acidic activation domain. J Cell Bio. 1999;145:1341–1354. doi: 10.1083/jcb.145.7.1341. [DOI] [PMC free article] [PubMed] [Google Scholar]
- Verschure PJ, van der Kraan I, de Leeuw W, van der Vlag J, Carpenter AE, Belmont AS, van Driel R. In vivo HP1 targeting causes large-scale chromatin condensation and enhanced histone lysine methylation. Mol Cell Biol. 2005;25:4552–64. doi: 10.1128/MCB.25.11.4552-4564.2005. [DOI] [PMC free article] [PubMed] [Google Scholar]
- Volpi EV, Chevret E, Jones T, Vatcheva R, Williamson J, Beck S, Campbell RD, Goldsworthy M, Powis SH, Ragoussis J, Trowsdale J, Sheer D. Large-scale chromatin organization of the major histocompatibility complex and other regions of human chromosome 6 and its response to interferon in interphase nuclei. J Cell Sci. 2000;113:1565–76. doi: 10.1242/jcs.113.9.1565. [DOI] [PubMed] [Google Scholar]
- Williams A, Spilianakis CG, Flavell RA. Interchromosomal association and gene regulation in trans. Trends Genet. 2010;26:188–97. doi: 10.1016/j.tig.2010.01.007. [DOI] [PMC free article] [PubMed] [Google Scholar]
- Zink D, Amaral MD, Englmann A, Lang S, Clarke LA, Rudolph C, Alt F, Luther K, Braz C, Sadoni N, Rosenecker J, Schindelhauer D. Transcription-dependent spatial arrangements of CFTR and adjacent genes in human cell nuclei. J Cell Biol. 2004;166:815–25. doi: 10.1083/jcb.200404107. [DOI] [PMC free article] [PubMed] [Google Scholar]