Abstract
Virtual-pinhole PET (VP-PET) imaging is a new technology in which one or more high-resolution detector modules are integrated into a conventional PET scanner with lower-resolution detectors. It can locally enhance the spatial resolution and contrast recovery near the add-on detectors, and depending on the configuration, may also increase the sensitivity of the system. This novel scanner geometry makes the reconstruction problem more challenging compared to the reconstruction of data from a standalone PET scanner, as new techniques are needed to model and account for the non-standard acquisition. In this paper, we present a general framework for fully 3D modeling of an arbitrary VP-PET insert system. The model components are incorporated into a statistical reconstruction algorithm to estimate an image from the multi-resolution data. For validation, we apply the proposed model and reconstruction approach to one of our custom-built VP-PET systems – a half-ring insert device integrated into a clinical PET/CT scanner. Details regarding the most important implementation issues are provided. We show that the proposed data model is consistent with the measured data, and that our approach can lead to reconstructions with improved spatial resolution and lesion detectability.
1. Introduction
VP-PET imaging is a novel and fundamental modification to a conventional PET scanner design. It is intended to improve the spatial resolution of an existing PET scanner based on the principle of magnification, as used in pinhole SPECT imaging. In pinhole SPECT, as an object (i.e., a radioactive source) is moved closer to the pinhole collimator, the overall system resolution becomes more dependent on the diameter of the pinhole aperture, and less so on the intrinsic detector resolution. Tai et al. (2008) extended this concept to PET imaging, in which a high-resolution detector (in coincidence with lower-resolution detectors) takes the place of the physical pinhole collimator. The high-resolution detector functions as the vertex of a fanbeam with the lower-resolution detectors; the closer the object is to the fanbeam vertex, the greater the projection of the radioactivity distribution onto the low-resolution detector array.
Based on this concept, it was proposed in Tai et al. (2008) that an existing PET scanner could be supplemented with higher-resolution “insert” detectors in such a way that the system resolution near the insert depends minimally on the lower-resolution detectors of the original scanner. The system resolution near the insert instead depends primarily on the intrinsic resolution of the high-resolution detectors.
A second benefit of the VP-PET system is the reduction of resolution loss due to gamma ray acolinearity. For scanners with a large distance between detectors (e.g., whole-body clinical PET scanners), gamma ray acolinearity can significantly blur the measurements. By inserting an additional set of detectors within the scanner field of view (FOV), additional lines of response (LORs) will be measured in which the distance between detectors is shortened. Furthermore, by design, the source object will be located closer to the insert detectors than to the original scanner detectors. These two factors can greatly reduce the effect of gamma ray acolinearity on the supplemental measurements (Park et al. 2007, Tai et al. 2008).
While decreasing the distance between detectors is useful for reducing the acolinearity effect, it also has the potential to worsen the depth-of-interaction (DOI) effect. Therefore, insert crystals are usually shorter than scanner crystals, or they have DOI-resolving capabilities. DOI detectors do not decrease sensitivity as do short crystals, although they add complexity to the system.
Our group has successfully built several prototype insert systems that take advantage of the VP-PET concept. A full-ring insert device was integrated into a MicroPET Focus 220 scanner (CTI/Concorde Microsystems, Knoxville, TN) for small-animal imaging (Wu et al. 2008a). We also built a novel half-ring insert device and integrated it into a Biograph 40 PET/CT scanner (Siemens Medical Solutions, Knoxville, TN) for human imaging applications (Wu et al. 2008b). Figure 1 shows the arrangement of this clinical system, which consists of a half-ring of high-resolution detector modules inside the FOV of the Biograph scanner. By integrating the insert detector electronics with the Biograph hardware, three sets of coincidence data are acquired simultaneously: insert-insert (II), insert-scanner (IS), and scanner-scanner (SS). This system can currently be used for head and neck imaging, although with some modification, it could potentially be used for breast imaging as well.
Figure 1.
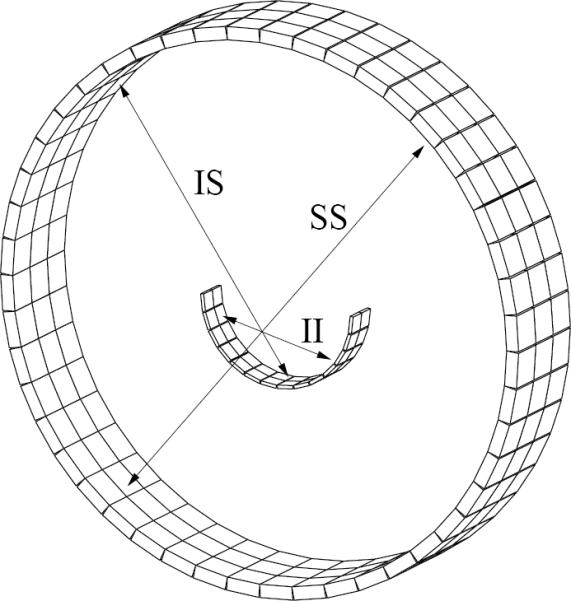
Half-ring PET insert system geometry showing the insert-insert (II), insert-scanner (IS), and scanner-scanner (SS) coincidence types.
Other groups have proposed smaller inserts that take the form of a single high-resolution imaging probe (Studen et al. 2010, Garibaldi et al. 2010, Qi et al. 2011). Recent simulation studies showed that such a probe can be adaptively positioned in the FOV to achieve optimal lesion detectability according to task-specific numerical observers (Zhou and Qi 2009, Zhou and Qi 2011). While a single-detector-module probe is less complex to implement than a half- or full-ring insert system, it can only provide SS and IS data, whereas our current systems also provide II data. Probe-based systems are also limited to a small region where higher spatial resolution can be obtained. There are tradeoffs in choosing one type of insert system over another, and the choice is application-dependent.
The overall goal of this paper is to describe the model calculations in sufficient detail that they can be used to perform fully 3D reconstruction of measured data from a physical insert system. We have attempted to retain as much similarity to conventional methods as possible, but make enhancements where necessary to handle complications such as normalization of the multi-resolution datasets and attenuation due to the insert detectors in the FOV. As stated by Chatziioannou (2008), one of the main challenges brought about by the complex sampling geometry is the required modification to the PET reconstruction framework. The theory described in this work is applicable to a wide variety of insert configurations, including the single-detector-module probe and the half-ring/full-ring designs.
The organization of this paper is as follows. Section 2 describes the reconstruction framework for an arbitrary insert system. The proposed data model – which is used by the reconstruction framework – is explained in Section 3. In Section 4, we describe our half-ring insert system and how the preceding sections were applied to this particular geometry. Section 5 describes several phantom-based experiments that were performed with the half-ring insert system. These experiments were used to validate the proposed reconstruction framework and data model. Results are shown in Section 6, followed by discussion and conclusions in Sections 7 and 8.
2. Reconstruction of VP-PET data
Reconstruction of noisy PET data acquired in a complex scanner geometry is most naturally handled by statistical image reconstruction algorithms. The basic statistical data model assumes that each measurement yi is an independent Poisson random variable with mean . The index i denotes a particular LOR within the measurement space of all possible coincidences. We concatenate the measurements from each coincidence type into a single vector , where y represents the entire dataset comprising M measurements, and `;' indicates vertical concatenation. If measurements of a particular coincidence type are not available (e.g., probe-based inserts have no II events), the respective component of y is simply an empty vector.
The mean value of y can be modeled in matrix-vector form by
| (1) |
where is the system matrix, is the image representation of the true activity distribution with N voxels, and and are the mean number of random coincidences and scatter counts, respectively. To maintain the validity of the Poisson model, we do not pre-correct the prompt data for randoms or scatter (Mumcuoğlu et al. 1996). System matrix entry pij represents the probability that a gamma ray pair emitted from voxel j is detected in LOR i. Analogous to the partitioning of y, the system matrix is partitioned according to coincidence type, i.e., .
Maximum a posteriori (MAP) or maximum likelihood (ML) techniques can be used for image reconstruction based on the statistical data model described above. The posterior distribution used in MAP may also be viewed as a penalized likelihood (PL) objective function (Fessler 2000). To maximize the overall system sensitivity while improving the image resolution, all measured events from the applicable coincidence types are utilized – in their native geometry – to jointly estimate a single image volume.
The log-likelihood function for the independent Poisson measurements is written as
| (2) |
where is implicitly a function of λ by (1). In the PL framework, reconstruction is achieved by finding the solution
| (3) |
The influence of the penalty term is controlled by the parameter β. U(λ) is a penalty function that imposes some degree of local smoothness in the image; the function is typically chosen to penalize differences between neighboring voxel values. In this work, we use the edge-preserving penalty function
| (4) |
where Nj is the 26-voxel 3D neighborhood surrounding voxel j. The weights wjk control the relative contribution of each neighbor, and are defined to be the inverse distance between voxel centers.
In this paper, we use the one-step-late algorithm (Green 1990) to obtain the solution to (3) for β > 0. The update step for one iteration is given by
| (5) |
where
| (6) |
and denotes the estimate of λj at iteration k. Note that the mean randoms and scatter estimates are not iteration-dependent; they are determined beforehand, as discussed in Section 3.
The accuracy of the model specified in (1) largely drives the accuracy of the image reconstruction. Therefore, the following sections focus heavily on the mean data model.
3. Data model for VP-PET insert systems
Following the general strategy of Mumcuoğlu et al. (1994) and Qi et al. (1998), we factor the system matrix into a number of components. The factorization enables physical effects to be calculated or measured independently without subsequently needing to regenerate the entire system matrix each time a new dataset is to be reconstructed. It also preserves the maximum degree of sparseness and symmetry in the system matrix. We factor P as
| (7) |
and are diagonal matrices that scale each LOR according to the attenuation from the body and insert, respectively. is also a diagonal matrix that scales each LOR; this normalization factor is further decomposed into a number of components. is the geometric projection kernel based on the system geometry and image space configuration. Other factors, such as blur kernels to model gamma ray acolinearity and positron range, were omitted from this work but can be readily included as needed.
Each component in (7) is discussed in greater detail in the remainder of this section. The treatment of mean randoms and scatter estimation is also covered.
3.1. Geometrical Factor
Given the fact that insert-scanner LORs involve detectors of different width, the parallel beam sinogram organization used in some conventional PET reconstruction methods does not readily apply to insert systems. Instead, the irregular sampling of the insert system makes computation of the geometric factor Pgeom more tractable using the native, fully 3D detector geometry. To model the true system geometry, the 3D position and orientation of every crystal and block is used in the calculations. It then becomes possible to explicitly account for crystal penetration and gaps between detector blocks.
Calculation of the (i, j)th element of Pgeom can ordinarily be performed based on the coincident solid angle between the front faces of two detectors forming LOR i as seen by voxel j (Qi et al. 1998, Markiewicz et al. 2005). This coincidence response function is averaged over the extent of the voxel. While this works for a circular scanner geometry, a nuance of an insert system is that activity may also be detected through the side faces of some insert cystals (depending on the source location and assuming the side faces are not shielded). Another disadvantage of using solid angle calculations that solely consider the front faces is that they do not readily apply to modeling DOI crystals.
Given these limitations of the front-face solid angle model, the general-purpose approach proposed in Huesman et al. (2000) and Hu et al. (2005) was used as the basis for the Pgeom calculations. (Use of this method for insert system geometry calculations was previously reported (Keesing et al. 2008, Zhou and Qi 2009).) This approach was also derived from solid angle principles, but considers subdividing each crystal into sub-volumes. By taking the average response of multiple sub-rays connecting one crystal volume in the LOR to the other, the side face issues are naturally overcome, and DOI-capable detectors can be more readily modeled in their native geometry. The crystal penetration effect is also modeled in the weighting applied to each sub-ray.
In particular, the Pgeom matrix elements are calculated as
| (8) |
where 〈·〉 denotes the average over all crystal sub-volume combinations comprising LOR i. μdet is the attenuation coefficient of the detector material at 511 keV, Li is the distance between the two sub-crystal centers, and lij is the length of intersection of the sub-ray (in LOR i) with voxel j. and are the lengths each end of the sub-ray travels through detector material (excluding air gaps) before reaching the respective sub-crystal of interest. The exponential factor accounts for the crystal penetration effect that leads to loss of detection efficiency, and the remaining part accounts for the solid angle.
Note that the crystal penetration calculation only pertains to the ends of the LOR since the ray passes through homogenous crystal material or air in these end segments; the lengths and can therefore be analytically calculated. The attenuation due to an insert detector in the middle of an LOR cannot be analytically calculated since the ray also passes through non-homogenous components of the insert detector module besides the crystals. This attenuation will instead be accounted for in Pinsert atten.
3.2. Attenuation Factors
The Pbody atten and Pinsert atten factors model the attenuation encountered along each LOR due to the scan subject and the insert device, respectively. Calculation of these factors requires the forward projection of linear attenuation coefficient images at 511 keV using a separate system matrix, A, designed for transmission modeling. Pgeom and A differ in that the entries of A solely represent the average length of intersection of a given LOR with a given voxel, i.e.,
| (9) |
Note that A must have units of length, as it operates on a linear attenuation coefficient image (with units of inverse length), and whose result will be subsequently exponentiated. The system matrix must include any voxels in the image space that would cause attenuation along a given LOR, which may include voxels that were not explicitly stored in Pgeom. This is because the number of voxels representing the valid emission region is generally less than the number of voxels representing attenuation regions (e.g., the voxels representing the attenuating insert device will not also emit gamma rays).
The attenuation factors are survival probabilities that can be determined with a single forward projection and exponentiation for each LOR in the system, based on the summed attenuation images:
| (10) |
| (11) |
In these expressions, μbody is the body attenuation image and μinsert is the insert attenuation image. Since in general the two attenuation images may be obtained at different times, we store them separately.
3.3. Normalization Factor
We developed a component-based normalization approach in this work that models each source of LOR sensitivity variation (other than those already accounted for in the Pgeom, Pbody atten, and Pinsert atten factors) as a component of Pnorm. The goal of this approach is to accurately estimate the model parameters of each normalization component, which can then be used to calculate Pnorm as a whole (Casey et al. 1995). The parameter space is far smaller than the total number of LORs in the system; this can effectively produce a normalization factor with lower variance than direct normalization techniques, which find the normalization factor for all LORs independently.
Some component-based normalization methods that have been developed for conventional PET scanners (e.g., Casey et al. 1995, Bailey et al. 1996, Badawi et al. 1998) do not apply to arbitrary insert systems, as they involve calculations that assume system-wide circular symmetry. That is, they assume the sinogram obtained by scanning a centered, circularly symmetric object has approximately symmetric projections in the radial direction, and has periodicity with each detector block in the angular direction. However, attenuation and other effects caused by positioning one or more insert detector modules in the scanner FOV eliminate such symmetry.
We determined that the most robust approach for normalization of an insert system is to use an ML framework to jointly estimate all normalization components simultaneously (Bai et al. 2002, Hogg et al. 2002). By using the same statistical framework for both the normalization factor estimation and the reconstruction, Pnorm will be consistent with the other factors comprising the data model. Estimation of the normalization components uses data from a separate scan of a phantom with known properties, such as a uniform cylinder or rotating rod source. This normalization scan only needs to be performed when the model parameters are likely to have changed, for example, if the insert is repositioned in the scanner FOV.
Unlike Bai et al. (2002), we have already accounted for the geometric effects (e.g., crystal penetration) by modeling the block detectors in their native geometry in Pgeom. For an insert system, it is simpler to account for these geometric effects in Pgeom rather than in the normalization factor, since they can be calculated directly.
Therefore, we leave out the geometric component from the normalization model, and instead express the diagonal entries of Pnorm as
| (12) |
where c(i, 1) is the absolute crystal index for one crystal in LOR i, c(i, 2) is the absolute crystal index for the other crystal in the LOR, and m(i) is the index to the sinogram that contains the LOR. εc is the efficiency of crystal c, and ηm is a scaling factor for sinogram m. In this context, we refer to the word sinogram as the 2D (possibly oblique) fanbeam sinogram formed between two crystal rings (of 360° or less). The fanbeam sinogram representation is naturally suited to organize the data from an insert system geometry (Pal et al. 2007).
We include ηm(i) as an overall scale factor for each sinogram to give the model additional degrees of freedom. The individual crystal efficiencies alone may not account for any differences in how the three coincidence types are measured, since the same crystals are used to measure more than one coincidence type (e.g., scanner crystals are used to measure both IS and SS coincidences).
Note that deadtime effects were not considered in this paper; if suffciently high count rates are expected, deadtime can be modeled as another normalization component by adopting the method described in Bai et al. (2002). Additionally, a time alignment component for detector block pairs was not specifically considered since some scanners have the ability to configure themselves for proper time alignment; this can be achieved in the scanner's calibration mode, which scans a uniform cylinder. For scanners that do not have this functionality, (12) can also be extended to incorporate this effect (Bai et al. 2002).
Let represent the parameter vector to be estimated. The mean data model from (1), now as a function of θ and written for an individual LOR of the normalization scan, is
| (13) |
where
| (14) |
and where λnorm is the known emission image of the normalization phantom. Calculation of the mean randoms and scatter estimates is explained further in Sections 3.4 and 3.5. The vectors , and are calculated and then treated as known quantities prior to performing the estimation of θ. The log-likelihood function for the independent Poisson normalization measurements is written as
| (15) |
where `≡' indicates that terms not dependent on θ were left out of the expression.
The ML solution,
| (16) |
can be obtained using steepest ascent, coordinate ascent, or other iterative gradient-based optimization methods. In comparison to the iterative image reconstruction algorithm, each iteration of the ML normalization framework takes very little computational effort since no forward projections or backprojections are performed within the iterations; only the one-time calculation of requires a forward projection.
3.4. Mean Randoms Estimation
During PET acquisitions, a delayed coincidences dataset is collected in conjunction with the prompt coincidences dataset. The delayed coincidences dataset, denoted r, is a noisy estimate of the number of random coincidences counted in the prompt dataset, y. Both the image reconstruction and normalization algorithms require the mean number of random coincidences at each LOR as input. In this work, the mean randoms estimate is obtained by performing nonlinear smoothing on r. This approach also makes use of ML estimation, and is a simple extension of the method proposed in Mumcuoğlu et al. (1996).
The mean randoms rate can be modeled as
| (17) |
where 2τ is the coincidence window duration, and σc(i,1) and σc(i,1) are the singles rates at crystals 1 and 2 of LOR i, respectively (Casey and Hoffman 1986). If we let T be the scan duration, the approximate mean number of acquired randoms is then
| (18) |
We treat the quantity (2τ)(T) as an unknown, and in fact, replace it by a sinogram scaling factor for mainly the same reasons we used such a factor in the normalization model. Our model for the mean number of randoms is therefore
| (19) |
where ρm(i) is a scale factor for the sinogram m that contains LOR i.
The parameter vector to be estimated is defined by . Then the log likelihood of the independent Poisson measurements r is
| (20) |
A similar optimization algorithm to the one used in the normalization framework can be used here.
3.5. Mean Scatter Estimation
Unlike randoms, a scatter estimate cannot be measured, and must therefore be determined by some other means. We have previously performed a Monte Carlo simulation and experimental study of the scattering properties of an insert device (Komarov et al. 2010), and also investigated the use of the single scatter simulation (SSS) technique (Watson 2000) for such a system. With the exception of a small number of LORs (depending on the specific orientation of the body and insert), Komarov et al. (2010) found that in general the number of detected events that had been scattered by the insert device was a small fraction of the total number of detected scatter events. (Some inter-crystal scatter will be detected by the insert.) It was also determined that multiple-scatter events only made up a small fraction of the total scatter counts.
The native 3D scanner and insert geometry – along with the approximately-known energy-dependent attenuation properties of the insert crystals and body – are used for the attenuation line integral calculations within the SSS method. The body attenuation is based on the μbody image. The reader is referred to Komarov et al. (2010) for further implementation and validation details for our half-ring insert system.
4. Application to Half-Ring Insert System
In this section, the implementation of the data model is described for our half-ring insert system (geometry shown in Figure 1). The goal here is to apply the model discussed in the previous sections to a real system. Our system combines a Siemens Biograph 40 PET/CT scanner with a half-ring array of high-resolution insert detectors (Wu et al. 2008b). Each circular ring of the scanner consists of 48 blocks of detectors, and each block contains a 13 × 13 array of 4 × 4 × 20 mm3 crystals. Although the Biograph scanner has four rings, the electronics from the fourth ring were used by our prototype insert device to provide centralized coincidence processing for the insert and scanner detectors.
The insert device has a half-ring shape, and there are two such half-rings stacked in the axial direction. Both half-rings consist of 14 blocks of detectors, and each block contains a 13 × 13 array of 2 × 2 × 5 mm3 crystals. The inner radius of the scanner is 427.5 mm, and the inner radius of the insert is 122 mm. All scanner and insert crystals are made of lutetium oxyorthosilicate (LSO), and are optically coupled to light guides followed by photomultiplier tubes (PMTs).
The scanner console is used to control the acquisition and to record a list-mode data file containing all events from the three coincidence types (II, IS, and SS). A custom histogramming routine was written that parses the list-mode data file and produces LOR histograms for each coincidence type; a separate histogram is produced for the prompt events and for the delayed events. These histograms were then reorganized into 2D fanbeam sinograms (for each ring combination). No axial compression was used, thereby resulting in 378 II sinograms, 1107 IS sinograms, and 861 SS sinograms.
4.1. Geometric factor implementation
To calculate Pgeom, the image space must first be defined. In our implementation, we use an image grid of 600×600×83 voxels with spacing 1×1×2 mm3. Although high-resolution voxels are only needed inside the II and IS FOV, the use of inhomogeneous voxel sizes throughout the image would make it difficult to maximize the amount of symmetry in Pgeom. Therefore, the same voxel size is used throughout the FOV.
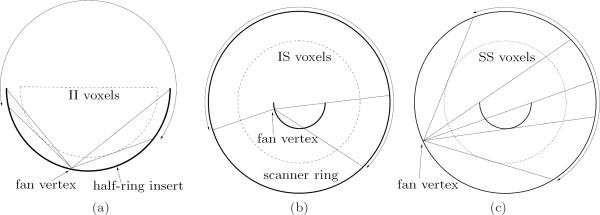
The imaging FOV/fanbeam width for each coincidence type is different, as shown in Figure 2. For SS and IS, the relevant voxels occupy a circular region; for II, the relevant voxels occupy a smaller semi-circular region. In all cases, the radius is determined by the coincidence pairs allowed by the processing hardware. The shape of these voxel regions is held constant for all slices. Only the voxels that lie within the region of a particular coincidence type need to be computed and stored in that partition of Pgeom. This not only saves memory, but also reduces the number of voxels that need to be considered during forward projection and backprojection.
Figure 2.
In-plane diagrams of the PET system and the voxels used in the FOVs of the three coincidence types. The insert half-ring and scanner ring are represented by darker curves. An example fanbeam projection is shown for each case, with the fanbeam extent indicated by an arc with double arrows. (a) Enlarged diagram of the II FOV. The fanbeam projection shown has a large amount of missing data in the central part of the fan. (b) The IS FOV is determined by the coincidence acceptance range. The LOR shown in the middle of the fan is at the transition between LORs that pass through the insert once or not at all. (c) SS FOV and fanbeam projection. The LORs shown in the middle of the fan are at the transitions where LORs pass through the insert once, twice, or not at all.
When the center of the half-ring insert is aligned with the center of the scanner, a significant amount of symmetry is available in-plane and axially. In the in-plane direction, two-fold mirror symmetry is possible for II and IS, while eight-fold rotational and mirror symmetry can be obtained for SS. Recall that such symmetry is only possible because the attenuation and normalization effects have been separated from the geometric factor.
In the axial direction, mirror and translational symmetry exists for all three coincidence types. To obtain maximum axial symmetry, the positioning and thickness of the slices needs to be carefully considered. The slices were chosen to have the same thickness as the axial pitch of the insert crystals (2 mm), and the slice edges were chosen to line up with the insert crystal edges. The slices also line up uniformly with the scanner crystals, since the axial pitch of the scanner crystals is 4 mm. The gap between detector blocks in the axial direction is approximated by a “filler” crystal ring (with no counts) to preserve translational symmetry; this is possible since the gap is 2 mm between the insert half-rings, and 4 mm between the scanner rings. Based on this symmetry, we parallelized the code that performs forward projection (application of Pgeom) and backprojection (application of P′geom).
4.2. Body attenuation image acquisition
Since the insert device is integrated with a clinical PET/CT scanner, a registered x-ray CT attenuation map of the body (scanned without the insert in the FOV) can easily be obtained using the scanner console. Once the CT scan console. Once the CT scan and reconstruction have finished, the attenuation image is then resized and aligned to match the image grid described above. Finally, the attenuation coeffcients are converted from x-ray energies to 511 keV using a piecewise linear transformation (Kinahan et al. 2003), and the result is stored in μbody for subsequent use in (11).
4.3. Insert attenuation image acquisition
The LSO crystals in the insert are very dense, as they must be able to stop 511 keV gamma rays. This unfortunately makes it impossible to scan the insert device using the x-ray CT scanner as we are able to do for the body; the maximum energy of photons from the x-ray tube is about 120 keV, which is far less than the amount of energy needed to penetrate the LSO crystals for transmission tomography. In addition, the large number of absorbed x-ray photons could potentially damage the PMTs and detector module electronics.
An alternative technique was therefore developed to generate μinsert. We performed a transmission scan of a single insert detector module and a block of aluminum alloy (used for the insert gantry housing) in a microPET Focus 220 scanner using a Ge-68 point source. The detector module included the 13 × 13 LSO crystal array, light guide, PMT, and high voltage divider boards. We used the automatic sinogram windowing feature (Huesman et al. 1988) to reduce the number of recorded scatter counts during the transmission scan.
From this scan, the 3D attenuation map was reconstructed using a statistical reconstruction algorithm for transmission tomography (O'Sullivan and Benac 2007). The voxels containing the detector module were extracted and replicated 28 times to model the exact layout of the 28 blocks in the insert device (14 in-plane × 2 axial).
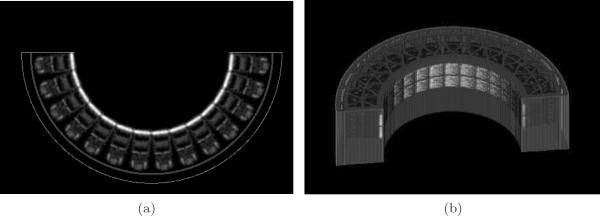
Custom software was also written to rasterize the aluminum gantry structure into an image based on its mechanical specifications. The measured attenuation coefficient of the aluminum alloy from the transmission images (at 511 keV) was used by the rasterizer. Finally, a composite attenuation map of the insert device was created by combining the detector module image with the rasterized gantry image. Figure 3 shows a 2D slice and volume rendering of the composite attenuation map, μinsert. The insert crystals in the μinsert image indeed have values near the expected attenuation coefficient of 0.87 cm−1 for LSO at 511 keV (Lewellen and Karp 2004).
Figure 3.
Composite insert attenuation map. (a) one slice of the attenuation map. Window min/max = [0.0, 0.9] cm−1; (b) rendering of the 3D voxelized attenuation map.
4.4. Normalization details
4.4.1. Normalization scan acquisition
For the normalization scan, we used a standard Ge-68 uniform cylindrical phantom that is commonly used for daily quality control of the PET/CT scanner. The phantom is 22 cm in diameter (20 cm active diameter) and 24 cm in height. The phantom can be supported by a special holder that is attached to the front edge of the patient bed such that the active volume of the phantom is suspended in air in front of the bed. This permits us to position the phantom in the center of the half-ring insert without any additional scattering medium in the imaging FOV.
Next, the PET scans of the normalization phantom are performed. For the results reported in this paper, a six hour normalization scan was done with the insert in the FOV. After retracting the insert from the scanner, a subsequent two hour scan was done to obtain the normalization factor for the standalone scanner.
The last step is to perform a CT scan of the phantom by itself (while still mounted to the front of the bed). This scan is used for two purposes: (1) to generate μbody, and (2) to generate λnorm. For λnorm, the exact shape and location of the activity distribution in the phantom can be obtained by segmenting the CT image, since the active area has a different attenuation coefficient than the cylinder casing. This reduces any uncertainty in the positioning of the normalization cylinder.
4.4.2. Normalization factor implementation
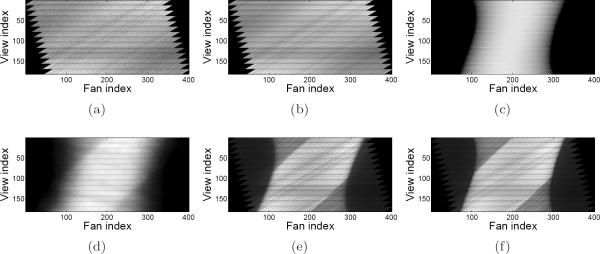
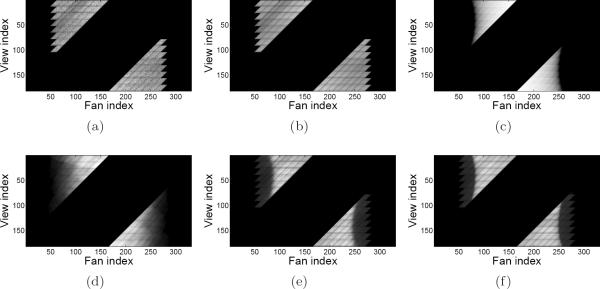
Due to the integration of the insert device and scanner electronics, there are some side e ects caused by the low-level use of the scanner's coincidence processing hardware for the insert. In particular, the coincidence processor always rejects coincidences from certain LORs that – under normal circumstances – would be considered a valid part of the FOV. As a result, some entire oblique sinograms that should have a nonzero number of counts are in fact recorded as all zeros. The rejection of valid coincidences occurs at the extremities of the in-plane II and IS FOVs as well. (For example, the sinograms in Figure 6 exhibit this effect as seen by the jagged sawtooth appearance on each side.)
Figure 6.
Shifted uniform cylinder phantom sinograms for the IS coincidence type. Image display window range is specified in square brackets. (a) Measured delayed coincidences [0, 451]; (b) mean randoms [0, 451]; (c) geometric forward projection; (d) mean scatter [0, 567]; (e) measured prompts [0, 2885]; (f) mean prompts [0, 2885].
Had the scanner hardware initially been designed to accommodate the insert device, rejection of these otherwise meaningful LORs would not occur. However, since our device is a prototype, we do need to account for this side effect in the data model.
The normalization factor calculations can be properly handled by applying a fixed boolean mask to the product of normalization components; the LORs that are known to be rejected by the hardware are zeroed, and those that are known to be accepted remain unchanged. Similarly, the sinograms in which one or both crystal rings is a “filler” ring (as discussed in Section 4.1) have a zero mask applied since those sinograms are not physically measured. During the mean randoms and scatter estimation, the mask must be applied in a similar fashion. Although it may seem like extra work to keep track of these LORs that are always zero, they are actually quite important to maintain, as they preserve the maximum amount of in-plane and axial symmetry in Pgeom.
5. Phantom Studies
Several experiments were performed to evaluate the accuracy of the system modeling techniques as well as the improvement in image resolution and contrast near the PET insert device. For each experiment, the components of the data model were calculated according to the previous sections.
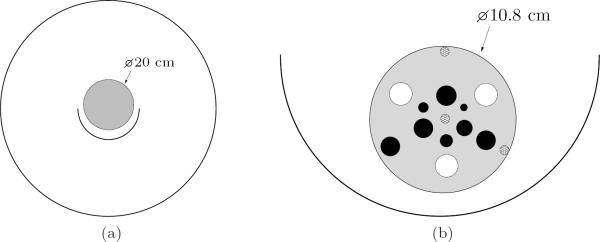
To study the model components at the system level, the uniform Ge-68 cylindrical phantom (previously used for normalization) was translated upwards 1.4 cm above the scanner isocenter. The phantom had a total activity of 80.7 MBq. Data were acquired for one hour with the phantom in this position. The vertical offset was instituted so as to test the mean data model in a location different from where the normalization factor was obtained. The phantom is shown in Figure 4a.
Figure 4.
Cross-sections of the physical phantoms used in the experiments. (a) Uniform cylinder phantom shifted upwards 1.4 cm from isocenter for the system model validation experiment; (b) enlarged diagram of the spherical tumor phantom positioned inside the half-ring insert for the resolution and contrast study (scanner not shown). See the text for a complete description of the phantom properties. The three cross-hatched circles are solid plastic support structures, the white circles do not contain activity, and the dark circles resemble hot tumors.
This measured scan was compared to mean estimates of the data at various stages of modeling. An emission image and attenuation image of the phantom were first generated by numerically shifting the λnorm and μbody images (from the normalization procedure) up by 1.4 cm. (In principle, an equivalent approach for generating these images would have been to use a CT scan with the phantom in its vertically offset position.) Using this information, the shifted emission image was forward projected, and the various model components were applied one-by-one to the resulting forward projections of all three coincidence types; this mean estimate was then compared to the measured data.
To test the data model in the context of the image reconstruction framework, a phantom with nonuniform activity distribution was scanned. We used a small cylindrical phantom containing a number of small spheres that resembled tumor activity (see Figure 4b). Several spheres contained non-radioactive substances, which tested the ability of the scatter estimation method to prevent spillover into these cold regions.
The phantom had an outer diameter of 10.8 cm, height of 12.7 cm, and wall thickness of 3 mm. The phantom interior and spherical bulbs were filled with a Cu-64 solution in a 5.55-to-1 tumor-to-background ratio, with an approximate total activity of 38.5 MBq. Starting from the 2 o'clock position in the outer ring of spheres and going clockwise, the contents and diameters of the spheres were: cold water (11.4 mm), hot tumor (9.6 mm), plaster (11.4 mm), hot tumor (9.6 mm), and air (11.4 mm). The inner ring consisted entirely of hot tumors of varying diameters; starting from the 12 o'clock position and going clockwise, the diameters were: 10.1 mm, 3.54 mm, 8.0 mm, 6.32 mm, 9.6 mm, and 5.0 mm.
This phantom was scanned a total of three times under different conditions: (1) with the insert in the FOV, (2) without the insert in the FOV but still connected electrically to the scanner, and (3) without the insert in the FOV and completely disconnected from the scanner. In each case, the data were acquired in five minute increments and was subsequently summed to yield 5 min, 10 min, and 15 min datasets.
For the first two scan modes, we used the reconstruction algorithm described earlier in this paper. Only three of the four scanner ring blocks acquired data due to the insert hardware integration. We used a maximum ring difference of 26 for the II and IS data, and a maximum ring difference of 10 for the SS data – all without axial compression. Reconstruction began from an initial guess of all ones for λ, with β set to 1/3. 50 iterations of the one-step-late algorithm were performed, which brought the algorithm close to convergence. The dataset from the third scan mode was reconstructed directly using the proprietary Siemens console software; 4 iterations and 8 subsets of the ordered subsets expectation maximization (OSEM) algorithm were performed, followed by filtering with a 2 mm Gaussian kernel. This reconstruction algorithm used all four ring blocks since the insert was fully disconnected, and therefore had the highest sensitivity. In Section 6, this scan mode and reconstruction method will be identified by the label `Standard'.
For quantification of contrast recovery, we calculated the contrast recovery coefficient (CRC) as
| (21) |
where Crecon is the contrast ratio obtained from analysis of the reconstructed image, and Cactual is the physical (known) contrast ratio. The tumor activity in the image was calculated using spherical regions of interest (ROIs) that were 75% of the full sphere diameters. This fraction accounts for the wall thickness of the tumors and the diffculties in determining the exact tumor centers in the image – especially for the smallest tumors where few voxels fit in the ROI. The background ROI was located in a nearby uniform rectangular region.
Our reconstruction code was run on a Dell Precision T7400 workstation, equipped with two quad-core Intel Xeon X5450 processors (3.0 GHz) and 16 GB RAM.
6. Results
6.1. Shifted uniform cylinder phantom
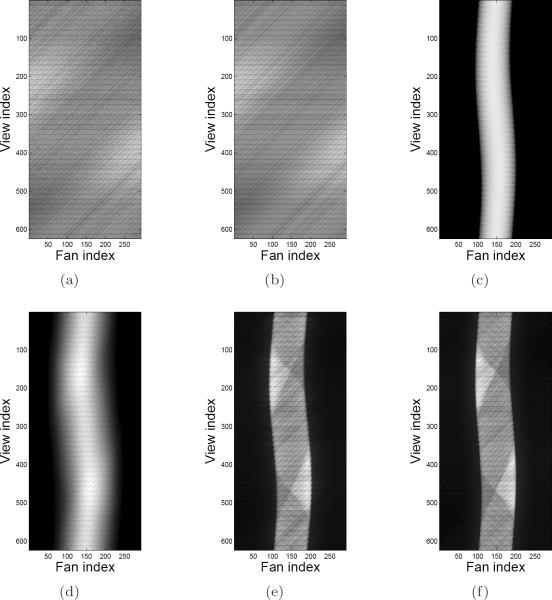
For presentation of the shifted cylinder modeling results, the collection of sinograms for each coincidence type was summed together. The estimated sinograms are shown in Figures 5, 6, and 7 at intermediate stages of modeling, along with the measured data. In particular, the measured delayed coincidences are compared to the mean randoms, and the measured prompts are compared to the complete mean data model in (1). Also shown is the estimated scatter sinogram, and Pgeom·λ without any other model components. Note that the image display window range is specified in square brackets in the caption for all sinograms except for Pgeom·λ, which has unnormalized units.
Figure 5.
Shifted uniform cylinder phantom sinograms for the II coincidence type. Image display window range is specified in square brackets. (a) Measured delayed coincidences [0, 106]; (b) mean randoms [0, 106]; (c) geometric forward projection; (d) mean scatter [0, 112]; (e) measured prompts [0, 498]; (f) mean prompts [0, 498].
Figure 7.
Shifted uniform cylinder phantom sinograms for the SS coincidence type. Image display window range is specified in square brackets. (a) Measured delayed coincidences [0, 267]; (b) mean randoms [0, 267]; (c) geometric forward projection; (d) mean scatter [0, 728]; (e) measured prompts [0, 4124]; (f) mean prompts [0, 4124].
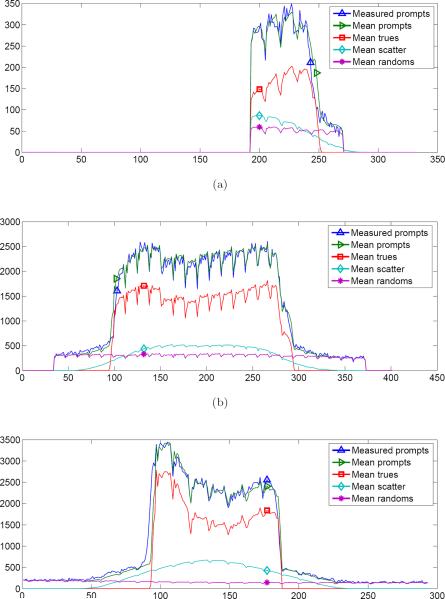
Profiles through the indicated view index in the respective sinograms are plotted in Figure 8. The profiles highlight the level of detail that was captured in the data modeling process. For example, the measured delayed coincidences and mean randoms agree quite well, and the estimated scatter tails match the shape of the scatter tails within the measured prompts profiles. Furthermore, the sharp valleys seen in the mean prompts and trues profiles match very well with the measured prompts profiles; these valleys are due to the variation in crystal sensitivity at the edge of each detector block. Also seen in the mean prompts and trues profiles is one minor source of disagreement, where one side of the phantom boundary appears to be slightly misaligned. This most likely indicates that the λnorm image and attenuation image were not shifted perfectly with respect to the phantom's physical position in the scanner when the dataset was acquired. Such image processing was done only for the purposes of this experiment, and is not used in actual routine reconstructions.
Figure 8.
Profiles through the shifted uniform cylinder phantom sinograms at the indicated view index for each coincidence type. (a) II (view index 156); (b) IS (view index 113); (c) SS (view index 220).
6.2. Small tumor phantom
Figure 9 shows the reconstructions of the small tumor phantom using the 15 min datasets. The left image corresponds to the PL joint reconstruction of the II, IS, and SS data. The middle image corresponds to the PL reconstruction of the SS data without the insert in the FOV. Finally, the right image corresponds to the standard mode using the Siemens reconstruction software, as described earlier.
Figure 9.
Small tumor phantom reconstructions. The slice through the center of the spheres is shown. (a) Joint II+IS+SS reconstruction (with insert in FOV); (b) SS reconstruction (without insert in FOV); (c) standard mode reconstruction (using Siemens console software).
It is important to point out that a true comparison among the three reconstruction methods is complicated by a number of items that require further study outside the scope of this work. For example, since the amount of data being supplied to the reconstruction algorithm is larger in the II+IS+SS case than in the SS-only case, it would seem that a different choice for β would be required in the two cases to balance the data and penalty terms in an appropriate manner. This may be task-and system-dependent. Comparisons are also affected by the fact that the standard method has access to data from all four scanner ring blocks, whereas the first two methods can currently only use three scanner ring blocks. Additionally, the standard method used OSEM with post-reconstruction blurring as opposed to the one-step-late PL framework. Nevertheless, the results presented illustrate the potential benefits of the insert system once other technical considerations are studied more closely.
When comparing the reconstructions to the diagram in Figure 4b, it can be observed that the three plastic support structures (indicated by cross-hatched circles in the diagram) appear as hot spots in all three images. Furthermore, the plaster sphere appears to have a ring of higher activity surrounding it. This activity is due to the Cu ions in the Cu-64 solution being attracted to these surfaces. Physically there is higher activity at these surfaces; it is not an attenuation modeling artifact, as it occurs in the standard mode image as well.
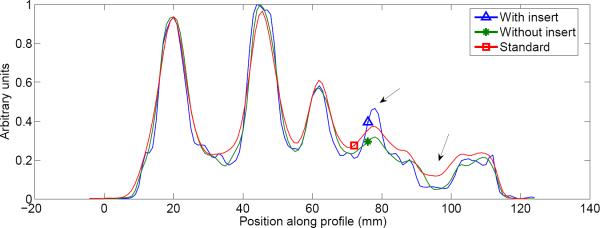
A line profile was taken through the three images, as shown in Figure 10. The profile passes through the spheres and center structure from the 8 o'clock position to the 2 o'clock position. While comparable resolution was observed for the larger tumors, the main advantage of the insert system can be seen for the smallest of the tumors, where the insert profile has the best resolution and contrast.
Figure 10.
Profile through tumor phantom reconstruction. The line profile passes through the spheres and center structure from the 8 o'clock position to the 2 o'clock position. Note the improved contrast and resolution at the smallest tumor and cold water sphere when the half-ring insert was used (indicated by arrows).
Similar improvement in contrast was seen in the region of the profile passing through the cold water sphere (second arrow in Figure 10). While the resolution of the “without insert” image is similar to that of the standard Siemens image, the profiles in Figure 10 show that the cold water lesion has less spillover from the background activity in the “without insert” image obtained using our reconstruction and system model when compared to the standard Siemens image. This suggests that the scatter estimation in our model performs well and adequately corrects for scatter contamination.
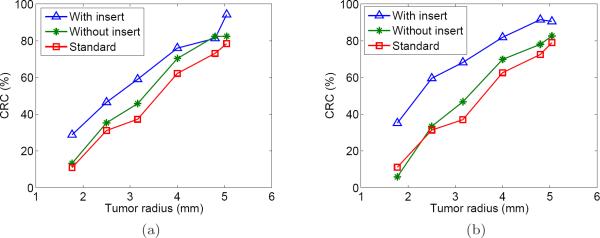
Next, the CRC plots are shown in Figure 11 for the reconstructions corresponding to the 10 min and 15 min datasets. The points plotted are for the six tumors in the inner ring (see Figure 4b). With few exceptions, the II+IS+SS joint reconstructions had a higher CRC across the range of tumor sizes. As expected, the differential was greater for the smaller tumors. A similar trend was seen for each acquisition length (including the 5 min dataset, not shown). The smaller tumors had lower CRC values mainly due to the partial volume effect.
Figure 11.
CRC as a function of tumor radius for two acquisition lengths. (a) 10 min; (b) 15 min.
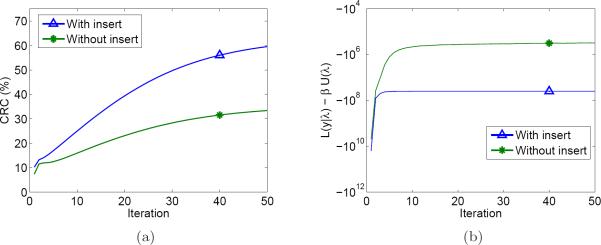
Finally, we demonstrate the convergence behavior of the algorithm using the CRC metric (Fig. 12a) and the objective function value from equation (3) (Fig. 12b). Since the Siemens reconstruction used OSEM and its per-iteration data was unavailable, it is not included in these plots. Both figures show the algorithm is close to converging after 50 iterations. The objective function for the “with insert” case levels o faster than the “without insert” case, although the slope of the CRC curves at iteration 50 is still slightly positive.
Figure 12.
Plots showing the behavior of the image reconstruction algorithm as a function of iteration. Since the Siemens reconstruction used a different algorithm and its per-iteration data was unavailable, it is not included in these plots. (a) CRC vs. iteration for the 2.5 mm radius tumor; (b) PL objective function vs. iteration.
7. Discussion
In this work, we have developed a comprehensive framework in which to carry out the data modeling and image reconstruction procedures for a general PET insert system. The goal of such a system is to improve the image resolution in the region of the insert device, which could also serve to enhance tumor contrast/detectability in that region.
As statistical reconstruction algorithms depend on having an accurate forward model of the measured data, we have formulated a model for an arbitrary insert system that includes: (1) geometric projection (including crystal penetration modeling and support for DOI detectors), (2) body attenuation factor, (3) insert attenuation factor, (4) component-based normalization factor, (5) mean randoms estimation, and (6) mean scatter estimation. Implementation details were then presented for our prototype half-ring insert system, which has been integrated into a clinical PET/CT scanner.
For a standard PET scanner configuration, the sinogram corresponding to a centered uniform cylinder would be roughly constant over the view angles and symmetrical within each fan-beam projection (neglecting the variation in crystal efficiencies). This is clearly not the case when the insert is in the FOV, as exemplified by the nonuniformity in the sinograms and profiles shown in Section 6.1. Although the deliberate shift of the cylinder in the first experiment led to some asymmetry, the insert attenuation and other factors play a significant role. As seen in Figure 2, for example, LORs pass through the insert (from different angles) once, twice, or not at all. Despite these challenges, we have demonstrated that the complete mean data model is able to capture the sources of variation consistently well for the three coincidence types.
The reconstruction results for the small tumor phantom show the potential of the insert to improve the resolution and tumor detectability over that which is obtained when reconstructing scanner-only data. Furthermore, the reconstructed images exhibited no noticeable artifacts, despite the aforementioned factors that cause the LORs to have highly spatially variant sensitivity.
It is likely that the half-ring system represents one of the most complex insert system geometries that would be used in practice. We therefore expect that the approach presented in this paper would be equally applicable to smaller probe-based systems; for a smaller system, all the effects modeled here would still need to be taken into account - although some of the individual factors (e.g., insert attenuation) may be simpler to model.
Future work will include improvements to the data model, for example, to model blurring due to physical effects such as gamma ray acolinearity and inter-crystal scatter. By doing so, further resolution improvements in the reconstructed images can be expected. There is also interest in using a more accurate coincident detector response function for the geometric modeling (e.g., Yamaya et al. 2005, Pratx and Levin 2011). The ability to perform these calculations in arbitrary geometries on the fly as in Pratx and Levin (2011) is computationally appealing.
Further development of the iterative reconstruction algorithm is also possible. For example, the ordered subsets technique (Hudson and Larkin 1994) would accelerate convergence of the iterative algorithm. More work will be needed to address the issue of achieving balanced subsets in the insert geometry. Secondly, it is worthwhile to study the regularization scheme in more detail, given the complex comparison in Section 6.2. Furthermore, given the spatially variant resolution characteristics of the image, a uniformly-applied penalty may not be the optimal choice.
8. Conclusion
Overall, we have developed and validated the core data modeling aspects of a VP-PET insert system. While the techniques are based on existing models for conventional PET scanners, there are many unique considerations brought about by the incorporation of additional detector modules into the FOV of a conventional scanner. Our data modeling and reconstruction frameworks were implemented for a half-ring insert system that is currently being evaluated for high-resolution clinical head and neck cancer imaging. These frameworks are based in large part on statistical estimation theory, which is well-suited for processing the noisy PET datasets (i.e., the normalization data, delayed coincidences data, and object scan data). In our investigations, it has proven to be a robust tool, and we therefore expect the techniques presented in this work to perform well for a variety of insert systems.
Acknowledgments
This work was supported in part by the National Cancer Institute of the National Institutes of Health (grants R33-CA110011 and P30-CA91842) and by Susan G. Komen for the Cure (grant BCTR0601279). Daniel B. Keesing was also supported in part by a National Science Foundation Graduate Research Fellowship. The authors would like to thank Michael Harrod for his assistance in using the PET/CT scanner, Thomas Voller for his assistance in obtaining Cu-64 for the experiments, and Dr. Debashish Pal for useful discussions. The authors would also like to thank Dr. John W. Young and Dr. Stefan B. Siegel of Siemens Molecular Imaging for technical support and valuable discussions.
References
- Badawi RD, Lodge MA, Marsden PK. Algorithms for calculating detector efficiency normalization coe cients for true coincidences in 3D PET. Phys. Med. Biol. 1998;43:189–205. doi: 10.1088/0031-9155/43/1/012. [DOI] [PubMed] [Google Scholar]
- Bai B, Li Q, Holdsworth CH, Asma E, Tai YC, Chatziioannou A, Leahy RM. Model-based normalization for iterative 3D PET image reconstruction. Phys. Med. Biol. 2002;47:2773–2784. doi: 10.1088/0031-9155/47/15/316. [DOI] [PubMed] [Google Scholar]
- Bailey DL, Townsend DW, Kinahan PE, Grootoonk S, Jones T. An investigation of factors affecting detector and geometric correction in normalization of 3-D PET data. IEEE Trans. Nucl. Sci. 1996;43(6):3300–3307. [Google Scholar]
- Casey ME, Gadagkar H, Newport D. A component based method for normalization in volume PET. Proc. 3rd Int. Meeting on Fully Three-Dimensional Image Reconstruction in Radiology and Nuclear Medicine.1995. pp. 67–71. [Google Scholar]
- Casey ME, Hoffman EJ. Quantitation in positron emission computed tomography: a technique to reduce noise in accidental coincidence measurements and coincidence efficiency calibration. J. Comput. Assist. Tomography. 1986;10:845–850. [PubMed] [Google Scholar]
- Chatziioannou A. VP-PET: A new imaging modality? J. Nucl. Med. 2008;49(3):345–346. doi: 10.2967/jnumed.107.044222. [DOI] [PubMed] [Google Scholar]
- Fessler JA. Statistical image reconstruction methods for transmission tomography. In: Sonka M, Fitzpatrick JM, editors. Handbook of Medical Imaging: Medical Image Processing and Analysis. Vol. 2. SPIE; Bellingham, WA: 2000. pp. 1–70. [Google Scholar]
- Garibaldi F, De Leo R, Ranieri A, Loddo F, Floresta M, Tamma C, Gabrielli A, Giorgi F, Cusanno F, Musico P, Perrino R, Finocchiaro P, Cosentino L, Pappalardo A, Meddi F, Maraviglia B, Giove F, Gili T, Capuani S, Turisini M, Clinthorne N, Huh S, Majewski S, Lucentini M, Gricia M, Giuliani F, Monno E. TOPEM: A multimodality probe (PET TOF, MRI, and MRS) for diagnosis and follow up of prostate cancer. IEEE Nuclear Science Symposium/Medical Imaging Conference.2010. pp. 2442–2444. [Google Scholar]
- Green PJ. Bayesian reconstructions from emission tomography data using a modified EM algorithm. IEEE Trans. Med. Imag. 1990;9:84–93. doi: 10.1109/42.52985. [DOI] [PubMed] [Google Scholar]
- Hogg D, Thielemans K, Mustafovic S, Spinks TJ. A study of bias for various iterative reconstruction methods in PET. IEEE Nuclear Science Symposium/Medical Imaging Conference.2002. pp. 1519–1523. [Google Scholar]
- Hu J, Qi J, Huber JS, Moses WW, Huesman RH. MAP image reconstruction for arbitrary geometry PET systems with application to a prostate-specific scanner. The 8th International Meeting on Fully Three-Dimensional Image Reconstruction in Radiology and Nuclear Medicine.2005. pp. 416–420. [Google Scholar]
- Hudson HM, Larkin RS. Accelerated image reconstruction using ordered subsets of projection data. IEEE Trans. Med. Imag. 1994;13(4):601–609. doi: 10.1109/42.363108. [DOI] [PubMed] [Google Scholar]
- Huesman RH, Derenzo SE, Cahoon JL, Geyer AB, Moses WW, Uber DC, Vuletich T, Budinger TF. Orbiting transmission source for positron tomography. IEEE Trans. Nucl. Sci. 1988;35:735–739. [Google Scholar]
- Huesman RH, Klein GJ, Moses WW, Qi J, Reutter BW, Virador PRG. List-mode maximum-likelihood reconstruction applied to positron emission mammography (PEM) with irregular sampling. IEEE Trans. Med. Imag. 2000;19:532–537. doi: 10.1109/42.870263. [DOI] [PubMed] [Google Scholar]
- Keesing DB, Pal D, O'Sullivan JA, Komarov S, Wu H, Tai YC. System modeling of a DOI-capable half-ring PET insert device for breast cancer imaging. IEEE Nuclear Science Symposium Conference Record.2008. pp. 4218–4222. [Google Scholar]
- Kinahan PE, Hasegawa BH, Beyer T. X-ray-based attenuation correction for positron emission tomography/computed tomography scanners. Sem. Nucl. Med. 2003;33:166–179. doi: 10.1053/snuc.2003.127307. [DOI] [PubMed] [Google Scholar]
- Komarov SA, Wu H, Keesing DB, O'Sullivan JA, Tai YC. Compton scattering in clinical PET/CT with high resolution half ring PET insert device. IEEE Trans. Nucl. Sci. 2010;57:1045–1051. doi: 10.1109/TNS.2010.2046754. [DOI] [PMC free article] [PubMed] [Google Scholar]
- Lewellen T, Karp J. In: Emission Tomography: The Fundamentals of PET and SPECT. Wernick MN, Aarsvold JN, editors. 2004. p. 187. [Google Scholar]
- Markiewicz PJ, Reader AJ, Tamal M, Julyan PJ, Hastings DL. An advanced analytic method incorporating the geometrical properties of scanner and radiation emissions into the system model for the true component of 3D PET data. IEEE Nuclear Science Symposium/Medical Imaging Conference.2005. pp. 2310–2314. [Google Scholar]
- Mumcuoğlu EU, Leahy R, Cherry SR, Zhou Z. Fast gradient-based methods for Bayesian reconstruction of transmission and emission PET images. IEEE Trans. Med. Imag. 1994;13(4):687–701. doi: 10.1109/42.363099. [DOI] [PubMed] [Google Scholar]
- Mumcuoğlu EU, Leahy RM, Cherry SR. Bayesian reconstruction of PET images: methodology and performance analysis. Phys. Med. Biol. 1996;41:1777–1807. doi: 10.1088/0031-9155/41/9/015. [DOI] [PubMed] [Google Scholar]
- O'Sullivan JA, Benac J. Alternating minimization algorithms for transmission tomography. IEEE Trans. Med. Imag. 2007;26(3):283–297. doi: 10.1109/TMI.2006.886806. [DOI] [PubMed] [Google Scholar]
- Pal D, O'Sullivan JA, Wu H, Janecek M, Tai YC. 2D linear and iterative reconstruction algorithms for a PET-insert scanner. Phys. Med. Biol. 2007;52:4293–4310. doi: 10.1088/0031-9155/52/14/018. [DOI] [PubMed] [Google Scholar]
- Park SJ, Rogers WL, Clinthorne NH. Effects of positron range and annihilation photon acolinearity on image resolution of a Compton PET. IEEE Trans. Nucl. Sci. 2007;54:1543–1552. [Google Scholar]
- Pratx G, Levin C. Online detector response calculations for high-resolution PET image reconstruction. Phys. Med. Biol. 2011;56:4023–4040. doi: 10.1088/0031-9155/56/13/018. [DOI] [PMC free article] [PubMed] [Google Scholar]
- Qi J, Leahy RM, Cherry SR, Chatziioannou A, Farquhar TH. High-resolution 3D Bayesian image reconstruction using the microPET small-animal scanner. Phys. Med. Biol. 1998;43:1001–1013. doi: 10.1088/0031-9155/43/4/027. [DOI] [PubMed] [Google Scholar]
- Qi J, Yang Y, Zhou J, Wu Y, Cherry SR. Experimental assessment of resolution improvement of a zoom-in PET. Phys. Med. Biol. 2011;56:N165–N174. doi: 10.1088/0031-9155/56/17/N01. [DOI] [PubMed] [Google Scholar]
- Studen A, Chesi E, Cindro V, Clinthorne NH, E. Cochran BG, Honscheid K, Kagan H, Lacasta C, Llosa G, Linhart V, Mikuz M, Stankova V, Weilhammer P, Zontar D. A silicon pet probe Nuclear Instruments and Methods in Physics Research Section A. 2010. [DOI] [PMC free article] [PubMed] [Google Scholar]
- Tai YC, Wu H, Pal D, O'Sullivan JA. Virtual-pinhole PET. J. Nucl. Med. 2008;49:471–479. doi: 10.2967/jnumed.107.043034. [DOI] [PMC free article] [PubMed] [Google Scholar]
- Watson CC. New, faster, image-based scatter correction for 3D PET. IEEE Trans. Nucl. Sci. 2000;47(4):1587–1594. [Google Scholar]
- Wu H, Pal D, Song TY, O'Sullivan JA, Tai YC. Micro insert: A prototype full-ring PET device for improving the image resolution of a small-animal PET scanner. J. Nucl. Med. 2008a;49:1668–1676. doi: 10.2967/jnumed.107.050070. [DOI] [PMC free article] [PubMed] [Google Scholar]
- Wu H, Song TY, Pal D, Keesing DB, Komarov S, O'Sullivan JA, Tai YC. A high resolution PET insert system for clinical PET/CT scanners. IEEE Nuclear Science Symposium Conference Record.2008b. pp. 5442–5444. [Google Scholar]
- Yamaya T, Hagiwara N, Obi T, Yamaguchi B, Ohymama N, Kitamura K, Haseqawa T, Haneishi H, Yoshida E, Inadama N, Murayama H. Transaxial system models for jPET-D4 image reconstruction. Phys. Med. Biol. 2005;50:5339–5355. doi: 10.1088/0031-9155/50/22/009. [DOI] [PubMed] [Google Scholar]
- Zhou J, Qi J. Theoretical analysis and simulation study of a high-resolution zoom-in PET system. Phys. Med. Biol. 2009;54:5193–5208. doi: 10.1088/0031-9155/54/17/008. [DOI] [PubMed] [Google Scholar]
- Zhou J, Qi J. Adaptive imaging for lesion detection using a zoom-in PET system. IEEE Trans. Med. Imag. 2011;30:119–130. doi: 10.1109/TMI.2010.2064173. [DOI] [PMC free article] [PubMed] [Google Scholar]


