

Abstract
Persistence of Mycobacterium tuberculosis remains a significant challenge for the effective treatment of tuberculosis in humans. In animals that develop necrotic lung lesions following infection with M. tuberculosis, drug-tolerant bacilli are present and persist in an extracellular microenvironment within the necrotic cores. In this study, we examined the efficacy of drug treatment in C3HeB/FeJ (Kramnik) mice that develop lesions with liquefactive necrosis, in comparison to BALB/c mice that develop nonnecrotic lesions following aerosol challenge. To accomplish this, Kramnik and BALB/c mice were infected by aerosol with M. tuberculosis and treated for 7 to 8 weeks with monotherapy using drugs with different modes of action. The efficacy of drug therapy was quantified by enumeration of bacterial load. The progression of disease and location and distribution of bacilli within lesions were visualized using various staining techniques. In the late stages of infection, Kramnik mice developed fibrous encapsulated lung lesions with central liquefactive necrosis containing abundant extracellular bacilli, whereas BALB/c mice formed nonnecrotic lesions with primarily intracellular bacilli. Necrotic lesions in Kramnik mice showed evidence of hypoxia by pimonidazole staining. Kramnik mice were significantly more refractory to drug therapy, especially for pyrazinamide. Metronidazole showed no bactericidal activity in either model. There were significantly higher numbers of drug-resistant colonies isolated from the Kramnik mice compared to BALB/c mice. These results suggest that the Kramnik mouse model will be a valuable model to test antituberculosis drugs, especially against bacilli that persist within necrotic lesions.
INTRODUCTION
The persistent nature of Mycobacterium tuberculosis infections remains a significant problem for successful tuberculosis (TB) treatment due to the greater potential for disease relapse (65). M. tuberculosis, like other pathogenic bacteria, can adapt to a wide variety of microenvironments and survive for many months even following aggressive combination drug therapy. In controlled in vitro studies, bacilli have been shown to survive nutrient and oxygen depletion as well as microenvironments with high carbon monoxide and nitric oxide concentrations (18, 52, 64). These adaptation strategies are thought to facilitate survival of M. tuberculosis as the pulmonary environment changes due to immune-mediated pressure, sequestration of the bacilli within granulomas, and in response to chemotherapeutic treatment.
One of the hallmarks of human TB infection is the development of granulomatous inflammatory lesions with central caseous necrosis that form first in the lungs but can involve essentially any part of the body, resulting in extrapulmonary tuberculosis (24). In postprimary disease, which can occur decades after initial exposure, aggressive and more destructive cavitary lesions often develop in the apical lung lobes, which are significantly less responsive to long-term, combination drug therapy. While cavitary lesions often communicate with conducting airways, necrotic granulomas are through to be refractory to drug therapy because the microenvironment is hypoxic or microaerophilic, low in nutrients, and has a higher concentration of carbon monoxide than more normal lung parenchyma (10). These changes in the lung microenvironment are thought to trigger the bacilli to alter their metabolic profile, making them more tolerant of drug therapy, especially those therapies that are most effective against actively replicating bacilli (26, 51). In addition, encapsulation of lesions by fibrous connective tissue may represent a physical barrier to drug penetration, which was recently indicated in a study using the rabbit model (49). We have shown in animal models that develop necrotic lesions that the majority of bacilli are extracellular and admixed with debris from necrotic host cells (23). Because these lesions more closely mimic what occurs in humans with naturally occurring TB, it is desirable to evaluate any promising new TB drug regimen under similar, clinically relevant in vivo conditions. While the mouse model has proven its usefulness in TB drug development (12, 25, 33, 42, 50), the most commonly used mouse strains fail to develop organized granulomas with central necrosis. This has been the main reason other model species have been explored for drug testing (39). While other TB animal models, such as the guinea pig (4, 43), rabbit (37, 40), and nonhuman primate (36) form necrotic granulomas, each has drawbacks that limit their usefulness for preclinical drug testing (62). The nonhuman primate following a natural and experimental M. tuberculosis infection develops a variety of lesion types that more closely mimic the human disease, but widespread use of this model is cost prohibitive for extensive preclinical drug evaluations (19, 36, 62). The rabbit model forms necrotic granulomas and cavitary lesions following infection with Mycobacterium bovis and highly virulent clinical M. tuberculosis strains (37); however, the rabbit model is also expensive to maintain. Additional drawbacks include pathogen containment concerns, since rabbits shed M. tuberculosis in the urine and are highly susceptible to concurrent infections with Pasteurella and Bordetella bronchiseptica (the latter also seen in guinea pigs). The guinea pig model develops necrotic granulomas and, while more cost effective, is limited by the inability of guinea pigs to tolerate certain drug classes, resulting in dysbacteriosis and vitamin C deficiency after treatment with broad-spectrum antibiotics (43). Of practical concern, for the larger animal models a substantial quantity of drug is required to reach therapeutic tissue levels, which is generally not available during the early preclinical stages of TB drug development.
Whereas the most widely used laboratory mouse strains, such as BALB/c and C57BL/6, show little evidence of caseous necrosis and fibrosis (27, 32), a mouse strain with a recessive allele, C3HeB/FeJ mice, which was first described by Igor Kramnik et al. in the context of an M. tuberculosis infection (31), develops highly organized encapsulated necrotic lesions following a TB infection. We will from this point forward refer to this mouse model, as is also done by others, as the “Kramnik mouse model” (13). Kramnik's group observed that although C3HeB/FeJ mice had no overt immunodeficiency, they were highly susceptible to infection with TB. More importantly, these mice developed pulmonary granulomas that more closely resembled human lesions, which was a significant limitation of conventional mouse models of TB. Using a forward genetics approach, they identified a region at the 54.0-cM location of chromosome 1, termed the “super-susceptibility to tuberculosis-1” (sst1) locus, which was responsible for a decreased ability to control TB multiplication in the lungs. More importantly, the susceptible sst1 allele was shown to control the formation of caseous necrosis of pulmonary lesions (48). Further work using positional cloning identified the “intracellular pathogen resistance 1” (Ipr1) isoform of the “interferon-inducible-75” (Ifi75) gene as being responsible for a significant proportion of the increased susceptibility of the C3HeB/FeJ mice (47). Ipr1-negative mice fail to control bacterial replication to the same extent as wild-type control mice, even though major pathways controlling macrophage responsiveness (nitric oxide production and upregulation by gamma interferon [IFN-γ]) were demonstrated to be intact (66). More importantly, infected macrophages from Ipr1-negative mice preferentially die by necrosis as opposed to apoptosis. The Ipr1 gene was further shown to be inducible by type I and type II interferons and was upregulated in response to infection with TB.
In the Kramnik mouse model, the bacterial load increases to high numbers and the lung pathology progresses dramatically following a low-dose infection with TB. This has been described after an intravenous dose of 105 CFU or an aerosol infection of 15 to 30 CFU per mouse (30, 32). Necrotic microfoci are observed after 2 weeks following infection and progress to highly organized encapsulated lesions at later stages of disease, when the bacterial load in the lungs can reach 108 CFU or higher (32, 57). The lesion necrosis in the Kramnik mouse model occurs primarily in the lung, whereas the infection appears to be better controlled in other organs, such as the spleen and liver (32).
Since the C3HeB/FeJ mice displayed an increased susceptibility to TB infection but possessed an otherwise intact and functional immune system, and due to the formation of necrotic lung lesions resembling human pulmonary lesions, we hypothesized that the Kramnik mouse model may represent a novel model for preclinical screening of new, desperately needed TB drugs. This mouse model also lends itself to advanced imaging techniques, such as positron emission tomography (PET), which allowed the investigators to follow disease progression in real time (13). In this study, we compared disease progression, pathology, location of bacilli, and responsiveness to monotherapy with multiple drugs in the Kramnik mouse model and BALB/c mice, which differ in their responses to experimental TB infection.
MATERIALS AND METHODS
Animals.
Female specific-pathogen-free C3HeB/FeJ and BALB/c mice aged 6 to 8 weeks were purchased from Jackson Laboratories, Bar Harbor, ME. Mice were housed in a biosafety level III animal facility and maintained with sterile bedding, water, and mouse chow. Specific pathogen-free status was verified by testing sentinel mice housed within the colony.
Bacteria and drugs.
The M. tuberculosis Erdman strain (TMCC 107) was used for drug evaluations in mice and prepared as previously described (34, 44). Briefly, the bacteria were originally grown as a pellicle to generate low-passage-number seed lots (34). Working stocks were generated by growing to mid-log phase in Proskauer-Beck medium containing 0.05% Tween 80 (Sigma Chemical Co., St. Louis, MO) in three passages, enumerated by colony counting on 7H11 agar plates, divided into 1.5-ml aliquots, and stored at −70°C until use.
Isoniazid (INH), rifampin (RIF), pyrazinamide (PZA), and metronidazole (MET) were obtained from Sigma Chemical Co. (St. Louis, MO). Linezolid (LZD) was purchased from 21CEC (East Sussex, United Kingdom). Drugs were prepared for the treatment of the mouse models as described before (34). Briefly, RIF was dissolved in 100% dimethyl sulfoxide (DMSO), with subsequent dilution in sterile water prior to administration. The final concentration of DMSO in the drug preparation was 5%. INH and PZA were dissolved in sterile water. MET and LZD were formulated in 0.5% methylcellulose (Sigma Chemical Co.).
Aerosol infection and drug treatment schedule.
C3HeB/FeJ mice were exposed to a low-dose aerosol infection with M. tuberculosis in a Glas-Col inhalation exposure system, as previously described (44), resulting in an average of 55 bacteria in the lungs on the day of exposure. BALB/c mice were exposed to a high-dose aerosol infection with an undiluted logarithmically growing broth culture of M. tuberculosis (optical density at 800 nm of ∼1.0) (15, 41). Five mice were sacrificed the following day to determine the number of CFU implanted in the lungs.
Both mouse strains were treated with the following drugs: INH (25 mg/kg), RIF (10 mg/kg), PZA (150 mg/kg), MET (200 mg/kg), and LZD (100 mg/kg). For the BALB/c mice, drug treatment with single drugs started 2 weeks postinfection and occurred 5 days per week via oral gavage. Mice were euthanized by CO2 inhalation after 2, 4, 6, and 8 weeks of treatment. For the Kramnik mouse model, drug treatment with single drugs started 6 weeks postinfection and occurred 5 days per week via oral gavage. Mice were euthanized by CO2 inhalation after 2, 4, and 7 weeks of treatment. For all mice, the left lung lobes were homogenized and the bacterial load was determined by serial dilution on 7H11 agar plates.
Enumeration of bacterial load of lungs and spleens.
At the time of sacrifice, left lung lobes as well as the spleens were aseptically removed. The right caudal lung lobe was perfused with fixative for pathology analysis. The left lung lobes were used for bacterial enumeration and disrupted with a tissue homogenizer (Glas-Col, Inc., Terra Haute, IN). The number of viable organisms was determined by plating serial dilutions of lung homogenate on Middlebrook 7H11 agar plates supplemented with oleic acid-albumin-dextrose-catalase (OADC) (Gibco BRL, Gaithersburg, MD). Colonies were counted after at least 21 days of incubation at 37°C (34).
Enumeration of drug-resistant colonies of the lungs.
Right cranial lung lobes were collected from the drug treatment trials of the final two treatment time points from both BALB/c and Kramnik mice. The lung lobes were disrupted with a tissue homogenizer, serially diluted, and plated on Middlebrook 7H11 agar plates supplemented with OADC as well as on Middlebrook 7H11-OADC agar plates supplemented with specific concentrations of drugs for resistance enumeration. The drug-containing 7H11 plates had the following drug concentrations: 0.4 μg/ml of RIF, 4 μg/ml of INH, and 8 μg/ml of LZD. Colonies were counted after at least 21 days of incubation at 37°C and kept for 10 weeks to ensure all viable colonies would be detected. The colony detection limits of the lung and spleen plating procedure per mouse were 150 CFU and 50 CFU, respectively. The viable bacterial counts of whole organs were calculated and converted to logarithms: CFU counts were log transformed as log10 (x + 0.001), where x = total organ CFU count. The data were expressed as the mean log10 CFU ± the standard error of the mean (SEM) for each group.
Statistical analysis.
The viable CFU counts were converted to logarithms, which were then evaluated by a one-way analysis of variance (ANOVA) and two-way analysis of variance, followed by a multiple comparison analysis of variance by a one-way Tukey's test and Dunnett's test (SAS Software program, Research Triangle Park, NC). Differences were considered significant at the 95% level of confidence.
Staining procedures.
At each sacrifice, the right caudal lung lobe was infused with 10% neutral buffered formalin and preserved until processed for histopathological assessment. Five-micrometer-thick paraffin sections were stained with TB auramine-rhodamine T as per the manufacturer's instructions (Becton, Dickinson, Sparks, MD), with modifications in order to visualize bacteria as well as the surrounding lung tissue (23). A combination fluorescent staining method was used by combining auramine O and rhodamine B to stain the bacteria (AR; Becton, Dickinson), hematoxylin QS for staining tissue (HQS; Vector Laboratories, Inc., Burlingame, CA), and 4′,6-diamidino-2-phenylindole dihydrochloride for staining nuclei (DAPI; Sigma Chemical Co.). Briefly, tissue sections were dewaxed in xylene and rehydrated through a graded alcohol series and then stained with TB auramine-rhodamine T for 30 min. After washing excess stain with double-distilled water (ddH2O), slides were decolorized with TB Decolorizer (BD) until the excess stain dissolved. Counterstaining was performed with hematoxylin QS for ∼5 s. After washing of excess hematoxylin with ddH2O, slides were stained for 15 min with DAPI (200-ng/ml final concentration) and washed in ddH2O.
Lung tissue sections were stained to visualize the bacteria with the sensitive acid-fast staining method with Kinyoun's carbol fuchsin (Rowley Biochemical Institute, Danvers, MA) stain in a method described by the United States Armed Forces Institute of Pathology (1). Five-micrometer-thick paraffin sections were dewaxed in xylene and rehydrated through a graded alcohol series, rinsed with tap water, and then stained with Kinyoun's carbol fuchsin for 30 min at 60°C. Excess stain was rinsed with ddH2O, and slides were decolorized with a 3% HCl acid-alcohol wash until pale pink. Counterstaining was achieved with TB methylene blue (Becton, Dickinson) for ∼10 s as per the manufacturer's recommendations. Excess methylene blue was washed away with ddH2O.
For staining of collagen deposition, Picrosirius red was used to detect the extent of collagen fibrils made and the thickness of collagen as it ages. Picrosirius red can distinguish between new and already established collagen depositions. Newer collagen consists of thin fibrils that stain green to yellow, while older, thicker collagen stains orange to deep red (14). The staining method used was previously established by Early et al. (17). Briefly, section slides were stained with the Vector Laboratories' formulation of Mayer's iron hematoxylin (Vector Laboratories) for 8 min at room temperature and then rinsed under tap water until clear. Slides were submerged in a bath of 0.1% Sirius red in saturated picric acid (Electron Microscopy Sciences, Hatfield, PA) in the chemical hood for 1 h at room temperature. Subsequently, slides were submerged for 2 min into two acidified water baths (0.5% glacial acetic acid). Finally the slides were dehydrated for 2 min in distilled water, 3 min in 70% isopropanol, 3 min in two changes of 96% isopropanol, and 3 min in two changes of 100% isopropanol baths. The slides were cleared once in xylene and mounted with Permount mounting medium (Fisher Scientific, Pittsburg, PA).
To visualize hypoxic regions in lung tissues, the pimonidazole Hypoxyprobe (Chemicon, Burlington MA) immunohistochemical staining technique was used. Mice were intraperitoneally injected with pimonidazole hydrochloride at a dose of 60 mg/kg of body weight at least 1 h prior to sacrifice. Antigens were retrieved on deparaffinized tissues with pronase (Fisher Scientific) for 40 min at 40°C. After reduction of endogenous peroxidase activity with 3% hydrogen peroxide for 20 min, the antipimonidazole antibody Hypoxyprobe-1MAb1 (dilution 1:50; Chemicon) was added overnight at 4°C with biotinylated reagent (Vector Laboratories). The reaction was visualized by 3-amino-9-ethylcarbazole (AEC; Vector Laboratories) (5).
Pathology and microscopy.
The right caudal lobe from each mouse was collected at necropsy and fixed in 10% neutral buffered formalin in phosphate-buffered saline (PBS). Tissue sections were embedded in paraffin and cut to 5-μm thickness on a microtome. Subsequent tissue sections were mounted on glass slides, deparaffinized, and stained either with hematoxylin and eosin (H&E), picrosirius red, pimonidazole, or AR fluorescent stain. Fluorescent sections were visualized using a Nikon Intensilight mercury vapor lamp and scanned using a Nikon TE-I motorized microscope controlled by Nikon NIS Elements software (Nikon, Melville, NY) with fluorescein isothiocyanate (FITC), tetramethyl rhodamine isocyanate (TRITC), and DAPI filters. Light microscopy sections were visualized using an Olympus BX41 with an Olympus DP70 camera controlled by Olympus DP Software (Olympus, Melville, NY).
RESULTS
Disease progression over time.
BALB/c mice were infected with a high-dose aerosol (4.04 ± 0.06 log10 CFU 1 day postinfection) to achieve a similar pulmonary bacterial load to the highly susceptible Kramnik mice by the initiation of drug treatment (day 12). At day 12 after aerosol infection, the bacterial burden within the lungs had increased to 7.47 ± 0.06 log10 CFU, at which point chemotherapeutic treatment was initiated. At day 17 after aerosol infection, the lung burden had increased to 8.24 ± 0.14 log10 CFU, after which the first mice from the untreated control group started to show symptoms and had to be humanely euthanized. By day 26, only two mice remained from the untreated control group, and the pulmonary bacterial load had increased to 8.3 ± 0.7 log10 CFU, with both animals exhibiting severe clinical signs of infection (Table 1).
Table 1.
Bacterial numbers in lungs and spleens 1 day postinfection, 12 days postinfection (start of drug treatment), and after 2, 4, 6, and 8 weeks of treatment in BALB/c mice
| Treatment period and regimen | Lung lobea |
Spleena |
||
|---|---|---|---|---|
| Log10 CFU ± SEM | No. of mice with CFU/total | Log10 CFU ± SEM | No. of mice with CFU/total | |
| Day 1 | 4.04 ± 0.06 | 5/5 | ||
| Day 12 (pretreatment controls) | 7.47 ± 0.06 | 5/5 | 3.65 ± 0.20 | 5/5 |
| Day 17 | 8.24 ± 0.14 | 7/7 | 5.36 ± 0.12 | 7/7 |
| Day 26 | 8.30 ± 0.70 | 2/2 | 5.65 ± 0.13 | 2/2 |
| 2 wk | ||||
| INH | 5.50 ± 0.08 | 5/5 | 1.94 ± 0.24 | 2/5 |
| RIF | 5.11 ± 0.11 | 5/5 | 2.49 ± 0.24 | 4/5 |
| LIN | 5.55 ± 0.08 | 5/5 | 4.21 ± 0.12 | 5/5 |
| PZA | 6.11 ± 0.00 | 1/5b | 4.50 ± 0.13 | 5/5 |
| MET | 8.13 ± 0.40 | 7/7 | 5.23 ± 0.09 | 7/7 |
| 4 wk | ||||
| INH | 4.98 ± 0.03 | 5/5 | 0.00 ± 0.00 | 0/5 |
| RIF | 4.56 ± 0.08 | 5/5 | 1.90 ± 0.10 | 3/5 |
| LIN | 5.18 ± 0.12 | 5/5 | 4.14 ± 0.13 | 5/5 |
| PZA | 5.58 ± 0.07 | 5/5 | 4.82 ± 0.10 | 5/5 |
| 6 wk | ||||
| INH | 4.56 ± 0.09 | 5/5 | 0.00 ± 0.00 | 0/5 |
| RIF | 3.31 ± 0.02 | 5/5 | 0.00 ± 0.00 | 0/5 |
| LIN | 4.03 ± 0.06 | 5/5 | 3.77 ± 0.12 | 5/5 |
| PZA | 5.28 ± 0.07 | 5/5 | 4.99 ± 0.09 | 5/5 |
| 8 wk | ||||
| INH | 3.62 ± 0.06 | 5/5 | 0.00 ± 0.00 | 0/5 |
| RIF | 3.36 ± 0.29 | 5/5 | 0.34 ± 0.34 | 1/5 |
| LIN | 3.71 ± 0.16 | 4/5 | 3.70 ± 0.17 | 4/5 |
| PZA | 5.51 ± 0.09 | 5/5 | 5.15 ± 0.10 | 5/5 |
Data are mean ± standard error of the mean (SEM) log10 CFU counts in the lung and spleen and the number of mice that yielded CFU data over the total number of mice in that group.
Only one mouse yielded viable colonies due to technician error.
To optimize the infection of the Kramnik mouse model, preliminary experiments were performed to establish a nonlethal bacterial inoculum that would still allow progression of the disease to a state exhibiting caseous necrotic lesions. These initial experiments showed that an aerosol infection resulting in an average of 84.4 CFU in the lungs on day 1 after aerosolization gave rise to an average bacterial burden of 9.14 ± 0.17 log10 CFU in the lungs by day 30; however, the study had to be terminated early at day 44 due to mortalities. To reduce the mortality rate of the infected mice and increase the timeline of the experiment, a final protocol was used in which mice were infected with an average of 55 CFU, which resulted in a productive TB infection, generated necrotic lesions after 40 days, showed a stable chronic infection of about 108 CFU, and allowed survival of the Kramnik mice to at least 90 days (data not shown).
To test the efficacy of single-drug treatments, the Kramnik mice were aerosol infected with an average of 57 bacteria in the lungs per mouse. By 6 weeks of infection, the bacterial load in the lungs of the Kramnik mice had reached 6.85 log10 CFU, at which time drug therapy was initiated. The pulmonary bacterial load continued to increase slowly in the lungs of the untreated Kramnik control mice throughout the duration of the experiment. By 13 weeks of infection, Kramnik mice had an average of 7.92 log10 CFU in their lungs, at which point the experiment had to be terminated due to increased morbidity and clinical signs of disease (Table 2).
Table 2.
Bacterial numbers in lungs and spleens 1 day postinfection, 42 days postinfection (start of drug treatment), and after 2, 4, and 7 weeks of treatment in Kramnik mice
| Treatment period and regimen | Lung lobea |
Spleena |
||
|---|---|---|---|---|
| Log10 CFU ± SEM | No. of mice with CFU/total | Log10 CFU ± SEM | No. of mice with CFU/total | |
| Day 1 | 1.57 ± 0.21 | 5/5 | ||
| Day 42 (pretreatment controls) | 6.85 ± 0.44 | 5/5 | 4.48 ± 0.06 | 4/5 |
| 2 wk | ||||
| Control | 6.77 ± 0.41 | 5/5 | 4.57 ± 0.11 | 5/5 |
| INH | 5.52 ± 0.54 | 5/5 | 2.82 ± 0.09 | 5/5 |
| RIF | 5.31 ± 0.19 | 5/5 | 3.30 ± 0.23 | 5/5 |
| LIN | 6.24 ± 0.31 | 5/5 | 4.10 ± 0.12 | 5/5 |
| PZA | 6.53 ± 0.39 | 5/5 | 4.41 ± 0.24 | 5/5 |
| MET | 6.35 ± 0.39 | 5/5 | 4.52 ± 0.14 | 5/5 |
| 4 wk | ||||
| Control | 7.25 ± 0.46 | 5/5 | 4.94 ± 0.13 | 5/5 |
| INH | 5.43 ± 0.62 | 5/5 | 4.08 ± 0.16 | 5/5 |
| RIF | 4.82 ± 0.61 | 5/5 | 2.68 ± 0.18 | 5/5 |
| LIN | 5.68 ± 0.46 | 5/5 | 3.95 ± 0.26 | 5/5 |
| PZA | 6.74 ± 0.71 | 5/5 | 4.40 ± 0.29 | 5/5 |
| MET | 7.58 ± 0.45 | 5/5 | 4.67 ± 0.18 | 5/5 |
| 7 wk | ||||
| Control | 7.98 ± 0.27 | 4/4 | 5.46 ± 0.21 | 4/4 |
| INH | 6.22 ± 1.61 | 3/5 | 1.95 ± 0.49 | 4/5 |
| RIF | 5.13 ± 0.48 | 4/5 | 0.79 ± 0.49 | 2/5 |
| LIN | 4.97 ± 0.68 | 9/9 | 3.44 ± 0.36 | 9/9 |
| PZA | 6.57 ± 0.44 | 9/9 | 4.36 ± 0.21 | 9/9 |
| MET | 7.50 ± 0.42 | 5/5 | 4.86 ± 0.12 | 5/5 |
Data are log10 CFU counts in the lung and spleen and the number of mice that yielded CFU data over the total number of mice in that group.
Histopathology of the Kramnik mouse model throughout disease progression.
At the initiation of drug treatment, the Kramnik mice had small foci of mixed inflammation composed primarily of lymphocytes and macrophages (Fig. 1A). In the early stages of cell necrosis, macrophages and lymphocytes were accompanied by infiltrates of granulocytes within alveolar spaces (Fig. 1B). Necrotic foci expanded in size rapidly between 6 and 10 weeks after aerosol infection. The accumulation of necrotic and fragmented nuclei within the alveolar spaces is evident by basophilic staining with the progression of disease.
Fig 1.

Experimental infection of C3HeB/FeJ mice with the Erdman strain of M. tuberculosis progresses to form expansive lung lesions with liquefactive necrosis. (A) Nonnecrotic lung lesions in the early stages of development are composed primarily of lymphocytes and foamy macrophages. (B) With the progression of disease, there is early neutrophil infiltration centered around small foci of lesion necrosis (arrow). (C) At 10 weeks of infection, multiple lesions with central liquefactive necrosis (N) are delineated from the more normal parenchyma by a fibrous capsule (arrowhead). (D) At 13 weeks of infection, necrotic lesions extend into the surrounding parenchyma (upper square) and coalesce. (E) A higher-magnification image from the upper square in panel D shows severe necrotizing alveolitis (NA) delineated by remnants of intra-alveolar septal walls. (F) A higher-magnification image within the lower square in panel D showing a fibrous capsule delineating compressed lung parenchyma (upper right corner) from a layer of foamy macrophages (white arrowhead) and central liquefactive necrosis (N). Stain: hematoxylin and eosin.
At 10 weeks of infection, necrotic lesions were demarcated from more normal parenchyma by a capsule of fibrous connective tissue (Fig. 1C). Besides encapsulated lesions, the alveoli filled with necrotic debris (necrotizing alveolitis), but the interalveolar septae were often intact. (Fig. 1D and E). By 13 weeks of infection, an inner layer of foamy macrophages separated the necrotic core from the fibrous capsule. Therefore, in the Kramnik mouse, two distinct lesion types emerged in the lung: encapsulated lesions with liquefactive necrosis (Fig. 1F) and the more extensive but unencapsulated necrotizing alveolitis (Fig. 1E). Occasionally, the encapsulated lesions developed central cavities (Fig. 2D) lined predominately by granulocytes (Fig. 2E). Other pathology features seen were individual cell necrosis with intracellular and extracellular cholesterol clefts (Fig. 2C), and the proliferation of blood-filled vessels at the periphery of the lesions indicative of early neoangiogenesis (Fig. 2A and B).
Fig 2.

Other manifestations of experimental Erdman infection of C3HeB/FeJ mice include neovascularization, individual foamy macrophage necrosis, cholesterol cleft formation, and lesion cavitation. (A) Higher magnification of the fibrous capsule from lung lesions with liquefactive necrosis shows an increase in blood-filled capillaries and infiltrates of mixed inflammatory cells.(B) A higher magnification of the region depicted by the square in panel A showing numerous blood-filled capillaries (arrowheads). (C) Besides liquefactive necrosis, lesions have individual foamy macrophage (blue arrow) necrosis with intracellular and extracellular cholesterol clefts (black arrows). (D) Encapsulated lesions with liquefactive necrosis occasionally have central cavitation (Ca). (E) Higher-magnification image of the inner surface of the cavitary lesions depicted by the square in panel D showing a dense accumulation of neutrophils (arrowhead) admixed with foamy macrophages and lymphocytes. Stain: hematoxylin and eosin.
Picrosirius red staining was used to visualize new and established collagen fibrils within the fibrous capsule surrounding necrotic lesions (17). The picrosirius stains established a mixture of collagen deposits with thick (1.6- to 2.4-μm) fibrils that stained dark red/orange, and thin fibrils (0.8 μm or less) that stained bright yellow/green in the later stages of infection (Fig. 3A and B).
Fig 3.

Lung lesions with liquefactive necrosis from C3HeB/FeJ mice experimentally infected with the Erdman strain of M. tuberculosis are delineated by fibrous connective tissue. (A) Newer, immature collagen fibrils (F) are admixed with more mature collagen (yellow, birefringence). (B) Higher-magnification image of the fibrous capsule depicted by the rectangle in panel A showing both immature collagen fibrils (yellow, birefringence) and mature collagen fibers (red staining). Stain: picrosirius red.
Histopathology of the BALB/c mouse model throughout disease progression.
At the initiation of treatment (2 weeks after high-dose aerosol), BALB/c mice had small foci of inflammation composed predominately of lymphocytes and smaller accumulations of epithelioid macrophages with no evidence of necrosis. To evaluate the response to the high-dose aerosol infection, several untreated animals were euthanized at 3 and 4 weeks following infection, which is the time the first mice succumbed to disease. At 3 weeks, larger foci of inflammation were accompanied by early individual cell necrosis that occupied approximately 5% of the lung lobe evaluated. Necrotic cells were characterized by nuclear fragmentation (karyorrhexis) and an increase in foamy macrophages. By 4 weeks, approximately 15% of the lung parenchyma from BALB/c mice had developed multifocal to coalescing foci of granulomatous inflammation with scattered foci of necrosis (data not shown).
Acid-fast staining by Kinyoun and auramine-rhodamine.
Kinyoun carbol-fuchsin staining is an acid-fast staining technique also used clinically as an alternative to Ziehl-Neelsen stain (59). At every stage of infection, the Kinyoun staining method stained high numbers of bacteria in the Kramnik mouse lungs throughout the progression of disease (Fig. 4). At 6 weeks, primarily extracellular bacteria were concentrated within necrotic lung lesions (Fig. 4A). Few intracellular bacilli were within foamy macrophages within alveoli and within the necrotic center adjacent to the fibrous capsule. At 10 and 13 weeks of infection, the Kinyoun stain continued to detect very high numbers of extracellular bacilli within the necrotic lung lesions (Fig. 4B and C).
Fig 4.

Different staining techniques reveal phenotypic differences in bacilli in the late stage of experimental infection of C3HeB/FeJ mice with the Erdman strain of M. tuberculosis. Images A and D are serial sections of lesions from mice 6 weeks after infection. Images B and E are serial sections of lesions from mice 10 weeks after infection, and images C and F are serial sections of lesions from untreated control mice at 13 weeks after infection. Kinyoun-stained sections A, B and C detect numerous intra- and extracellular bacilli. (A) At 6 weeks of infection, bacilli are primarily intracellular, whereas at 10 weeks (B), the majority of bacteria are located within necrotic granulomas. (C) Thirteen weeks postinfection showing the center of liquefactive necrotic lung lesion positive for AFB. Auramine-rhodamine-stained sections (D, E, and F) lose the ability to detect bacilli over infection. (D) At 6 weeks, intracellular bacilli are clearly seen. Included is a magnification inset of intracellular staining. (E) At 10 weeks, the central region of necrotic granuloma is devoid of fluorescent bacilli. In inset 1, the center of the necrotic lesion has reduction in AR-positive bacilli. In inset 2, the edge of the necrotic lesion retains the majority of detectable staining. (F) At 13 weeks, the entirety of the necrotic lung lesion is without stain, except for the very edge of the rim, depicted in the inset.
The auramine-rhodamine (AR) stain combined with DAPI and hematoxylin was also used as to visualize acid-fast M. tuberculosis within the surrounding tissue by fluorescence microscopy. Over the course of the disease in the Kramnik mouse model, AR gradually stained fewer bacteria (as seen in Fig. 4D, E, and F). This gradual decrease in AR staining is first seen in the center of the necrotic lesion, which then expanded outward, ultimately resulting in the majority of bacteria becoming AR negative (Fig. 4F). At 6 weeks of infection, pockets of intracellular bacilli were seen in inflammatory foci composed of lymphocytes and foamy macrophages (Fig. 4D). At 10 weeks of infection, extracellular AR-positive bacilli were concentrated at the rim of the necrotic lesions. Very few small foci of intracellular bacilli can be found outside the collagen rim (Fig. 4E, insert 1 and insert 2). At 13 weeks of infection, few AR-positive bacilli were seen within or outside the lesion (Fig. 4F and inset).
Pulmonary granulomas in the Kramnik mouse model are hypoxic.
The hypoxic nature of necrotic TB granulomas has been reported in other animal models for tuberculosis infection, such as guinea pigs, rabbits, and nonhuman primates (23, 62), but is generally not observed in the mouse model of infection (45). We evaluated oxygen tension in the late stage of the Kramnik model using immunohistochemical detection of pimonidazole hydrochloride (Hypoxyprobe) adducts throughout the progression of disease. The use of Hypoxyprobe identified the presence of hypoxic cells around the edges of caseous granulomas when performed at 10 and 13 weeks post-aerosol infection (Fig. 5A and B). The hypoxia staining was more prominently centered around alveolar necrosis in areas of pulmonary pneumonia (Fig. 5C). As the activated intermediate of pimonidazole is only produced within viable cells under conditions of low oxygen tension, the central necrotic tissue does not directly stain with Hypoxyprobe due to a lack of intact, viable cells.
Fig 5.
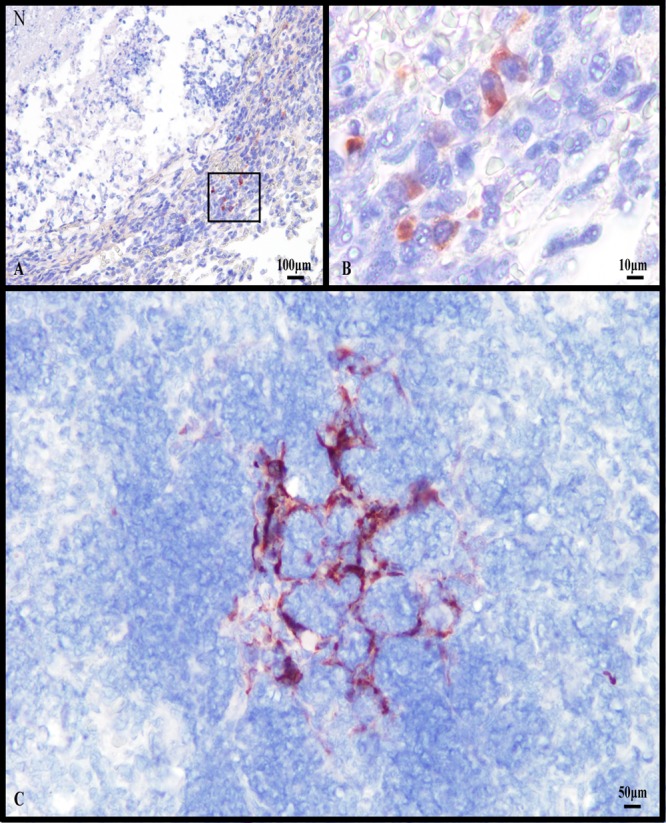
Lung lesions with liquefactive necrosis from C3HeB/FeJ mice experimentally infected with the Erdman strain of M. tuberculosis show evidence of hypoxia. (A) Immunohistochemical staining for the hypoxia marker pimonidazole within a lung lesion with liquefactive necrosis (N) showing multiple positive stained cells. (B) Higher magnification of the region depicted by the square in panel A showing multiple cells staining positive for pimonidazole adducts. (C) Viable remnants of interalveolar septal walls within a region with necrotizing alveolitis have residual cells that stain positive for pimonidazole. Counterstain: hematoxylin.
Antituberculosis single-drug treatment is less effective in the Kramnik model compared to the BALB/c mouse model.
The goal of these experiments was to investigate and compare the killing kinetics of a panel of single TB drugs in the BALB/c and Kramnik mouse models. For the purposes of these experiments, we aimed to achieve similar bacterial numbers in the lungs of both BALB/c and Kramnik mice at the initiation of drug treatment. To achieve this, BALB/c mice were infected with a high-dose aerosol (depositing ∼11,000 CFU within the lungs) in order to reach ∼108 bacilli in the lungs at the start of drug treatment (14 days postinfection). This bacterial load is similar to that reached by day 42 in Kramnik mice following a low-dose aerosol infection (∼40 to 55 CFU). Treatment cohorts of BALB/c mice were sacrificed at specific time intervals of 2, 4, 6, and 8 weeks of treatment. Treatment cohorts of the Kramnik mice were sacrificed at specific time intervals of 2, 4, and 7 weeks of treatment. Following aerosol infection but prior to initiation of drug treatment, 17 of 135 Kramnik mice showed significant weight loss and became moribund, as determined by the IACUC regulations. These animals were humanely euthanized, and the remaining animals were rerandomized into treatment groups.
All untreated and MET-treated BALB/c mice infected with ∼11,000 CFU began to show overt signs of clinical disease (ruffled fur, lethargy, and trembling) by 26 days postinfection and had to be humanely euthanized. In contrast, INH treatment in BALB/c mice showed a significant reduction in the bacterial load in the lungs at all time points versus untreated controls at the start of treatment (P < 0.0001) (Fig. 6A). In addition, the bacterial load in the lungs of BALB/c mice continued to decrease statistically for all time points evaluated (P < 0.0006). After an initial decrease of approximately 2 log10 CFU in the first 2 weeks, the bacterial load continued to decrease another 2 logs over the next 6 weeks. When we compared the activity of INH in BALB/c mice with the Kramnik mouse model, the reduction in bacterial load in the lungs of the latter was far less pronounced. After 2 weeks of treatment, the Kramnik mice showed a reduction of 1.25 log10 CFU compared to the untreated controls at the start of treatment (P > 0.1) (Fig. 6B), while after 4 and 7 weeks of treatment, the reduction in the bacterial load in lungs was smaller than that in the untreated controls at the start of treatment (P > 0.4). Comparison between treatment time points revealed no significant change in the Kramnik mouse model over time. Evaluation of BALB/c and Kramnik mice by two-way analysis of variance (ANOVA) revealed highly significant differences in the lungs following INH treatment (P < 0.0010).
Fig 6.

Isoniazid (INH) treatment at 25 mg/kg is less effective in C3HeB/FeJ mice against the Erdman strain of M. tuberculosis than in the BALB/c mouse strain. (A) In BALB/c mice, the reduction in CFU in the lung (filled symbols) and spleen (open symbols) was biphasic, whereas, in the C3HeB/FeJ mouse strain (B), the killing kinetics in the lung were attenuated, as was the efficacy in the spleen. *, untreated control mice were euthanized at day 26 due to morbidities. ND, no bacterial colonies detected (detection limit, 50 CFU).
In spleens, INH treatment was highly effective for BALB/c mice resulting in a nonculturable state at 4 weeks of treatment. At all time points, the reduction in bacterial load was highly significant compared to that in untreated controls at the start of treatment (P < 0.0001) (Fig. 6A). In the Kramnik mouse model, there was a reduction in spleen CFU; however, it failed to reach a nonculturable state. The decrease in the bacterial load in the spleen only became significantly different from the level in the untreated controls at the start of treatment after 7 weeks of INH therapy (Fig. 6B). Surprisingly, after 4 weeks of treatment, the bacterial load was higher than that observed after 2 weeks (P < 0.03).
Treatment with RIF showed very similar killing kinetics to the ones described for INH. After the initial 2 weeks of RIF treatment, BALB/c mice showed a reduction of the bacterial load in lungs of 2.36 logs versus the load in untreated controls at the start of treatment (P < 0.0001). The bacterial load in the lung continued to decrease at a highly significant rate throughout RIF treatment (Fig. 7A), except for the 6- and 8-week treatment intervals, when there was no statistically significant decrease in log CFU (P > 0.8253). After an initial decrease of ∼2.5 log10 CFU in the first 2 weeks, the bacterial load continued to decrease another 2 logs over the next 6 weeks. After 2 weeks of RIF treatment, the Kramnik mice showed a reduction in bacterial load of 1.47 logs (P < 0.0154), and after 4 weeks, the bacterial number only decreased another ∼1 log10, totaling a 2.43-log reduction versus the level in the untreated controls at the start of treatment (P < 0.0021) (Fig. 7B). At the final sacrifice point for the Kramnik mouse model, the results showed a significant reduction versus the level in the untreated controls (reduction of 2.85 logs; P < 0.0096), but there was not a significant change between 2, 4, and 7 weeks of treatment. There was no significant difference seen between BALB/c and Kramnik mice at the 2-week time point; however, for the subsequent time points, the treatment results for BALB/c and Kramnik mice were significantly different (P < 0.0011).
Fig 7.

Rifampin (RIF) treatment at 10 mg/kg is less effective in C3HeB/FeJ mice against the Erdman strain of M. tuberculosis than in the BALB/c mouse strain. (A) In BALB/c mice, the reduction in CFU in the lung (filled symbols) and spleen (open symbols) was biphasic, whereas, in the C3HeB/FeJ mouse strain (B), the killing kinetics in the lung were attenuated, as was the efficacy in the spleen. *, untreated control mice were euthanized at day 26 due to morbidities. ND, no bacterial colonies detected (detection limit, 50 CFU).
In spleens, similar results were obtained for RIF to those described for the lungs; however, they were less pronounced. Treatment with RIF was highly effective in the spleens of BALB/c mice, resulting in a nonculturable state at 6 weeks of treatment. (Only 1 colony was observed in one mouse at 8 weeks.) For all time points for the BALB/c mice, the CFU were significantly reduced compared to untreated controls at the start of treatment (P < 0.0001) (Fig. 7A). For the Kramnik mouse model, the spleens also showed a more gradual decrease in the bacterial load over time, with a dramatic decrease at the 7-week time point making it the only statistically significant time point compared to pretreatment controls (P < 0.0001) (Fig. 7B). However, the Kramnik mice failed to reach a nonculturable state. BALB/c and Kramnik mice were not significantly different throughout the course of treatment compared by two-way ANOVA.
For LZD, superior killing kinetics was observed in BALB/c mice versus Kramnik mice in lungs; however, the activity in spleen was static in both mouse models. At all time points throughout the experiment, there was an insignificant decrease in the lung bacterial load in the BALB/c strain compared to the untreated controls at treatment start and between treatment groups. In the Kramnik mouse model, there was a lack of significant drug activity early on (after 2 and 4 weeks of treatment) versus that in the untreated controls at the start of treatment. After 7 weeks of LZD treatment, a significant increase in activity was observed in the Kramnik mice, with a bacterial log reduction of 1.85 logs compared to the level in the untreated controls at the start of treatment (P < 0.0043). Comparison between treatment groups demonstrated a slight reduction in bacterial load from 2 weeks to 7 weeks of treatment (P < 0.0476) as the activity of LZD increased over time in the Kramnik mouse model. Comparison by two-way ANOVA showed that the BALB/c and Kramnik mice were significantly different throughout infection (P < 0.0200).
LZD treatment showed in the spleens of BALB/c mice an initial increase of 0.6 log in bacterial load compared to the untreated controls at the start of treatment (P < 0.017) at 2 weeks, but showed no additional statistically significant change after this (Fig. 8A). For the Kramnik mice, the bacterial load in the spleen initially showed an increase, followed by a continued decrease at every time point after the start of treatment, none of which were statistically significant compared to the start of therapy (Fig. 8B). Spleen data in BALB/c and Kramnik mice were not significantly different throughout the course of treatment compared to each other through two-way ANOVAs.
Fig 8.

Linezolid (LZD) treatment at 100 mg/kg is less effective in C3HeB/FeJ mice against the Erdman strain of M. tuberculosis than in the BALB/c mouse strain. (A) In BALB/c mice, the reduction in CFU in the lung (filled symbols) and spleen (open symbols) was biphasic, whereas, in the C3HeB/FeJ mouse strain (B), the killing kinetics in the lung were attenuated, as was the efficacy in the spleen. *, untreated control mice were euthanized at day 26 due to morbidities.
In the lungs, PZA had highly significant activity in BALB/c mice at 2, 4, 6, and 8 weeks of continuous treatment (P < 0.0001) compared to that in the untreated controls from the start of treatment (Fig. 9A). When comparing the levels of activity over the different treatment times, there was a significant change (P < 0.04) in bacterial load between weeks 2 and 4 of treatment, whereas the reduction was not statistically significant when comparing treatment groups at 4 versus 8 weeks (P > 0.5206). In the Kramnik mouse model, there was no significant change in the bacterial load in the lungs over 7 weeks of treatment (P > 0.7). The untreated controls of the Kramnik mouse model continued to have an increase in bacterial load of about 1 log10 CFU in lungs, resulting in a statistically significant reduction of the bacterial load in the PZA-treated mice versus the untreated controls (P < 0.04) (Fig. 9B).
Fig 9.

Pyrazinoic acid (PZA) treatment at 150 mg/kg is bacteriostatic in C3HeB/FeJ mice against the Erdman strain of M. tuberculosis compared the activity in the BALB/c mouse strain. (A) In BALB/c mice, the reductions in CFU in the lung (filled symbols) and spleen (open symbols) were more pronounced in the early stages of infection, but PZA was less effective late. (B) PZA treatment of C3HeB/FeJ mice prevented the progressive bacterial growth seen in control animals (diamonds) and therefore was bacteriostatic in the lung and spleen. *, untreated control mice were euthanized at day 26 due to morbidities.
In the spleens of BALB/c mice, PZA treatment showed an initial nonsignificant increase in bacterial load after 2 weeks (+1 log10 CFU), followed by a significant increase at each subsequent time point versus the untreated controls at the start of treatment (P < 0.0156). At the end of 8 weeks of treatment, the bacterial loads in spleens in BALB/c mice showed a highly significant increase from those in untreated controls at the start of treatment (+1.5 log10 CFU; P < 0.0022) (Fig. 9A). In the Kramnik mouse model, PZA activity was not significant at any time point throughout the experiment versus that of the untreated controls at the start of treatment. There was an ∼0.5-log10-CFU increase from the start of treatment to 2, 4, and 7 weeks of therapy, which then remained stable at about 4.4 log10 CFU (P > 0.1). Comparison of the data from BALB/c and Kramnik mice by means of two-way ANOVAs throughout infection showed a highly significant difference in the lung (P < 0.0049) and a nonsignificant result in the spleens of both mouse models.
MET was administered at a high dose of 200 mg/kg in order to maximize the chance of observing drug activity. Previously reported pharmacokinetic data by others described that 15 mg/kg MET was sufficient to reach a peak serum concentration of 4.6 to 11.3 μg/ml similar to that in humans (6, 8, 16). MET did not show any activity in lungs and spleen in both the BALB/c and Kramnik mouse models. Due to the lack of significant activity, BALB/c mice infected by a high-dose aerosol became moribund after 2 weeks of therapy with MET and required humane euthanasia. Therefore, only the 2-week time point was available to collect data for the BALB/c mice, and the results enumerating the bacterial load were not significantly different from those from untreated control mice (Fig. 10A). In the Kramnik mice, MET showed no significant reduction in bacterial load compared to the untreated control groups from the start of treatment (P > 0.05).
Fig 10.

Metronidazole (MET) treatment at 200 mg/kg is not effective against the Erdman strain of M. tuberculosis in either BALB/c or C3HeB/FeJ mice. (A) In the BALB/c mouse strain, MET had no effect on the reduction of CFU in the lung (filled symbols) and spleen (open symbols) and resulted in early mortality. (B) In the C3HeB/FeJ mouse strain, MET had no effect throughout the entire study in the lung and spleen. *, untreated control mice were euthanized at day 26 due to morbidities.
In both the BALB/c and Kramnik mice, MET treatment showed no observable activity in the spleen. None of the results were statistically significant compared to those from the untreated control groups (P > 0.05) (Fig. 10B).
Kramnik mice have higher numbers of drug-resistant colonies.
The high bacterial loads in the lungs at the start of drug treatment of both the BALB/c and Kramnik mouse models led us to question whether the frequency of drug-resistant mutants would increase following prolonged drug treatment. To quantify drug resistance, serial dilutions of mouse lung homogenates were simultaneously plated on 7H11 agar plates and 7H11 plates containing the drug administered to each group. BALB/c mice (which harbored 7.37 ± 0.09 log10 CFU at the start of drug treatment) showed few resistant colonies over the duration of therapy with INH, RIF, or LZD (Table 3). At each time point tested for the BALB/c mice, there were only 1 to 2 animals exhibiting a few resistant colonies.
Table 3.
Numbers of drug-susceptible and drug-resistant bacterial colonies isolated from lungsa
| Mouse group and treatment regimena | Lung datab |
|
|---|---|---|
| CFU ± SEM | No. of mice with CFU/total | |
| BALB/c mice | ||
| Start of treatment | 7.47 ± 0.06 | 5/5 |
| 6 wk, INH, 7H11 | 4.89 ± 0.09 | 5/5 |
| 6 wk, INH, R | 0.5 ± 0.5 | 1/5* |
| 8 wk, INH, 7H11 | 3.99 ± 0.07 | 5/5 |
| 8 wk, INH, R | 0.5 ± 0.5 | 1/5* |
| 6 wk, RIF, 7H11 | 3.53 ± 0.06 | 5/5 |
| 6 wk, RIF, R | 0 ± 0 | 0/5 |
| 8 wk, RIF, 7H11 | 3.37 ± 0.24 | 5/5 |
| 8 wk, RIF, R | 0.99 ± 0.61 | 2/5* |
| 6 wk, LZD, 7H11 | 4.41 ± 0.07 | 5/5 |
| 6 wk, LZD, R | 0 ± 0 | 0/5 |
| 8 wk, LZD, 7H11 | 4.24 ± 0.07 | 5/5 |
| 8 wk, LZD, R | 0.68 ± 0.68 | 1/5‡ |
| Kramnik mice | ||
| Start of treatment | 6.85 ± 0.44 | 5/5 |
| 4 wk, control, 7H11 | 7.58 ± 0.42 | 5/5 |
| 7 wk, control, 7H11 | 8.26 ± 0.52 | 4/4 |
| 4 wk, INH, 7H11 | 4.91 ± 0.67 | 5/5 |
| 4 wk, INH, R | 1.26 ± 1.26 | 1/5† |
| 7 wk, INH, 7H11 | 5.72 ± 1.11 | 5/5 |
| 7 wk, INH, R | 4.47 ± 1.83 | 3/5 |
| 4 wk, RIF, 7H11 | 4.39 ± 0.64 | 5/5 |
| 4 wk, RIF, R | 0 ± 0 | 0/5 |
| 7 wk, RIF, 7H11 | 5.47 ± 0.68 | 4/4 |
| 7 wk, RIF, R | 3.57 ± 1.26 | 3/4 |
| 4 wk, LZD, 7H11 | 5.47 ± 0.46 | 5/5 |
| 4 wk, LZD, R | 0 ± 0 | 0/5 |
| 7 wk, LZD, 7H11 | 4.96 ± 0.94 | 5/5 |
| 7 wk, LZD, R | 0 ± 0 | 0/5 |
R, resistant colonies.
The data shown are log10 CFU counts in the lung and the number of mice that yielded CFU data over the total number of mice that group. Right upper lung lobes were plated on 7H11 plates with and without drugs (INH, 4 mg/ml; RIF, 0.4 mg/ml; and LZD, 8 mg/ml). For the last two treatment time points for both BALB/c and Kramnik models, lobes were plated on drug-containing plates.
, only 1 colony per mouse detected; †, 1 mouse with a high number of colonies, a potential outlier; ‡, 1 mouse with 8 colonies.
The Kramnik mouse model (which had 6.85 ± 0.44 log10 CFU at the start of drug treatment) showed a dramatic increase in resistant colonies from 4 weeks to 7 weeks of single-drug treatment. After treatment with INH for 4 weeks, 1 mouse out of 5 showed a small number of resistant colonies, whereas after 7 weeks of treatment, 3 of 5 mice had a large number (4.47 ± 1.83 log10 CFU) of resistant colonies. Treatment with RIF resulted in the presence of resistant colonies only after 7 weeks on treatment, in which 3 of 4 animals exhibited 3.57 ± 1.26 log10 CFU of resistant colonies. Throughout the duration of treatment with LZD, no culturable resistant colonies were observed in the Kramnik mice (Table 3). For PZA, drug resistance was not evaluated by culturing due to the difficulty of observing robust PZA activity on drug-containing plates (56).
DISCUSSION
In this study, we compared the responses of the novel C3HeB/FeJ Kramnik mouse model to the more conventional BALB/c mouse model following aerosol infection with M. tuberculosis and monotherapy using a panel of five clinical drugs. This study was driven by the need for a mouse model of TB infection that more closely mimics the pathology of naturally occurring TB in humans, to facilitate more realistic in vivo drug testing against nonreplicating or slowly replicating persistent TB.
The most unique feature of the lung lesions that developed in Kramnik mice was the formation of multiple discrete encapsulated lesions with central liquefactive necrosis as well as areas of necrotizing alveolitis. In contrast, the more widely used BALB/c strain of mice developed less extensive foci of mixed inflammatory cells with minimal cellular necrosis. Unlike the BALB/c mouse strain, the Kramnik mouse model showed evidence of lesion hypoxia, fibrosis, liquefactive necrosis, and occasional cavity formation. The use of immunohistochemistry to detect adducts of pimonidazole as an indicator of hypoxia showed that residual viable cells within necrotic lesions were under hypoxic stress at the time points tested. For most late time points, pimonidazole staining was most often concentrated in clusters of foamy macrophages rather than areas of liquefactive necrosis. This can be explained either by a lack of viable cells capable of metabolizing pimonidazole or the regions of liquefactive necrosis being anoxic rather than hypoxic.
A critical component of lung lesions of TB-infected Kramnik mice was the deposition of collagen that delineated foci of liquefactive necrosis from more normal lung parenchyma. The picrosirius red staining showed a mixture of mature and immature collagen fibrils, suggesting that there was continuous remodeling of the capsule and that the granuloma is therefore a highly dynamic structure, which is in contrast to common belief.
Another important feature of the encapsulated lesions in the Kramnik model was the accumulation of macrophages with abundant foamy cytoplasm that formed the innermost layer of viable cells (located directly on the inside the fibrous capsule). Although the role foamy macrophages play is unknown, studies suggest that they contribute to the deposition of collagen via the production of granulocyte-macrophage colony-stimulating factor (GM-CSF) (35, 54). In both Kramnik and BALB/c mice, the accumulation of foamy macrophages was often accompanied by cholesterol deposition derived from the cell membrane of necrotic host cells. It has been shown primarily using in vitro cultures that bacilli in microenvironments of hypoxia and nutrient deprivation adapt by altering their metabolism to utilize lipids (28, 38). Studies have shown upregulation of genes for lipid sequestration and metabolism in human patients infected with TB, representing pathogen-mediated dysregulation of host lipid metabolism (28).
Although commonly used as an alternative to the mouse model, evaluation of drug therapy in the guinea pig model that develops necrotic granulomas has presented some challenges. Guinea pigs clear the first-line TB drugs (22), as well as moxifloxacin and PA-824 (4), very quickly (even more rapidly than mice), resulting in the need for much larger drug doses in order to achieve similar drug exposures over time. This leads to substantial drug intolerability, as guinea pigs are especially susceptible to perturbations in the normal intestinal flora caused by broad-spectrum antibiotics. Although many methods have been attempted to add vitamin supplements and probiotics to their diet (43), adverse effects may still occur and could potentially skew study results. Interestingly though, several studies to date have shown that guinea pigs, compared directly with mice, have greater and faster bacterial killing after drug treatment (3, 4, 43). This is surprising as one would expect the bacteria within the caseous necrotic lesions of infected guinea pigs to be more drug refractory (due to the slowed metabolism of the bacteria and/or drug penetration issues) versus the bacilli in the inflammatory lesions of the classical mouse model.
Healing of lesions by dystrophic mineralization, which is a prominent pathological feature in human TB and in the guinea pig TB model (7, 46, 55), is not a response observed readily in the Kramnik mouse model. There are species differences in the rate of mineral deposition, and the shortened survival time may explain why mineralization is not seen in the Kramnik and other mouse models of TB.
To visualize the TB bacilli in the lung lesions of the Kramnik mice during disease progression, different acid-fast stains were used. In an earlier report, we described a novel triple-staining method which identified TB bacilli as well as the surrounding tissues in the mice and guinea pigs (23). While the vast majority of bacilli identified in pulmonary lesions of BALB/c mice were intracellular, the majority of bacilli present in the Kramnik mice were extracellular. In addition, comparison of the auramine-rhodamine and Kinyoun carbol-fuchsin staining methods revealed differences in the number of stained bacteria identified in the Kramnik mouse model over the course of infection. In the Kramnik mice, the bacilli appear to lose their AR acid fastness as the disease progressed into large hypoxic, liquefactive, necrotic granulomas. The decrease in AR-positive bacilli is noticeable starting from the center of the necrotic lesion and continuing outward throughout disease progression until eventually all bacteria within the lesion core become AR negative. This is in sharp contrast with the results obtained after Kinyoun staining, where the bacteria within the granulomas remain positively stained over time. Although the exact target of both staining methods is still being debated (53), these results suggest that the lack of detection with AR over time is due to a change in the bacterial phenotype. As AR still stains bacteria under hypoxic conditions in vitro (53), as well as in guinea pig lung lesions (23), it is unclear why the particular bacterial population in the Kramnik mice causes these negative staining results. Genetic approaches will be required to examine the changes in the bacterial phenotype in the lungs of the Kramnik mice.
To assess the suitability of the Kramnik mouse model for evaluation of new TB drugs and treatment regimens, the efficacies of a panel of five single drugs were compared in Kramnik mice that form necrotic lesions versus BALB/c mice solely forming nonnecrotic or inflammatory lesions. Examination of the bacterial load in the lungs and the spleens revealed that Kramnik mice were significantly more refractory to drug treatment using INH, RIF, LZD, or PZA monotherapy than BALB/c mice. This refractory effect in the Kramnik mice was most pronounced for PZA, as PZA treatment was highly effective in the BALB/c mice (99% of bacteria were eradicated in 4 weeks), whereas no decrease in bacterial CFU was observed in the lungs of the Kramnik mice from the start of treatment. At 150 mg/kg, PZA contained the bacterial load in the lungs of the Kramnik mouse model over the course of treatment, whereas in the untreated Kramnik controls, there was a slowed but continuous growth observed (1 log10 over 7 weeks). This is in contrast to what we expected from previous in vitro data describing PZA as primarily active against persistent bacilli (21). Earlier in vitro data identified some of the conditions required for potentiation of PZA activity. Anaerobic conditions have been shown to enhance the activity of PZA, and older cultures of TB are somewhat more sensitive to PZA (63, 68). PZA is known to show better in vitro activity at lower pH (68) and to have better efficacy against intracellular bacilli in the macrophage infection model (11). To date, limited information is available on what bacterial population PZA may target in vivo. A few earlier reports showed activity of PZA against tuberculosis using mouse models infected via different routes and with different inoculum sizes (reviewed in reference 58). The reason for the failure to observe any cidal activity in the Kramnik mouse model cannot merely be attributed to the extracellular nature of the bacteria or penetration across the granuloma as PZA has been shown to have activity in the guinea pig model of infection (2). It is remarkable that the mechanism of action for PZA, one of the three pillar TB drugs, remains largely a mystery after many years. This study was limited as only a single PZA drug dose was tested, and therefore it is possible that a higher drug dose might show clear bactericidal activity in vivo. As the lack of PZA activity in the Kramnik mouse model might have significant clinical implications, it will be crucial to investigate a higher dose range in this mouse model.
Metronidazole, on the other hand, did not show any activity in either mouse infection model, even though excessively high doses were administered. MET, a drug that requires anaerobic conditions for activation, has been previously reported to lack demonstrable activity in mice (8, 16), whose lesions fail to become hypoxic (60), but has shown demonstrable activity in rabbits against M. bovis (62) and is currently being evaluated in nonhuman primates. Metronidazole also lacked activity in guinea pigs, but the conclusions were limited due to the increased inflammation in the lung and toxicity of the drug (22). While there are currently no clinical data confirming the activity of MET in TB patients, the additional evaluation in other animal models might indicate which conditions are required in order to observe MET activity in vivo.
In the drug studies described here, the bacillary burden in the lungs of both mouse models was high at the start of treatment (6.85 log10 CFU in Kramnik mice and 7.45 log10 CFU in BALB/c mice), which increases the likelihood of drug resistance following single-drug treatment. Although the bacterial load at the start of treatment in BALB/c mice was approximately four times higher than in the Kramnik model, only few single-drug-resistant mutants in a minority of BALB/c mice were observed for INH and RIF after 6 and 8 weeks. This is in great contrast with the drug resistance observed in the Kramnik mouse model, where we observed a substantial increase in the number of bacilli that were drug resistant after 7 weeks of treatment with INH (up to 4.47 log10 resistant CFU) or RIF (up to 5.72 log10 resistant CFU). The exact reason for the higher number of drug-resistant bacteria following treatment in the Kramnik mouse model is not clear, but it is crucial to understand the mechanism as this could have significant clinical implications.
We speculate that the high prevalence of resistant mutants might be due to multiple causes; such as having subtherapeutic drug exposure levels, a weakened immune response, or an altered bacterial mutation rate in the Kramnik mice. First, due to the highly organized and encapsulated nature of the granulomas observed in the Kramnik mice, it is possible that bacteria within the granulomas received subtherapeutic exposure levels of drug due to poor drug penetration. This could facilitate survival and selection of mutants with low-level drug resistance in Kramnik mice, which would not be observed in the primarily inflammatory lesions of BALB/c mice. For moxifloxacin, a recent elegant study measured an increased drug distribution in cellular regions of granulomas and uptake by macrophages, but decreased penetration into the cores of necrotic rabbit lesions (49). The same was predicted for the standard clinical drugs via a recent mathematical modeling study and confirmed through plasma and tissue pharmacokinetic studies by the same group (29). A second explanation for the increased frequency of drug resistance in Kramnik mice might be that the precursor mutation frequencies in both mouse models are in fact the same, but the immune pressure in the BALB/c mice selectively kills drug-resistant mutants that are less fit for in vivo survival than their drug-susceptible counterparts due to its fully activated immune response. Although the C3HeB/FeJ mice do not have any broadly systemic immune deficiencies, an altered or weakened immune response as the result of inactivation of the Ipr1 gene may selectively decrease immune-mediated pressure on drug-resistant mutants. Recent studies with athymic nude mice support this finding, revealing a remarkable propensity to select drug-resistant mutants. Daily treatment with human-equivalent doses of RIF-INH-PZA for 2 months followed by RIF-INH selected INH-resistant mutants in the majority of mice, and this was only prevented by the addition of ethambutol (EMB) (67). In support of this hypothesis, clinical studies of individuals coinfected with HIV and TB and treated with INH and rifapentine (61) or rifabutin and INH (9) were significantly more likely to develop rifamycin monoresistance, especially in patients with the lowest CD4 T cell counts. Rifamycin resistance is rarely observed in immunocompetent individuals, even under conditions of poor treatment compliance, which facilitates the emergence of drug resistance, implicating a positive role for host immunity in suppression of acquired drug resistance. A third explanation, and perhaps the most intriguing one, is the occurrence of a heightened bacterial mutation frequency within the hypoxic regions of necrotic granulomas found in the Kramnik mouse model. Recently, a study using latently infected nonhuman primates described that hypoxic conditions can suppress the expression of DNA repair enzymes, thereby resulting in higher mutation frequencies (20). Further studies examining the specific mutations of the drug-resistant colonies and the mutation frequencies at different times following treatment are necessary to answer these questions and are under way. Nevertheless, the increased resistance observed in the Kramnik mouse model, which shows clinical relevance, might be an additional benefit of the model to assess resistance of single drugs or drug regimens before entering in clinical trials.
It is important to note that the Kramnik mouse is a highly susceptible mouse model and that there is a natural variability and narrow margin for an infectious inoculum to establish a chronic infection within the animals themselves. As shown by our data, a higher infectious inoculum (∼100 CFU) can result in a faster development of disease, while a lower inoculum (∼50 CFU) will allow for a slower progression of chronic disease. This adaptability can be useful depending on the experimental aim.
In these studies, we showed that the Kramnik mouse responded to aerosol infection with the formation of hypoxic, encapsulated lung lesions with liquefactive necrosis, which contained numerous extracellular bacilli that were less susceptible to drug therapy than those in BALB/c mice. In contrast, BALB/c mice developed less extensive foci of mixed inflammatory cells that harbored primarily intracellular bacilli and had minimal individual cellular necrosis. Using these two models, we examined the effect lesion morphology had on the response to treatment with a panel of clinically relevant TB drugs that differed in their modes of action. Overall, the results from the experiments presented here demonstrate that the Kramnik mouse model has promise to evaluate novel preclinical drugs in a more stringent animal model possessing liquefactive necrotic granulomas containing persisting bacteria.
ACKNOWLEDGMENTS
We acknowledge the staff of the Laboratory Animal Resources at Colorado State University (CSU) for their animal care. We are grateful for the experimental assistance of Marta Lishnevsky and Alan Schenkel (Colorado State University) for the picrosirius red staining approach, Mercedes Gonzalez-Juarrero (Colorado State University) for scientific discussion, and Phil Chapman (Colorado State University) for statistical support.
This work was supported by the Bill and Melinda Gates Foundation under Drug Accelerator grant ID no. 42589, “Assay Standardization,” and National Institutes of Health (NIH) contract NO1 AI-95385 at Colorado State University, Fort Collins.
Footnotes
Published ahead of print 2 April 2012
REFERENCES
- 1. AFIP 1968. Manual of histological staining methods of the Armed Forces Institute of Pathology, 3rd ed McGraw Hill Publications, New York, NY [Google Scholar]
- 2. Ahmad Z, et al. 2011. Dose-dependent activity of pyrazinamide in animal models of intracellular and extracellular tuberculosis. Antimicrob. Agents Chemother. 55:1527–1532 [DOI] [PMC free article] [PubMed] [Google Scholar]
- 3. Ahmad Z, et al. 2009. Biphasic kill curve of isoniazid reveals the presence of drug-tolerant, not drug-resistant, Mycobacterium tuberculosis in the guinea pig. J. Infect. Dis. 200:1136–1143 [DOI] [PubMed] [Google Scholar]
- 4. Ahmad Z, et al. 2010. Comparison of the ‘Denver regimen’ against acute tuberculosis in the mouse and guinea pig. J. Antimicrob. Chemother. 65:729–734 [DOI] [PMC free article] [PubMed] [Google Scholar]
- 5. Aly S, et al. 2006. Oxygen status of lung granulomas in Mycobacterium tuberculosis-infected mice. J. Pathol. 210:298–305 [DOI] [PubMed] [Google Scholar]
- 6. Barry CE, Boshoff HI, Dowd CS. 2004. Prospects for clinical introduction of nitroimidazole antibiotics for the treatment of tuberculosis. Curr. Pharm. Des. 10:3239–3262 [DOI] [PubMed] [Google Scholar]
- 7. Basaraba RJ. 2008. Experimental tuberculosis: the role of comparative pathology in the discovery of improved tuberculosis treatment strategies. Tuberculosis (Edinb.) 88(Suppl 1):S35–S47 [DOI] [PubMed] [Google Scholar]
- 8. Brooks JV, Furney SK, Orme IM. 1999. Metronidazole therapy in mice infected with tuberculosis. Antimicrob. Agents Chemother. 43:1285–1288 [DOI] [PMC free article] [PubMed] [Google Scholar]
- 9. Burman W, et al. 2006. Acquired rifamycin resistance with twice-weekly treatment of HIV-related tuberculosis. Am. J. Respir. Crit. Care Med. 173:350–356 [DOI] [PubMed] [Google Scholar]
- 10. Canetti G. 1955. The tubercle bacillus in the pulmonary lesion of man: histobacteriology and its bearing on the therapy of pulmonary tuberculosis. Springer Publication Co., New York, NY [Google Scholar]
- 11. Crowle AJ, Sbarbaro JA, May MH. 1986. Inhibition by pyrazinamide of tubercle bacilli within cultured human macrophages. Am. Rev. Respir. Dis. 134:1052–1055 [DOI] [PubMed] [Google Scholar]
- 12. Davies GR, Pym AS, Mitchison DA, Nuermberger EL, Grosset JH. 2007. Evaluation of new antituberculosis drugs in mouse models. Antimicrob. Agents Chemother. 51:403–404 (Letter.) [DOI] [PMC free article] [PubMed] [Google Scholar]
- 13. Davis SL, et al. 2009. Noninvasive pulmonary [18F]-2-fluoro-deoxy-d-glucose positron emission tomography correlates with bactericidal activity of tuberculosis drug treatment. Antimicrob. Agents Chemother. 53:4879–4884 [DOI] [PMC free article] [PubMed] [Google Scholar]
- 14. Dayan D, Hiss Y, Hirshberg A, Bubis JJ, Wolman M. 1989. Are the polarization colors of picrosirius red-stained collagen determined only by the diameter of the fibers? Histochemistry 93:27–29 [DOI] [PubMed] [Google Scholar]
- 15. De Groote MA, et al. 2011. Comparative studies evaluating mouse models used for efficacy testing of experimental drugs against Mycobacterium tuberculosis. Antimicrob. Agents Chemother. 55:1237–1247 [DOI] [PMC free article] [PubMed] [Google Scholar]
- 16. Dhillon J, Allen BW, Hu Y-M, Coates ARM, Mitchison DA. 1998. Metronidazole has no antibacterial effect in Cornell model murine tuberculosis. Int. J. Tuberc. Lung Dis. 2:736–742 [PubMed] [Google Scholar]
- 17. Early MA, et al. 2009. Non-invasive diagnosis of early pulmonary disease in PECAM-deficient mice using infrared pulse oximetry. Exp. Mol. Pathol. 87:152–158 [DOI] [PMC free article] [PubMed] [Google Scholar]
- 18. Ehlers S. 2009. Lazy, dynamic or minimally recrudescent? On the elusive nature and location of the mycobacterium responsible for latent tuberculosis. Infection 37:87–95 [DOI] [PubMed] [Google Scholar]
- 19. Flynn JL, et al. 2003. Non-human primates: a model for tuberculosis research. Tuberculosis (Edinb.) 83:116–118 [DOI] [PubMed] [Google Scholar]
- 20. Ford CB, et al. 2011. Use of whole genome sequencing to estimate the mutation rate of Mycobacterium tuberculosis during latent infection. Nature Genetics 43:482–486 [DOI] [PMC free article] [PubMed] [Google Scholar]
- 21. Heifets L, Lindholm-Levy P. 1992. Pyrazinamide sterilizing activity in vitro against semidormant Mycobacterium tuberculosis bacterial populations. Am. Rev. Respir. Dis. 145:1223–1225 [DOI] [PubMed] [Google Scholar]
- 22. Hoff DR, et al. 2008. Metronidazole lacks antibacterial activity in guinea pigs infected with Mycobacterium tuberculosis. Antimicrob. Agents Chemother. 52:4137–4140 [DOI] [PMC free article] [PubMed] [Google Scholar]
- 23. Hoff DR, et al. 2011. Location of intra- and extracellular M. tuberculosis populations in lungs of mice and guinea pigs during disease progression and after drug treatment. PLoS One 6:e17550. [DOI] [PMC free article] [PubMed] [Google Scholar]
- 24. Hunter RL, Jagannath C, Actor JK. 2007. Pathology of postprimary tuberculosis in humans and mice: contradiction of long-held beliefs. Tuberculosis (Edinb.) 87:267–278 [DOI] [PubMed] [Google Scholar]
- 25. Jain SK, et al. 2007. Accelerated detection of Mycobacterium tuberculosis genes essential for bacterial survival in guinea pigs, compared with mice. J. Infect. Dis. 195:1634–1642 [DOI] [PubMed] [Google Scholar]
- 26. Kaplan G, et al. 2003. Mycobacterium tuberculosis growth at the cavity surface: a microenvironment with failed immunity. Infect. Immun. 71:7099–7108 [DOI] [PMC free article] [PubMed] [Google Scholar]
- 27. Keller C, Lauber J, Blumenthal A, Buer J, Ehlers S. 2004. Resistance and susceptibility to tuberculosis analysed at the transcriptome level: lessons from mouse macrophages. Tuberculosis (Edinb.) 84:144–158 [DOI] [PubMed] [Google Scholar]
- 28. Kim MJ, et al. 2010. Caseation of human tuberculosis granulomas correlates with elevated host lipid metabolism. EMBO Mol. Med. 2:258–274 [DOI] [PMC free article] [PubMed] [Google Scholar]
- 29. Kjellsson MC, et al. 2012. Pharmacokinetic evaluation of the penetration of antituberculosis agents in rabbit pulmonary lesions. Antimicrob. Agents Chemother. 56:446–457 [DOI] [PMC free article] [PubMed] [Google Scholar]
- 30. Kramnik I. 2008. Genetic dissection of host resistance to Mycobacterium tuberculosis: the sst1 locus and the Ipr1 gene. Curr. Top. Microbiol. Immunol. 321:123–148 [DOI] [PubMed] [Google Scholar]
- 31. Kramnik I, Demant P, Bloom BB. 1998. Susceptibility to tuberculosis as a complex genetic trait: analysis using recombinant congenic strains of mice. Novartis Found. Symp. 217:120–132 [DOI] [PubMed] [Google Scholar]
- 32. Kramnik I, Dietrich WF, Demant P, Bloom BR. 2000. Genetic control of resistance to experimental infection with virulent Mycobacterium tuberculosis. Proc. Natl. Acad. Sci. U. S. A. 97:8560–8565 [DOI] [PMC free article] [PubMed] [Google Scholar]
- 33. Lenaerts AJ, Gruppo V, Brooks JV, Orme IM. 2003. Rapid in vivo screening of experimental drugs for tuberculosis using gamma interferon gene-disrupted mice. Antimicrob. Agents Chemother. 47:783–785 [DOI] [PMC free article] [PubMed] [Google Scholar]
- 34. Lenaerts AJ, et al. 2005. Preclinical testing of the nitroimidazopyran PA-824 for activity against Mycobacterium tuberculosis in a series of in vitro and in vivo models. Antimicrob. Agents Chemother. 49:2294–2301 [DOI] [PMC free article] [PubMed] [Google Scholar]
- 35. Li M, et al. 2011. Emergence of fibroblasts with a proinflammatory epigenetically altered phenotype in severe hypoxic pulmonary hypertension. J. Immunol. 187:2711–2722 [DOI] [PMC free article] [PubMed] [Google Scholar]
- 36. Lin PL, et al. 2006. Early events in Mycobacterium tuberculosis infection in cynomolgus macaques. Infect. Immun. 74:3790–3803 [DOI] [PMC free article] [PubMed] [Google Scholar]
- 37. Manabe YC, et al. 2008. The aerosol rabbit model of TB latency, reactivation and immune reconstitution inflammatory syndrome. Tuberculosis (Edinb.) 88:187–196 [DOI] [PMC free article] [PubMed] [Google Scholar]
- 38. Miner MD, Chang JC, Pandey AK, Sassetti CM, Sherman DR. 2009. Role of cholesterol in Mycobacterium tuberculosis infection. Indian J. Exp. Biol. 47:407–411 [PubMed] [Google Scholar]
- 39. Munoz-Elias EJ, et al. 2005. Replication dynamics of Mycobacterium tuberculosis in chronically infected mice. Infect. Immun. 73:546–551 [DOI] [PMC free article] [PubMed] [Google Scholar]
- 40. Nedeltchev GG, et al. 2009. Extrapulmonary dissemination of Mycobacterium bovis but not Mycobacterium tuberculosis in a bronchoscopic rabbit model of cavitary tuberculosis. Infect. Immun. 77:598–603 [DOI] [PMC free article] [PubMed] [Google Scholar]
- 41. Nuermberger E, et al. 2006. Combination chemotherapy with the nitroimidazopyran PA-824 and first-line drugs in a murine model of tuberculosis. Antimicrob. Agents Chemother. 50:2621–2625 [DOI] [PMC free article] [PubMed] [Google Scholar]
- 42. Nuermberger EL, et al. 2004. Moxifloxacin-containing regimens of reduced duration produce a stable cure in murine tuberculosis. Am. J. Respir. Crit. Care Med. 170:1131–1134 [DOI] [PubMed] [Google Scholar]
- 43. Ordway DJ, et al. 2010. Evaluation of standard chemotherapy in the guinea pig model of tuberculosis. Antimicrob. Agents Chemother. 54:1820–1833 [DOI] [PMC free article] [PubMed] [Google Scholar]
- 44. Orme IM. 1996. Immune responses in animal models. Curr. Top. Microbiol. Immunol. 215:181–196 [DOI] [PubMed] [Google Scholar]
- 45. Orme IM. 2003. The mouse as a useful model of tuberculosis. Tuberculosis 83:112–115 [DOI] [PubMed] [Google Scholar]
- 46. Palanisamy GS, et al. 2009. Clinical strains of Mycobacterium tuberculosis display a wide range of virulence in guinea pigs. Tuberculosis (Edinb.) 89:203–209 [DOI] [PubMed] [Google Scholar]
- 47. Pan H, et al. 2005. Ipr1 gene mediates innate immunity to tuberculosis. Nature 434:767–772 [DOI] [PMC free article] [PubMed] [Google Scholar]
- 48. Pichugin AV, Yan BS, Sloutsky A, Kobzik L, Kramnik I. 2009. Dominant role of the sst1 locus in pathogenesis of necrotizing lung granulomas during chronic tuberculosis infection and reactivation in genetically resistant hosts. Am. J. Pathol. 174:2190–2201 [DOI] [PMC free article] [PubMed] [Google Scholar]
- 49. Prideaux B, et al. 2011. High-sensitivity MALDI-MRM-MS imaging of moxifloxacin distribution in tuberculosis-infected rabbit lungs and granulomatous lesions. Anal. Chem. 83:2112–2118 [DOI] [PMC free article] [PubMed] [Google Scholar]
- 50. Rosenthal IM, et al. 2006. Potent twice-weekly rifapentine-containing regimens in murine tuberculosis. Am. J. Respir. Crit. Care Med. 174:94–101 [DOI] [PMC free article] [PubMed] [Google Scholar]
- 51. Russell DG, Cardona PJ, Kim MJ, Allain S, Altare F. 2009. Foamy macrophages and the progression of the human tuberculosis granuloma. Nat. Immunol. 10:943–948 [DOI] [PMC free article] [PubMed] [Google Scholar]
- 52. Rustad TR, Sherrid AM, Minch KJ, Sherman DR. 2009. Hypoxia: a window into Mycobacterium tuberculosis latency. Cell. Microbiol. 11:1151–1159 [DOI] [PubMed] [Google Scholar]
- 53. Ryan GJ, et al. 2010. Multiple M. tuberculosis phenotypes in mouse and guinea pig lung tissue revealed by a dual-staining approach. PLoS One 5:e11108. [DOI] [PMC free article] [PubMed] [Google Scholar]
- 54. Schnoor M, et al. 2008. Production of type VI collagen by human macrophages: a new dimension in macrophage functional heterogeneity. J. Immunol. 180:5707–5719 [DOI] [PubMed] [Google Scholar]
- 55. Shang S, et al. 2011. Activities of TMC207, rifampin, and pyrazinamide against Mycobacterium tuberculosis infection in Guinea pigs. Antimicrob. Agents Chemother. 55:124–131 [DOI] [PMC free article] [PubMed] [Google Scholar]
- 56. Singh P, et al. 2007. Comparative evaluation of Lowenstein-Jensen proportion method, BacT/ALERT 3D system, and enzymatic pyrazinamidase assay for pyrazinamide susceptibility testing of Mycobacterium tuberculosis. J. Clin. Microbiol. 45:76–80 [DOI] [PMC free article] [PubMed] [Google Scholar]
- 57. Sissons J, et al. 2009. Multigenic control of tuberculosis resistance: analysis of a QTL on mouse chromosome 7 and its synergism with sst1. Genes Immun. 10:37–46 [DOI] [PMC free article] [PubMed] [Google Scholar]
- 58. Solotorovsky M, et al. 1952. Pyrazinoic acid amide; an agent active against experimental murine tuberculosis. Proc. Soc. Exp. Biol. Med. 79:563–565 [DOI] [PubMed] [Google Scholar]
- 59. Somoskovi A, et al. 2001. Lessons from a proficiency testing event for acid-fast microscopy. Chest 120:250–257 [DOI] [PMC free article] [PubMed] [Google Scholar]
- 60. Tsai MC, et al. 2006. Characterization of the tuberculous granuloma in murine and human lungs: cellular composition and relative tissue oxygen tension. Cell. Microbiol. 8:218–232 [DOI] [PubMed] [Google Scholar]
- 61. Vernon A, Burman W, Benator D, Khan A, Bozeman L. 1999. Acquired rifamycin monoresistance in patients with HIV-related tuberculosis treated with once-weekly rifapentine and isoniazid. Tuberculosis Trials Consortium. Lancet 353:1843–1847 [DOI] [PubMed] [Google Scholar]
- 62. Via LE, et al. 2008. Tuberculous granulomas are hypoxic in guinea pigs, rabbits, and nonhuman primates. Infect. Immun. 76:2333–2340 [DOI] [PMC free article] [PubMed] [Google Scholar]
- 63. Wade MM, Zhang Y. 2004. Anaerobic incubation conditions enhance pyrazinamide activity against Mycobacterium tuberculosis. J. Med. Microbiol. 53:769–773 [DOI] [PubMed] [Google Scholar]
- 64. Wayne LG, Hayes LG. 1996. An in vitro model for sequential study of shiftdown of Mycobacterium tuberculosis through two stages of nonreplicating persistence. Infect. Immun. 64:2062–2069 [DOI] [PMC free article] [PubMed] [Google Scholar]
- 65. WHO 2009. Global tuberculosis control: a short update to the 2009 report. WHO Press, World Health Organization, Geneva, Switzerland [Google Scholar]
- 66. Yan BS, et al. 2007. Progression of pulmonary tuberculosis and efficiency of bacillus Calmette-Guerin vaccination are genetically controlled via a common sst1-mediated mechanism of innate immunity. J. Immunol. 179:6919–6932 [DOI] [PubMed] [Google Scholar]
- 67. Zhang M, et al. 2011. Treatments of tuberculosis with rifamycin-containing regimens in immune-deficient mice. Am. J. Respir. Crit. Care Med. 183:1254–1261 [DOI] [PMC free article] [PubMed] [Google Scholar]
- 68. Zhang Y, Mitchison D. 2003. The curious characteristics of pyrazinamide: a review. Int. J. Tuberc. Lung Dis. 7:6–21 [PubMed] [Google Scholar]