

Abstract
Reduced nicotinamide adenine dinucleotide (NADH) and its oxidized form play central roles in energy and redox metabolisms. For many years, researchers have relied on the weak NADH endogenous fluorescence signal to determine the NADH level in living cells. We recently reported a series of genetically encoded fluorescent sensors highly specific for NADH. These sensors allow real-time, quantitative measurement of this significant molecule in different subcellular compartments. In this study, we provide a more detailed discussion of the benefits and limitations of these genetically encoded fluorescent sensors. These sensors are utilized in most laboratories without the need for sophisticated instruments because of their superior sensitivity and specificity. They are also viable alternatives to existing techniques for measuring the endogenous fluorescence of intracellular NAD(P)H.
Keywords: electron transport chain, genetically encoded sensor, glucose, hypoxia, metabolic state, reduced nicotinamide adenine dinucleotide (NADH), subcellular distribution
Introduction
For the past 20 years, biologists and chemists have focused significant attention on the real-time tracking of particular small molecules in living cells. Currently, fluorescence detection is the most widely used method in molecular imaging because of its high sensitivity and selectivity, sufficient temporal and spatial resolutions, and low cost.1 In particular, fluorescent proteins of different colors have led to new revolutions in cell and molecular biology research. Aside from being widely used as indicators of protein expression and location,2 these proteins have been engineered into “genetically encoded sensors” for monitoring various cellular molecular species and events.3-6 These sensors are encoded by genes. Hence, they can be targeted to different cells and even in various subcellular organelles, allowing spatiotemporal imaging of cellular activities at an unprecedented level.
Reduced nicotinamide adenine dinucleotide (NADH) is one of the most important coenzymes found in all living cells, playing important roles in energy metabolism, redox metabolism, and biosynthesis.7,8 For many years, researchers have relied on the weak NADH endogenous fluorescence signal to determine the NADH level, which is considered a fundamental metabolic and signaling parameter.7-10 However, these measurements are technically challenging under physiological conditions. In our previous study, we developed genetically encoded fluorescent sensors for NADH, which consist of circularly permuted yellow fluorescent protein (cpYFP) inserted into a tandem dimer of Bacillus subtilis Rex protein, a bacterial NADH sensing protein.11 These sensors showed high sensitivity and specificity to NADH and did not respond to NADH analogs.11
Frex and FrexH Sensors for NADH
Crystallographic studies12 have shown that NADH binding induces dramatic conformational changes on the Rex dimer, which shifts from an open to a closed form (Fig. 1). By fusing the Rex protein and cpYFP, we developed genetically encoded fluorescent sensors for NADH named Frex and FrexH, which have two excitation peaks at approximately 421 and 500 nm and one emission peak at 518 nm.11 These peaks allow for ratiometric imaging, i.e., the quantitative determination of the NADH level by measuring the ratio of fluorescence excited by 421 and 500 nm light. We found that the fluorescence of a Frex sensor is linearly correlated with its concentration up to 40 μM and observed the same large response of the ratio of the fluorescence intensities (excitation at 485 nm divided by that at 420 nm) to NADH (Fig. 2). These results suggest that Frex fluorescence is not quenched or does not lose its function at high concentrations. These properties of Frex sensors provides a significant advantage for intracellular imaging and detection, as the readout is irrelevant to the concentration of the sensor expressed in the cells. Compared with conventional measurements of weak endogenous NAD(P)H autofluorescence, Frex and FrexH are brighter and more specific and, therefore, superior for real-time tracking of intracellular NADH levels (Fig. 3). In practical benchwork, Frex sensors in living cells can be detected using various instruments common in laboratories, including fluorescence microplate readers, flow cytometers, wide-field fluorescence microscopes and single photon confocal microscopes.
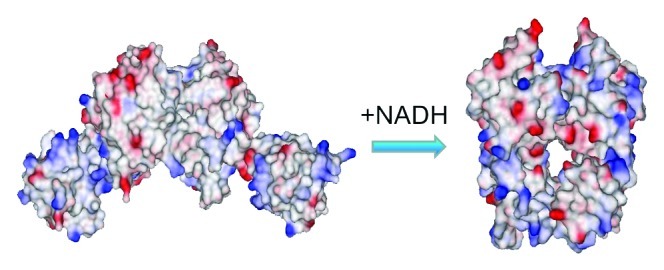
Figure 1. Conformation of Frex changes upon NADH binding. Electrostatic surface representation of Rex dimer with ATP or with NADH based on Protein Data Bank files 2VT3 and 1XCB.

Figure 2. Linear Frex fluorescence in different protein levels. (A) Fluorescence intensities with excitation at 485 or 420 nm with different concentrations of purified recombinant Frex proteins and 528 nm emission. (B) Ratio of fluorescence intensities with excitation at 485 nm divided by 420 nm with different concentrations of purified recombinant Frex proteins and 528 nm emission. Error bars represent standard error of mean (SEM).

Figure 3. The Frex image is superior to the autofluorescence image. (A) Two photon confocal microscopy images of NAD(P)H endogenous fluorescence in 293FT cells. Imaging was performed on a Zeiss 510 META LSCM system equipped with chameleon-XR (coherent) laser power focused through a Plan-neofluor 40 × 1.3 NA oil immersion objective. Cells were kept at 37°C using a temperature-controlled stage (PECON). Sequential images of endogenous NAD(P)H fluorescence were collected through a 435 nm to 485 nm filter using 710 nm laser (two-photon) excitation, 256 × 256 format, 2 × zoom, and 12-bit depth. (Left panel) Data of two photons in the original submission with laser power of 8%. (Right panel) Images acquired with laser power of 16.9%. (Upper panel) First image frame. (Bottom panel) Tenth image frame. High laser power leads to significant quenching of endogenous NAD(P)H fluorescence. (B) Enlarged confocal microscopy images of Frex-Mit expressing cells excited at 405 and 488 nm.
Subcellular NADH Levels and NADH Transport in Mammalian Cells
Measuring NADH concentrations in living cells is important to understand the variation in the metabolic states of different cells. We have shown that Frex and FrexH can be used to determine the free NADH level in different subcellular compartments.11
Most previous reports focus on mitochondrial NADH levels.13 The free NADH level in mitochondria is determined by the total NAD+-NADH pool, the NAD+/NADH ratio, and the free/bound NADH ratio. The total content of NAD+-NADH within the matrix varies depending on the cell type. In extremely metabolically active cells such as cardiomyocytes, the NAD+-NADH matrix concentration reaches 3.4 mM.14 On the other hand, the NAD+ pool in isolated liver mitochondria was reported to be 500 pmol/mg of protein, i.e., 350 μM of NAD+.15 The mitochondrial NAD+-NADH ratio also varies from 2 to 16 in different reports.16-18 In recent years, an increasing number of studies on free NADH were largely focused on measurements via time-resolved fluorescence,19,20 fluorescence anisotropy,21,22 and fluorescence spectral decomposition analysis.16 These techniques enable researchers to distinguish between the protein-bound and free NADH in the intracellular environment. However, they require sophisticated instruments and complex mathematical signal processing, and their capability and data interpretation in biological studies have yet to be validated. The ratio of free/bound NADH varies significantly from 1.5:120 to 1:4.21 For example, Wakita et al.23 were unable to detect free NADH in rat liver mitochondria regardless of their respiratory state, whereas Blinova et al.20 observed a high proportion of free NADH in pig heart mitochondria using a similar technique. Interestingly, Kasimova et al. suggested that the free NADH concentration in plant mitochondria is kept constant under different metabolic conditions.16 These apparent discrepancies may reflect fundamental physiological differences between the roles of free NADH in the mitochondria of different species and tissues.16 These variations may also be due to the limitations of the techniques used. In this study, we isolated the mitochondria from 293FT cells according to a previously described method,24 extracted NADH or total NAD+ as described in previous literature25-27 and estimated the total NAD+-NADH pool using an enzymatic cycling assay. The results showed that the mitochondria of 293FT cells contain 345 ± 28 μM NAD+ and 91 ± 8 μM NADH, assuming that 1.5 μL of mitochondria is associated with 1 mg of mitochondrial protein. If the mitochondrial free/bound NADH ratio is 1:3, the mitochondrial matrix in 293FT cells would have 23 μM of free NADH.
Mitochondrial FAD fluorescence, whose excitation and emission frequencies overlap with the Frex and FrexH sensors, should be considered in calibrating absolute subcellular NADH levels via Frex fluorescence. This study showed that cell autofluorescence had very little contribution to the fluorescence data measured using the microplate reader (Fig. 4A). Furthermore, the confocal microscopy images of the Frex-Nuc expressing cells in both excitation channels showed strong fluorescence signals in the nuclei but near-zero fluorescence signals in the cytosol, which includes the mitochondria (Fig. 4B). Thus, mitochondrial FAD fluorescence does not interfere with Frex sensor fluorescence.

Figure 4. Cell autofluorescence from FAD did not interfere with Frex fluorescence assay. (A) Typical value of the fluorescence of Frex-expressing living cells. Frex was expressed in different subcellular compartments. (B) Confocal microscopy images of Frex-Nuc-expressing cells excited at 405 and 488 nm. Both excitation channels showed very strong fluorescence signals in the nuclei, whereas the fluorescence signals in the cytosol (including mitochondria) were close to zero. Scale bar = 10 μm.
We measured subcellular NADH levels in mammalian cells through Frex and FrexH using a microplate reader and found extremely low cytosolic NADH levels ranging from 120 nM to 130 nM (Table 1). These results are consistent with a previous estimation of the NADH level in the nucleus.19 However, the measurements obtained by the microplate reader were not appropriate for mitochondrial free NADH determination. The mitochondrial pH value is higher than that of the cytosol. Therefore, the fluorescence of the Frex-Mit sensor is excited at a much lower degree, i.e., at 410 nm instead of 500 nm. However, the fluorescence at 500 nm can be robustly measured, whereas the fluorescence excited at 410 nm cannot (Fig. 4A). A small error in the fluorescence excited at 410 nm may produce large errors in the estimation of free NADH levels. Therefore, we measured the mitochondrial free NADH using ratiometric fluorescence imaging or by comparing the Frex fluorescence excited at 485 nm in living cells with that of cell lysates in 0.3% digitonin and 0.3% digitonin with NADH. These two approaches yielded very similar results, suggesting that 70% to 75% of the Frex-Mit sensors were bound to NADH in the mitochondrial matrix of 293FT cells. The two approaches determined the free NADH level in the mitochondrial matrix as 33 ± 9 and 26 ± 7 μM, respectively. When the fluorescence of a low-affinity sensor, C3L194K, was measured, the free NADH level in the mitochondrial matrix was determined as 27 ± 5 μM. Moreover, the mitochondrial free NADH level is approximately 30 μM when measured using the Frex and C3L194K sensors (Table 1). These results are similar to a recent report,16 as well as to the above estimation. Thus, the free concentration of NADH in the mitochondria is several hundredfold higher than that in the cytosol. Considering that the mitochondrial volume in a cell ranges from 5% to 50%, most intracellular NADH is localized in the mitochondria. Therefore, weak endogenous fluorescence alone reflects the mitochondrial NADH level. Tracing NADH level fluctuations in the cytosol using traditional methods would be quite challenging. Genetically encoded NADH sensors, such as Frex and Peredox, are more suitable for NADH detection in subcellular compartments other than in the mitochondria.
Table 1. Subcellular NADH levels in 293FT cells.
| Sensors | Sensor occupancy (%) | Subcellular NADH levels |
|---|---|---|
| FrexH-Cyt (Microplate) |
~76 |
~130 nM |
| Frex-Cyt (Digit) |
~3.3 |
~120 nM |
| Frex-Mit (Imaging) |
~70–75% |
33 ± 9 µM |
| Frex-Mit (Digit) |
~70–75% |
26 ± 7 µM |
| C3L194K-Mit (Imaging) | ~35% | 27 ± 5 µM |
Previous studies indicated that NAD+ and NADH cannot be transported across plasma membranes of any cell type.28 However, a recent study showed that P2X7 receptors mediated the transport of millimolar concentrations of NADH across the plasma membrane in astrocytes.29 In this study, intracellular levels of NADH were measured via cell lysis, NADH extraction and cycling assays. However, when intracellular NADH was detected using Frex probes,11 even micromolar concentrations of exogenous NADH induced an immediate, dose-dependent and saturable increase in intracellular NADH in different cells, including the P2X7R-deficient HEK293 cells. Furthermore, the P2X7R inhibitor PPADS did not affect the entry of NADH into cells. Collectively, Frex displayed superior specificity and sensitivity for NADH translocation studies in living cells.
Glycolysis and NADH
Increasing glucose concentration increases cellular NADH levels,8,9 as also observed in this study. However, more spatiotemporal resolved data can be obtained when intracellular NADH is monitored using Frex probes. We observed a temporal separation of cytosolic and mitochondrial NADH levels induced by glucose supplements. Furthermore, the K0.5 value for mitochondrial NADH levels (0.16 mM) vs. extracellular glucose concentration is less than that of cytosolic NADH levels (1.5 mM). Compared with mitochondrial NADH, cytosolic NADH responds to more physiologically and pathologically relevant fluctuations of glucose levels in the range of 1 mM to 25 mM. Furthermore, the pyruvate and lactate levels in the cytosol are equal to the free NAD+ and NADH levels. Using FrexH, we tracked such equilibrium in real time. Pyruvate addition rapidly decreased the cytosolic NADH level, which then recovered within 30 min, whereas lactate addition rapidly increased the cytosolic NADH. In comparison, the changes in the mitochondrial NADH are slower and more complicated. Upon adding pyruvate into the media, mitochondrial NADH levels decreased, recovered and then further increased. The delayed increase indicates that pyruvate can enter the mitochondria and can be utilized via the tricarboxylic acid (TCA) cycle. In comparison, lactate addition induced a more rapid and significant increase in mitochondrial NADH levels. However, the effects of pyruvate or lactate on mitochondria were diminished when physiologically relevant concentrations of glucose were present. These results may be helpful in our understanding of glucose homeostasis, as cytosolic NADH levels correctly reflect cellular metabolic states under physiological settings.
Glycolysis-generated NADH may be transported into the mitochondria, thereby increasing mitochondrial NADH levels. Upon administering aminooxyacetate, a well-characterized inhibitor of the malate-aspartate shuttle, we found that the malate-aspartate shuttle blockage decreased the mitochondrial NADH levels and increased the cytosolic NADH levels. Such decrease in mitochondrial NADH levels during malate-aspartate shuttle inhibition is widely common in different mammalian cells. However, we were not able to observe these phenomena when measuring NAD(P)H autofluorescence. We further demonstrated that, in 293FT cells, mitochondrial NADH levels mainly depended on NADH transport through the malate-aspartate shuttle rather than on pyruvate metabolism via the TCA cycle during glucose metabolism.
In the temporal measurement of cellular free NADH using Frex sensors, excessive amounts of sensors in the cell may contribute to the temporal buffering of NADH. Cells have several “buffering” systems for NADH, including several NADH binding proteins in the cytosol and mitochondria. Furthermore, NADH and NAD+ are buffered by pyruvate and lactate via lactate dehydrogenase in the cytosol and by oxoglutarate and glutamate via β-hydroxybutyrate dehydrogenase in the mitochondria. The concentrations of these metabolites are in the millimolar range.18 The exogenous NADH binding protein expression, i.e., the Frex sensor, contributes to the buffering systems for NADH. We have measured Frex concentration in the cytosol and mitochondria by quantifying Frex and cell/mitochondria volume. Frex was quantified via cell lysis, in which its fluorescence in the presence of NADH was measured and the signal was compared with that of the purified recombinant Frex protein. The Frex protein concentration expressed in the cytosol ranges from 4 μM to 13 μM, depending on cell type and transfection efficiency. This value is higher than the free cytosolic NADH concentration. However, the fluorescence of Frex expressed in the cytosol responds immediately to exogenous NADH, lactate, and glucose, suggesting that the Frex sensor induced minimal temporal buffering effects. The Frex protein concentration expressed in the mitochondria was estimated to be within 10 μM to 30 μM, although only 70% was bound with NADH. We estimated that the Frex-Mit-bound NADH is less than 12% of the total mitochondrial NADH in resting cells. According to these calculations, the Frex sensors are unlikely to have a major impact on the total NADH concentration and the metabolic status of the cells. Indeed, we found that glucose induced a slight increase in NADH fluorescence within 10 min (Fig. 5), which agrees with the results of Frex-Mit fluorescence in transfected cells.11 In summary, the effects of Frex sensors on intracellular NADH are of marginal importance.
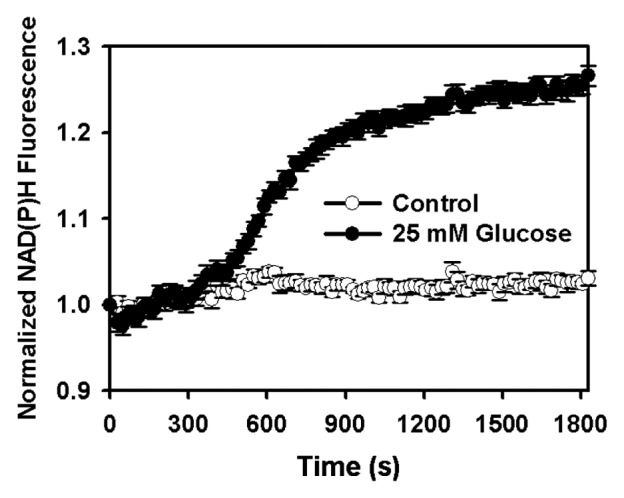
Figure 5. Kinetics of NAD(P)H endogenous fluorescence response after glucose supplementation. Fluorescence excited at 360 nm was measured using the Synergy 2 Multi-Mode Microplate Reader with excitation filter 360 BP 40 nm and emission filter 450 BP 65 nm. NAD(P)H endogenous fluorescence was measured in 384-well black microplates (Greiner). Fluorescence intensity was measured immediately.
Oxidative Phosphorylation and NADH
The NADH produced from the glycolysis and TCA cycle was oxidized to generate ATP through oxidative phosphorylation. Using different respiratory chain complex inhibitors, we found that complex I, III, IV and V inhibitions increased the mitochondrial NADH. On the other hand, both the mitochondrial uncoupler and the complex II inhibitor decreased mitochondrial NADH levels. Such decreases in the mitochondrial NADH could be blocked by rotenone, a complex I inhibitor.
Under complete hypoxia conditions, the lack of O2 in the mitochondria inhibits oxidative phosphorylation and terminates ATP production.30 Hypoxia tends to increase intracellular NADH fluorescence or the NADH/NAD+ ratio, as shown by NAD(P)H autofluorescence or pyruvate/lactate assay.31-33 To better understand the mitochondrial NADH levels, we used the glucose oxidase(GO)/catalase(CAT) system to induce hypoxia. The oxygen consumptions of GO/CAT were determined using the BD Oxygen Biosensor System (Fig. 6A). We found that hypoxia increased the mitochondrial free NADH levels in the 293FT cells (Figs. 6B and 6C). In contrast, GO alone induced a rapid decrease of mitochondrial NADH because of hydrogen peroxide production. These results were consistent with our previous observation that mitochondrial NADH is sensitive to hydrogen peroxide. In addition, hypoxia could essentially block 3-NP-induced mitochondrial NADH oxidation (Fig. 6D), similar to the complex I inhibitor, rotenone.11

Figure 6. Hypoxia increased mitochondrial NADH levels. (A) GO/ CAT system induced hypoxia in vitro. Oxygen level was measured with BD Oxygen Biosensor System. (B) Effect of GO/CAT system on the fluorescence of Frex‐Mit and cpYFP‐Mit excited at 485 nm in 293FT cells. Cells were treated with the GO/CAT system for 13 min. (C) Frex-Mit fluorescence was corrected for pH effect by normalization with cpYFP-Mit fluorescence measured in parallel experiments. (D) Hypoxia can rescue mitochondrial NADH oxidation from 3-NP-caused complex II inhibition. Cells were treated with the GO/CAT system or 3-NP for 13 min. Error bars represent SEM.
Frex, Peredox and Perspectives
NADH plays a central role in cellular metabolism (Fig. 7). We demonstrated that Frex can be used in monitoring changes in the NADH levels in mammalian cells, as well as in the subcellular organelles, as affected by NADH transport, glucose metabolism, electron transport, and redox regulation.11 In the same issue of Cell Metabolism, where we reported on Frex sensors, Hung et al.34 reported yet another elegant genetically encoded sensor, Peredox, for NADH. Frex and Peredox are based on a similar design, i.e., circular permuted fluorescent proteins between the Rex protein dimers. Fluorescence of both sensors increase in the presence of NADH. However, Frex is a fusion of B. subtilis Rex and cpYFP, whereas Peredox is based on Thermus aquaticus Rex and circularly permuted green fluorescent protein (cpGFP) T-Sapphire. Slight differences in the domain structure between these sensors were also observed. For instance, the DNA binding domain of the second Rex was deleted in the Frex sensors.11 We also used the same design in Peredox using B. subtilis Rex. However, interestingly, the fluorescent protein obtained did not respond to NADH (data not shown). Similarly, the fluorescent protein did not respond to NADH when T. aquaticus Rex was used for the Frex design. Both sensors should facilitate better understanding of cellular and subcellular NADH-related multiple biological processes.

Figure 7. Schematic model of intracellular NADH/NAD+ metabolism. NADH was produced during glycolysis in the cytosol and via the TCA cycle in the mitochondria. It was then oxidized by the mitochondrial respiratory chain complex I. NADH can be transported across the plasma membrane and diffused freely into the nucleus, whereas cytosolic NADH lacks direct access to the mitochondria. However, it can enter the mitochondria via the malate-aspartate and glycerol phosphate shuttles. Subcellular concentrations also depend on the transportation of glucose, pyruvate, and lactate.
Frex and Peredox have their corresponding advantages and disadvantages. Frex exhibited a 900% increase in fluorescence NADH binding, making them the most responsive genetic sensor currently available. On the other hand, Peredox exhibited 150% increase. The higher responsiveness of Frex sensors resolves more subtle differences in NADH levels among different cells during biological processes. Frex sensors are intrinsically ratiometric with two excitation wavelengths. Thus, their readouts are irrelevant to the sensor concentration in the cells. In comparison, Peredox has only one excitation wavelength. Ratiometric imaging of Peredox can be achieved by tagging the sensor with mCherry, a red fluorescent protein, which increases the overall size of the sensor and sometimes causes the aggregation of the fusion protein.34 The affinity of Frex was fine-tuned to measure both cytosolic and mitochondrial NADH levels. However, the affinity of Peredox was apparently too high, thereby prohibiting its usage in the mitochondria, which have much higher NADH concentrations than the cytosol. The high affinity of Peredox may also complicate the cytosolic NADH measurement. The cytosol- or nucleus-targeted Peredox sensors were largely saturated under normal physiological conditions, i.e., with 3 mM to 5 mM glucose supplement in the medium or in vivo. Therefore, the sensor should be calibrated with pyruvate and lactate, without glucose, during each measurement.34 However, Frex sensors are sensitive to pH level, and the fluorescence must be corrected using a cpYFP measured in parallel. Peredox sensors are relatively resistant to pH levels. Therefore, they are more suitable for conditions with fluctuating intracellular pH levels. Finally, Frex sensors are specific for NADH. Thus, they are not suitable for measuring the critical NADH/NAD ratio, although the NADH/NAD+ ratio usually depends only on the NADH level. In addition, the well-separated cytosol and mitochondria NADH/NAD+ pools are unlikely to change during a short period. Peredox sensor are known to sense the cytosolic NADH/NAD+ redox state, as NAD+ competes with NADH during sensor binding. Unlike the ATP/ADP sensor that determines only the ATP/ADP ratio,35 Peredox has a fluorescent response that significantly varies under different NAD+ concentrations, even when the NADH/NAD+ ratio remained constant. Therefore, Peredox sensors only partially reflect the NADH/NAD+ ratio and should be calibrated using pyruvate and lactate. We are currently working on the improved version of Frex sensors. Ideally, a highly responsive, low-affinity, and purely NADH/NAD+ ratio-specific sensor is desirable for the comparison of the redox potentials of different cells and long-term living cell monitoring. Furthermore, these sensors may be used together with Frex probes to measure all three critical parameters simultaneously, i.e., NADH, NAD+ and their ratio.
Acknowledgment
This work was supported by the National Natural Science Foundation of China (Grants 31071260, 90713026, 31170815, and 91013012), the 863 Program (Grant 2006AA02Z160), Specialized Research Fund for the Doctoral Program of Higher Education (Grant 20100074110010), the Fok Ying Tung Education Foundation (Grant 111022), the Program for Professor of Special Appointment (Eastern Scholar) at the Shanghai Institutions of Higher Learning, the Dawn Program of Shanghai Education Commission (Grant 11SG31), the Open Funding Project of the State Key Laboratory of Bioreactor Engineering, the 111 Project (Grant B07023) and the Fundamental Research Funds for the Central Universities.
Footnotes
Previously published online: www.landesbioscience.com/journals/biobugs/article/19769
References
- 1.Wang H, Nakata E, Hamachi I. Recent progress in strategies for the creation of protein-based fluorescent biosensors. Chembiochem. 2009;10:2560–77. doi: 10.1002/cbic.200900249. [DOI] [PubMed] [Google Scholar]
- 2.Sakaue-Sawano A, Kurokawa H, Morimura T, Hanyu A, Hama H, Osawa H, et al. Visualizing spatiotemporal dynamics of multicellular cell-cycle progression. Cell. 2008;132:487–98. doi: 10.1016/j.cell.2007.12.033. [DOI] [PubMed] [Google Scholar]
- 3.Zhao Y, Araki S, Wu J, Teramoto T, Chang YF, Nakano M, et al. An expanded palette of genetically encoded Ca²⁺ indicators. Science. 2011;333:1888–91. doi: 10.1126/science.1208592. [DOI] [PMC free article] [PubMed] [Google Scholar]
- 4.Tsou P, Zheng B, Hsu CH, Sasaki AT, Cantley LC. A fluorescent reporter of AMPK activity and cellular energy stress. Cell Metab. 2011;13:476–86. doi: 10.1016/j.cmet.2011.03.006. [DOI] [PMC free article] [PubMed] [Google Scholar]
- 5.Arosio D, Ricci F, Marchetti L, Gualdani R, Albertazzi L, Beltram F. Simultaneous intracellular chloride and pH measurements using a GFP-based sensor. Nat Methods. 2010;7:516–8. doi: 10.1038/nmeth.1471. [DOI] [PubMed] [Google Scholar]
- 6.Imamura H, Nhat KP, Togawa H, Saito K, Iino R, Kato-Yamada Y, et al. Visualization of ATP levels inside single living cells with fluorescence resonance energy transfer-based genetically encoded indicators. Proc Natl Acad Sci U S A. 2009;106:15651–6. doi: 10.1073/pnas.0904764106. [DOI] [PMC free article] [PubMed] [Google Scholar]
- 7.Kasischke KA, Vishwasrao HD, Fisher PJ, Zipfel WR, Webb WW. Neural activity triggers neuronal oxidative metabolism followed by astrocytic glycolysis. Science. 2004;305:99–103. doi: 10.1126/science.1096485. [DOI] [PubMed] [Google Scholar]
- 8.Eto K, Tsubamoto Y, Terauchi Y, Sugiyama T, Kishimoto T, Takahashi N, et al. Role of NADH shuttle system in glucose-induced activation of mitochondrial metabolism and insulin secretion. Science. 1999;283:981–5. doi: 10.1126/science.283.5404.981. [DOI] [PubMed] [Google Scholar]
- 9.Patterson GH, Knobel SM, Arkhammar P, Thastrup O, Piston DW. Separation of the glucose-stimulated cytoplasmic and mitochondrial NAD(P)H responses in pancreatic islet beta cells. Proc Natl Acad Sci U S A. 2000;97:5203–7. doi: 10.1073/pnas.090098797. [DOI] [PMC free article] [PubMed] [Google Scholar]
- 10.Rubi B, del Arco A, Bartley C, Satrustegui J, Maechler P. The malate-aspartate NADH shuttle member Aralar1 determines glucose metabolic fate, mitochondrial activity, and insulin secretion in beta cells. J Biol Chem. 2004;279:55659–66. doi: 10.1074/jbc.M409303200. [DOI] [PubMed] [Google Scholar]
- 11.Zhao Y, Jin J, Hu Q, Zhou HM, Yi J, Yu Z, et al. Genetically encoded fluorescent sensors for intracellular NADH detection. Cell Metab. 2011;14:555–66. doi: 10.1016/j.cmet.2011.09.004. [DOI] [PMC free article] [PubMed] [Google Scholar]
- 12.McLaughlin KJ, Strain-Damerell CM, Xie K, Brekasis D, Soares AS, Paget MS, et al. Structural basis for NADH/NAD+ redox sensing by a Rex family repressor. Mol Cell. 2010;38:563–75. doi: 10.1016/j.molcel.2010.05.006. [DOI] [PubMed] [Google Scholar]
- 13.Mayevsky A. Mitochondrial function and energy metabolism in cancer cells: past overview and future perspectives. Mitochondrion. 2009;9:165–79. doi: 10.1016/j.mito.2009.01.009. [DOI] [PubMed] [Google Scholar]
- 14.Joubert F, Fales HM, Wen H, Combs CA, Balaban RS. NADH enzyme-dependent fluorescence recovery after photobleaching (ED-FRAP): applications to enzyme and mitochondrial reaction kinetics, in vitro. Biophys J. 2004;86:629–45. doi: 10.1016/S0006-3495(04)74141-7. [DOI] [PMC free article] [PubMed] [Google Scholar]
- 15.Yang H, Yang T, Baur JA, Perez E, Matsui T, Carmona JJ, et al. Nutrient-sensitive mitochondrial NAD+ levels dictate cell survival. Cell. 2007;130:1095–107. doi: 10.1016/j.cell.2007.07.035. [DOI] [PMC free article] [PubMed] [Google Scholar]
- 16.Kasimova MR, Grigiene J, Krab K, Hagedorn PH, Flyvbjerg H, Andersen PE, et al. The free NADH concentration is kept constant in plant mitochondria under different metabolic conditions. Plant Cell. 2006;18:688–98. doi: 10.1105/tpc.105.039354. [DOI] [PMC free article] [PubMed] [Google Scholar]
- 17.Henley KS, Laughrey EG. The redox state of the mitochondrial NAD system in cirrhosis of the liver and in chronic quantitative undernutrition in the rat. Biochim Biophys Acta. 1970;201:9–12. doi: 10.1016/0304-4165(70)90003-6. [DOI] [PubMed] [Google Scholar]
- 18.Williamson DH, Lund P, Krebs HA. The redox state of free nicotinamide-adenine dinucleotide in the cytoplasm and mitochondria of rat liver. Biochem J. 1967;103:514–27. doi: 10.1042/bj1030514. [DOI] [PMC free article] [PubMed] [Google Scholar]
- 19.Zhang Q, Piston DW, Goodman RH. Regulation of corepressor function by nuclear NADH. Science. 2002;295:1895–7. doi: 10.1126/science.1069300. [DOI] [PubMed] [Google Scholar]
- 20.Blinova K, Carroll S, Bose S, Smirnov AV, Harvey JJ, Knutson JR, et al. Distribution of mitochondrial NADH fluorescence lifetimes: steady-state kinetics of matrix NADH interactions. Biochemistry. 2005;44:2585–94. doi: 10.1021/bi0485124. [DOI] [PubMed] [Google Scholar]
- 21.Yu Q, Heikal AA. Two-photon autofluorescence dynamics imaging reveals sensitivity of intracellular NADH concentration and conformation to cell physiology at the single-cell level. J Photochem Photobiol B. 2009;95:46–57. doi: 10.1016/j.jphotobiol.2008.12.010. [DOI] [PMC free article] [PubMed] [Google Scholar]
- 22.Vishwasrao HD, Heikal AA, Kasischke KA, Webb WW. Conformational dependence of intracellular NADH on metabolic state revealed by associated fluorescence anisotropy. J Biol Chem. 2005;280:25119–26. doi: 10.1074/jbc.M502475200. [DOI] [PubMed] [Google Scholar]
- 23.Wakita M, Nishimura G, Tamura M. Some characteristics of the fluorescence lifetime of reduced pyridine nucleotides in isolated mitochondria, isolated hepatocytes, and perfused rat liver in situ. J Biochem. 1995;118:1151–60. doi: 10.1093/oxfordjournals.jbchem.a125001. [DOI] [PubMed] [Google Scholar]
- 24.Corcoran JA, Saffran HA, Duguay BA, Smiley JR. Herpes simplex virus UL12.5 targets mitochondria through a mitochondrial localization sequence proximal to the N terminus. J Virol. 2009;83:2601–10. doi: 10.1128/JVI.02087-08. [DOI] [PMC free article] [PubMed] [Google Scholar]
- 25.Ying W, Sevigny MB, Chen Y, Swanson RA. Poly(ADP-ribose) glycohydrolase mediates oxidative and excitotoxic neuronal death. Proc Natl Acad Sci U S A. 2001;98:12227–32. doi: 10.1073/pnas.211202598. [DOI] [PMC free article] [PubMed] [Google Scholar]
- 26.Szabo´ C, Zingarelli B, O’Connor M, Salzman AL. DNA strand breakage, activation of poly (ADP-ribose) synthetase, and cellular energy depletion are involved in the cytotoxicity of macrophages and smooth muscle cells exposed to peroxynitrite. Proc Natl Acad Sci U S A. 1996;93:1753–8. doi: 10.1073/pnas.93.5.1753. [DOI] [PMC free article] [PubMed] [Google Scholar]
- 27.Thornburg JM, Nelson KK, Clem BF, Lane AN, Arumugam S, Simmons A, et al. Targeting aspartate aminotransferase in breast cancer. Breast Cancer Res. 2008;10:R84. doi: 10.1186/bcr2154. [DOI] [PMC free article] [PubMed] [Google Scholar]
- 28.Ying W. NAD+/NADH and NADP+/NADPH in cellular functions and cell death: regulation and biological consequences. Antioxid Redox Signal. 2008;10:179–206. doi: 10.1089/ars.2007.1672. [DOI] [PubMed] [Google Scholar]
- 29.Lu H, Burns D, Garnier P, Wei G, Zhu K, Ying W. P2X7 receptors mediate NADH transport across the plasma membranes of astrocytes. Biochem Biophys Res Commun. 2007;362:946–50. doi: 10.1016/j.bbrc.2007.08.095. [DOI] [PubMed] [Google Scholar]
- 30.Chance B, Williams GR. Respiratory enzymes in oxidative phosphorylation. III. The steady state. J Biol Chem. 1955;217:409–27. [PubMed] [Google Scholar]
- 31.Mayevsky A, Rogatsky GG. Mitochondrial function in vivo evaluated by NADH fluorescence: from animal models to human studies. Am J Physiol Cell Physiol. 2007;292:C615–40. doi: 10.1152/ajpcell.00249.2006. [DOI] [PubMed] [Google Scholar]
- 32.Zhang Q, Wang SY, Nottke AC, Rocheleau JV, Piston DW, Goodman RH. Redox sensor CtBP mediates hypoxia-induced tumor cell migration. Proc Natl Acad Sci U S A. 2006;103:9029–33. doi: 10.1073/pnas.0603269103. [DOI] [PMC free article] [PubMed] [Google Scholar]
- 33.Crawford RM, Jovanovic´ S, Budas GR, Davies AM, Lad H, Wenger RH, et al. Chronic mild hypoxia protects heart-derived H9c2 cells against acute hypoxia/reoxygenation by regulating expression of the SUR2A subunit of the ATP-sensitive K+ channel. J Biol Chem. 2003;278:31444–55. doi: 10.1074/jbc.M303051200. [DOI] [PMC free article] [PubMed] [Google Scholar]
- 34.Hung YP, Albeck JG, Tantama M, Yellen G. Imaging cytosolic NADH-NAD(+) redox state with a genetically encoded fluorescent biosensor. Cell Metab. 2011;14:545–54. doi: 10.1016/j.cmet.2011.08.012. [DOI] [PMC free article] [PubMed] [Google Scholar]
- 35.Berg J, Hung YP, Yellen G. A genetically encoded fluorescent reporter of ATP:ADP ratio. Nat Methods. 2009;6:161–6. doi: 10.1038/nmeth.1288. [DOI] [PMC free article] [PubMed] [Google Scholar]