Abstract
The sensitivity to surface profile of non-contact optical imaging, such as spatial frequency domain imaging, may lead to incorrect measurements of optical properties and consequently erroneous extrapolation of physiological parameters of interest. Previous correction methods have focused on calibration-based, model-based, and computation-based approached. We propose an experimental method to correct the effect of surface profile on spectral images. Three-dimensional (3D) phantoms were built with acrylonitrile butadiene styrene (ABS) plastic using an accurate 3D imaging and an emergent 3D printing technique. In this study, our method was utilized for the correction of optical properties (absorption coefficient μa and reduced scattering coefficient μs′) of objects obtained with a spatial frequency domain imaging system. The correction method was verified on three objects with simple to complex shapes. Incorrect optical properties due to surface with minimum 4 mm variation in height and 80 degree in slope were detected and improved, particularly for the absorption coefficients. The 3D phantom-based correction method is applicable for a wide range of purposes. The advantages and drawbacks of the 3D phantom-based correction methods are discussed in details.
OCIS codes: (110.0110) Imaging systems, (110.3010) Image reconstruction techniques, (110.6880) Three-dimensional image acquisition
1. Introduction
Imaging spectroscopy is a fast developing modality in medical imaging [1,2]. Several devices [3–6] based on this approach are currently being employed for the quantification of the concentration of physiological parameters of interest such as hemoglobin, water, and melanin. Among spectroscopy-based methods, spatial frequency domain imaging (SFDI), also known as modulated imaging, structured illumination or pattern illumination, has shown some promise in quantification of molecular components of living tissue by relying on the spatial modulation of the light source [7–10]. Nevertheless, similarly to other noncontact spectroscopy-based techniques, SFDI is sensitive to surface profile. Therefore it fails at different degrees depending on surface height across the image.
Recently some methods have been introduced to minimize this effect [11–13]. Gioux et al. [11] in 2009 introduced a calibration and a model based technique to correct optical properties of an object measured by SFDI. The modulation amplitude (the AC component) of a flat phantom, of known optical properties, was acquired at different heights and tilt angles along the shape of the real object. The phantom was used as a reference. The three-dimensional surface of the object was reconstructed by a phase-shift profilometer integrated in their SFDI system. After the normalization of modulation amplitude of the object by the corrected one of the reference, reconstructed optical properties of the object having height variations as much as 3 cm and tilt angles as high as 40 deg were improved. In 2011, Kainerstorfer et al. [12] used a computational approach to correct for the aforementioned curvature effect. Either a curve fitting or an averaging algorithm was applied to extract the geometry of the objects. This method showed some successes in removing curvature artifacts. Blood volume, and oxygenation distribution reconstruction was improved significantly. The same group also applied this method in retinal optical imaging [13]. Although promising, these approaches have some drawbacks. The signal processing-based method does not require any hardware modification or acquiring more images but depends on some assumptions and works well only with simple geometries. The postulates of uniform background, higher frequency of signal than curvature, small signal to background, and known object’s shape are required. On the other hand, the calibration and model-based method require several calibration steps for each object. In this study, we propose an experimental approach for curvature correction based on 3D phantoms. Normalizing an object by a 3D phantom of identical shape can aid in the reduction of the effect of different light distribution due to surface profile. 3D phantoms can be formed in various materials, such as gelatin or epoxy resin, to name a few [14–16]. However, these materials would require a wide range of molds, hence are unpractical. Here we introduce a method to build 3D phantoms using a 3D printing technique. Although the technique may not be useful in the clinical setting due to the low speed of 3D printers, it could be utilized for calibration purposes and to correct particularly challenging object that could not be measured otherwise.
Three-dimensional printers have recently been introduced to the marketplace and have expanded rapidly with thousands of applications, from professional industrial prototypes, art models to educational and medical molds creations. There have been several studies on 3D printing technique for medical applications [17–22]. In 2009, Vescan et al. [19] applied 3D printing to create high accurate models from CT or MR images for surgical practice and training purpose. In 2010, Carton et al. [21] created 3D anthropomorphic breast phantoms using a tissue equivalent material for 2D and 3D breast X-ray imaging system quality evaluation. Miller et al. [22] in 2011 turned out components in X-ray and gamma-ray imaging systems using a 3D printer along with a 3D modeling software and casting technique. A variety of available cost-effective models of 3D printers allow individuals to design and build their own in-house products. In our laboratory, a 3D printer, Makerbot Thing-O-Matic, has been utilized to create the ABS 3D phantoms.
In this paper we propose a low-cost and easy-to-implement method to correct the effect of surface profile on spectral images using 3D phantoms. This method is a combination between 3D rendering and experimental phantom building. The 3D phantoms have been built in less than one hour and were used as a same-shape reference for object normalization. We focus our methodology to the correction of spatial frequency domain imaging data, but we believe a similar approach could be used for a variety of spectroscopic imaging applications.
2. Materials and methods
A simple goniometric system was built to obtain accurate height measurements as well as optical properties of diffusive objects. The 3D profile reconstruction method is based on a flexible calibration technique developed by Vo et al. for fringe projection profilometry (FPP) [23], while the optical properties reconstruction follows the main principles for spatial frequency domain imaging (SFDI) illustrated by Cuccia and others [7–10]. A well-calibrated and configured 3D printer and several imaging processing stages have been utilized to print real-world 3D phantoms on Acrylonitrile Butadiene Styrene. The 3D phantoms were then used to correct the error in the extrapolated optical properties due to the object’s curvature. The whole system and processing details are described below.
2.1. Instrumentation
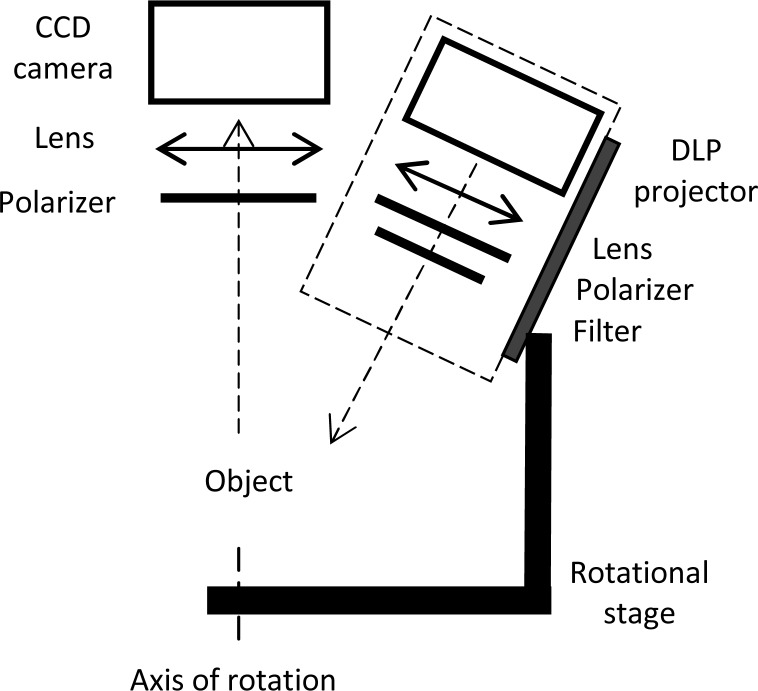
In this study, a combined FPP and SFDI system was built as shown in Fig. 1 . The system consisted of a DLP projector (resolution 1024 x 768 pixels, max contrast 2000:1, Infocus, Porland, OR) combined with a projection zoom lens (f = 200 mm, Thorlabs Inc. Newton NJ) and was used to project sinusoidal fringe patterns on a sample. Images of the sample with different 2D fringe patterns were captured by a 12 bit camera (1024 x 1280 pixels, Roper Scientific, Tucson AZ) combined with a f = 50 mm imaging lens (Nikon Inc, Hong Kong). Crossed source and detector polarizers (Melles Griot, Rochester, NY) were installed in the projection arm and detection arm to reduce specular reflectance from the surface of the sample. A specific filter was employed to obtain optical properties of the object at the desired wavelength. Several filters in the range of wavelengths from 500 to 750 nm (500, 518, 550, 600, 650, 700, 750 nm) have been used for this study and have shown similar results in curvature measurement. In this paper, we will show results for the 518 nm filter (CORION, Franklin, MA). In order to collect different views of a very complex object so to avoid shadows, the projection arm was attached to a rotational stage (Thorlabs Inc. Newton NJ) that was able to rotate around the sample in steps of 0.01 degrees, and a range of 0 to 200 degrees. For curvature correction of simple objects as the one we are presenting, it is not necessary to use this rotational function. The whole system was automatically controlled by custom software (MATLAB, Math Works, Natick, Massachusetts). The field of view was 40 mm x 50 mm. An inexpensive 3D printer (Thing-O-Matic MK6, Makerbot Industries) was used to print 3D solid phantoms at high resolution (0.3 mm thickness for each layer).
Fig. 1.
Schematic of the combined system for three dimensional profiling and optical property measurement.
2.2. Spatial frequency domain imaging (SFDI)
SFDI is a novel non-invasive imaging technique used to calculate quantitative optical properties, μa and μs′, of a biological tissue. This technique was first described by Cuccia et al. [10]. In order to determine the optical properties at one wavelength, SFDI requires spatial modulation of the illumination as well as the measurement of a well-known optically diffusive phantom, used as a reference. Three different phases of 0, 2π/3, 4π/3 radians at a specific frequency f (mm−1) are needed for the measurement. Images of both objects taken at each phase are used to calculate the spatially modulated (AC) and planar (DC) reflectance terms for every pixel as described in Eqs. (1) and (2):
| (1) |
| (2) |
Diffused reflectance at frequency f, Rd(f), of the sample is obtained based on the normalization of sample – reference for the AC components and Rd-ref (f) of the reference, Eq. (3). Similarly, DC components and the diffused reflectance at frequency zero, Rd(0), of the reference are used to determine Rd-ref(0) of the sample, Eq. (4). In that, diffused reflectance is a variable of μa and μs′ in the diffusion equation [10]:
| (3) |
| (4) |
These diffused reflectance components are the inputs to the diffusion equation and are ultimately used to calculate μa and μs′. By scanning each pixel of the resulting images, entire two-dimensional maps of μa and μs′ can be reconstructed. More details of these calculation steps were described in previous publications [7–10,24]. The SFDI system was calibrated with polyurethane diffusive phantoms mimicking tissue optical properties [24].
The spatial frequency f is selected to control the optical penetration depth of light into the sample and to satisfy the condition related to the transport coefficient, µtr = (µa + µs′) [10]. In this study, the value of f = 0.3 mm−1 was chosen to be appropriate for all used samples. Changes of spatial frequency due to height variations are insignificant for small fields of view and are not considered.
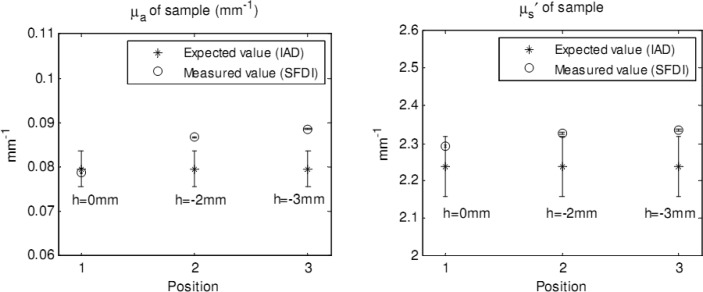
The optical property results can be affected by differences in surface profile and in height between the sample and the reference [11]. A simple test on the sensitivity of optical properties to the variations in height, conducted in our laboratory, illustrates this concept. Two polyurethane phantoms were used, one as the sample (µa = 0.08 mm−1 and μs′ = 2.24 mm−1) and the other as the reference (µa = 0.14 mm−1 and μs′ = 2.21 mm−1). The sample was firstly fixed at the same height to the reference (h = 0 mm), and was then moved downward of 2 mm (h = −2 mm) and 3 mm (h = −3 mm) from the first position. The changes in optical properties are illustrated in Fig. 2 . At each height the optical properties of a 200 pixels x 200 pixels area of the sample were calculated. Mean value and standard deviation were also determined and included in the figure. The standard deviations were too small to be observable. Expected values, measured with an integrating sphere and inverse adding doubling method (IAD) [25], are indicated in the figure. Percentage error increased from 1.1% to 11.3% in absorption coefficient and from 2.4% to 4.2% in the reduced scattering coefficient when height changed from h = 0 mm to h = −3 mm.
Fig. 2.
Changes in absorption coefficient (left) and reduced scattering coefficient (right) due to height changes.
2.3. Fringe projection profilometry (FPP) with flexible calibration for 3D imaging
Fringes projection profilometry has become one of the most prevalent methods for 3D shape reconstruction of an object. To reach high-quality results, complex calibration techniques are needed. Among the various calibration methods, the one proposed by Vo et al. [23] has demonstrated a robust performance with the full-field measurement error small than 0.05%; in addition, the technique is flexible for various scales of the imaging field and is easy to implement. Consequently, the technique is suitable for the task of this paper. The calibration uses a flat board with a paper printed with black and white checkerboard patterns. During calibration, the board is placed at five different arbitrary positions with respect to the reference plane. To obtain full-field 3D shape measurement with high accuracy at a fast speed, multiple-frequency and phase-shifted sinusoidal fringe patterns are projected on the sample of interest in the measurement or the calibration board in the calibration. The phase-shifting step is four with an equal phase-shifting amount of π/2 rad, and five frequencies are utilized to achieve automatic phase unwrapping. Here, frequency is defined as the number of fringes observable in the imaging field (40 mm x 50 mm) and is respectively selected as 1, 2, 4, 8, and 32 (is equivalent to 0.02, 0.04, 0.08, 0.16, and 0.64 mm−1). During the 3D shape measurement, the sample is placed on the reference plane and one set of twenty images are acquired (four images for each of the five different frequencies). A user-friendly software (MOIRE, free for download at http://www.opticist.org) has been developed to analyze the captured images to reconstruct a 3D image in a few seconds.
The raw 3D image obtained from the MOIRE software may contain noise originating from the imaging system, from the dissimilarity between sinusoidal fringes, and other factors. Hence a Gaussian filter is applied to the 3D images to smooth the surface of the object before printing. This step will help the 3D printer run smoothly and not print redundant parts.
The 3D image obtained with the steps described above is ultimately converted in a Standard Tessellation Language (STL) format typical of stereo-lithography.
2.4. 3D printer
The STL file is loaded in an open source 3D printing program (ReplicatorG). The printer is able to reconstruct 3D object by melting the casting material (ABS) and extruding it through a Teflon® coated nozzle. A two dimensional stage (x, y motors) moves the constructed object in two planar dimensions while the extruder is allowed to go up and down (third dimension) forming consequent layers. A reconstructed object is made of several layers. The quality the of regenerated object is therefore influenced by setup parameters, especially the moving speed of the x and y motors, the diameter of the nozzle, as well as the thickness and solidity level of each layer. Ultimately the generated 3D phantom, made of ABS plastic, has the same shape and height of the imaged object.
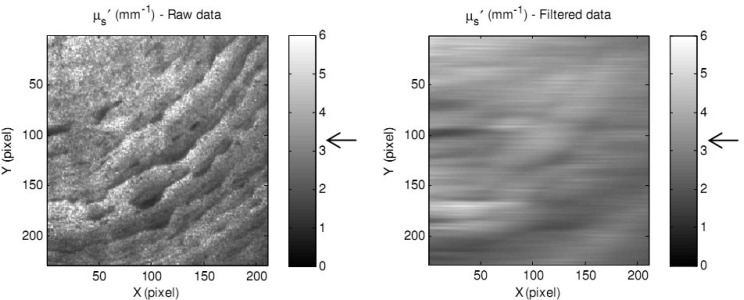
One issue when printing 3D phantoms with ABS plastic is the formation of small filaments (like plastic strings) or pellets on the top surface of the created object, which partly affect the optical properties calculation. The severity of this issue depends on the aforementioned printer parameters. In order to minimize this issue, a digital low-pass filter (2 of order and 1.5 Hz of cut-off frequency), was used to filter high frequency filaments. An example of the reduced scattering coefficient maps of an ABS sample before and after applying a low-pass filter and expected values are shown in Fig. 3 .
Fig. 3.
A reduced scattering coefficient map of a 3D phantom with plastic filament effect before (left) and after (right) applying a low-pass filter.
Along with elimination of filament structure, some data content of the imaged object was also filtered unexpectedly because of the low cut-off frequency. An alternative way to improve the result was smoothing the surface of the 3D phantom manually. Slight sanding of the phantom’s surface did not influence the height and structure of the 3D phantom significantly (less than 0.3 mm). In this study, most of 3D phantoms were built and lightly sanded to minimize the filament effect on the top surfaces of the objects.
2.5. Curvature correction method using 3D phantom
The method proposed in this paper for curvature correction uses a 3D phantom made of ABS to be the reference in the normalization of the SFDI images. This 3D phantom is a very close match to the real object with less than 10% error.
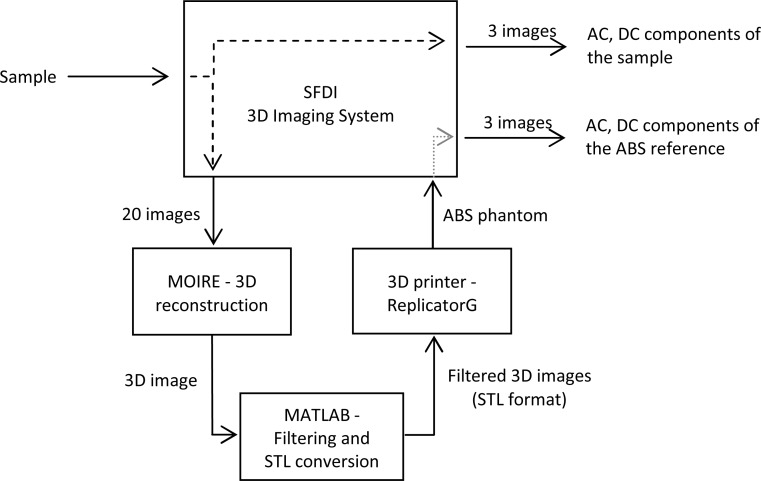
A complete set of images for our process, shown in Fig. 4 , includes three SFDI images for the optical properties calculation and twenty images for an accurate 3D reconstruction. For 3D reconstruction, a set of three images of phase-shifted gray structure-pattern would be sufficient [11], it has been demonstrated that even only one image of the object under a color structured-pattern illumination can accomplish 3D reconstruction [26]. In this study however, we used a higher number of images to obtain the most accurate 3D surface profile.
Fig. 4.
A block diagram for the correction method using 3D ABS phantom.
Great care is given to position the measured sample and the 3D ABS reference in the same location. In order to register the positions of the real object and the ABS phantom, we first fixed a gray color paper on the reference plane by using double sided tape. The real object was then placed on the background paper and a black pen was used to outline the object on the paper. Special symbols were used to recognize main landmarks on the real object and facilitate registration. The outlined object was then replaced with the ABS phantom.
Finally the AC and DC components of the real object were normalized by the AC and DC components of the ABS reference to achieve correct optical properties. The whole imaging process takes about 2 minutes.
2.6. Gelatin phantoms
In order to test our correction on different object shapes, similarly to the literature [27–29], gelatin homogeneous phantoms with tissue-like optical properties (µa and μs′) were formed in commercially available moulds. The phantoms were made from unflavored gelatin powder (Swann′s Pantry Inc., USA), whole milk as a scattering agent, and black ink (Black India, Higgins, Leeds, MA) as an absorber. A gelatin solution was prepared by dissolving gelatin powder in whole milk at 140°F to encourage a complete dissolution. Ink was added and was stirred well. The gelatin solution was then poured into the moulds (an eyeball and a small mouse) and was kept on a flat and stable surface until solidification was achieved. The concentration of gelatin, 60 mg/ml, was maintained identical for all of the phantoms while the volume concentration of milk and ink in the whole solution was 99.98% and 0.02% for the gelatin eyeball phantom and 99.96% and 0.04% for the gelatin mouse phantom respectively. In the meanwhile, each phantom gelatin solution was also shaped in a glass cuvette (40 mm x 40 mm x 3 mm) for a separate optical properties measurement using an integrating sphere and IAD.
3. Results
Several tests were conducted to verify the hypothesis that a 3D ABS phantom can be used as a reference in SFDI improving the curvature correction.
Our approach was to compare the results obtained with 3D ABS phantoms to the one obtained with a flat polyurethane (µa = 0.14 mm−1 and μs′ = 2.21 mm−1) phantom. The latter had been previously used in SFDI based studies [24]. For the rest of the paper we will use the following nomenclature: real object as the element of which we wish to obtain the optical properties, ABS phantom as the object shaped as the real object and printed with the Makerbot printer, finally flat phantom as the flat polyurethane standard previously described.
Optical properties of objects surfaces having minimum 4 mm in height variations and up to 80 degrees in tilt angles were calculated. Samples were: a homogeneous polyurethane phantom with a cylindrical shape, and the gelatin eyeball and mouse.
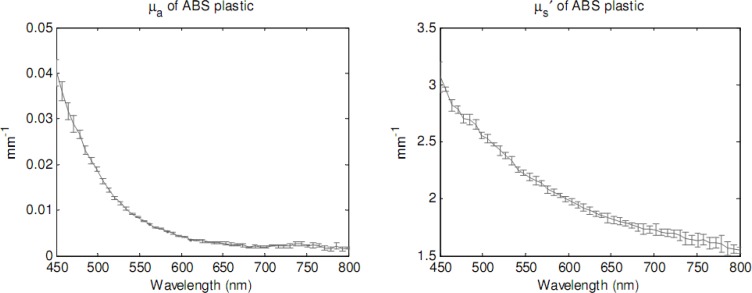
Optical properties of ABS plastic were measured with IAD in the range of wavelengths 450 to 800 nm, as plotted in Fig. 5 . Average value and standard deviation of absorption and reduced scattering coefficients were calculated and indicated in the figure. At the observed wavelength of 518 nm, optical properties of ABS are 0.014 ± 0.00 mm−1 for µa and 2.44 ± 0.04 mm−1 for µs′. The used ABS plastic, in whitish-yellow color, is a diffusive material. The optical properties calculated with IAD are later used as known parameters of the reference in SFDI. A refractive index (n) of 1.53 was utilized for the ABS plastic [30].
Fig. 5.
Absorption coefficient (left) and reduced scattering coefficient (right) of ABS plastic, measured by IAD.
3.1. Curvature correction for a simple surface
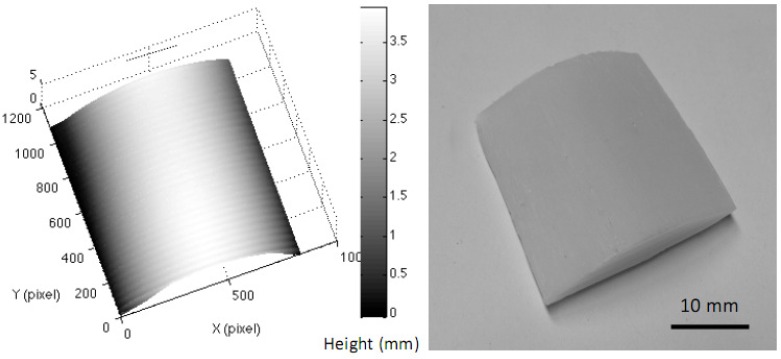
A polyurethane cylindrical phantom, different from our flat phantom (µa = 0.08 mm−1 and μs′ = 2.2 mm−1), with 4 mm difference in height (base to top), and maximum 30 degrees in surface slope in the imaging field was used. The reconstructed 3D image of the cylindrical phantom and the regenerated ABS phantom are shown in Fig. 6 .
Fig. 6.
A reconstructed 3D image of the cylindrical phantom and the regenerated ABS 3D phantom.
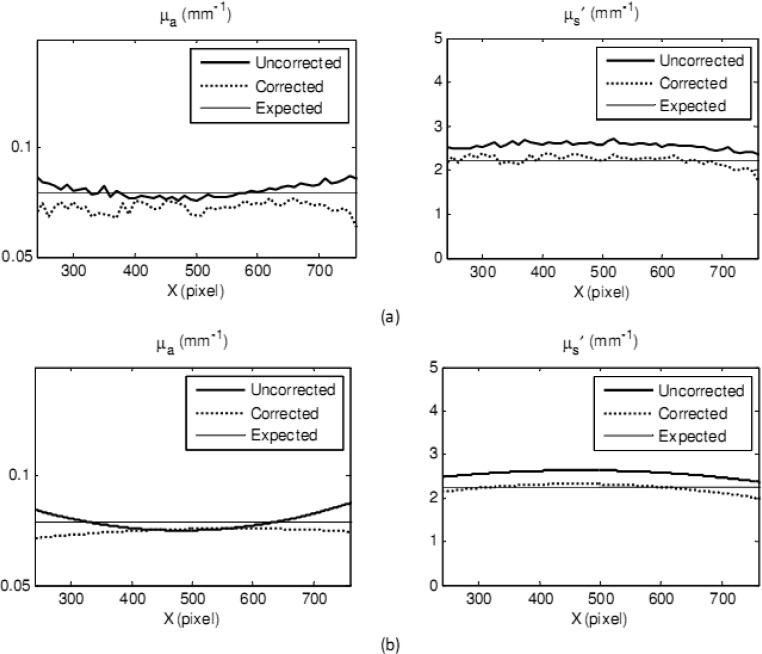
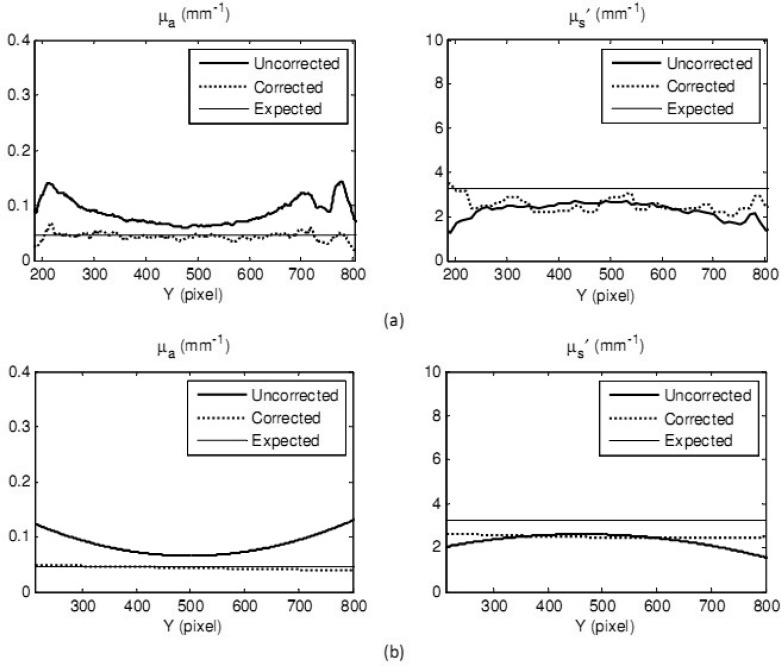
To correct its optical properties, the real object was normalized by the ABS phantom (corrected data) and the by the flat phantom (uncorrected data). Mean values along the Y-axis of the reconstructed optical properties maps for both cases are shown in Fig. 7(a) , and similarly for reduced scattering coefficient. In order to observe the general tendencies of the data, curve fitting was also applied, as shown in Fig. 7(b). Mean values of absorption and reduced scattering coefficients of a 300 x 300 pixels area of both corrected data and uncorrected data were also calculated. A region of interest was selected along the lines shown in Figs. 7(a) and 7(b). Percentage errors of the mean values compared with the expected value of absorption coefficient were 3.8% for corrected data and 3% for uncorrected data, respectively. Meanwhile percentage error of reduced scattering coefficient was decreased from 13.6% to 4.5% after correction.
Fig. 7.
Optical property measurement of a cylindrical polyurethane element (real object): mean values along the Y-axis of the uncorrected data (thick solid curves) and corrected data (dashed curves) and expected values from IAD (thin solid curves) of absorption coefficients (left) and reduced scattering coefficients (right). Raw data is shown in Fig. 7(a) and curve-fitted data is shown in Fig. 7(b).
3.2. Curvature corrections for complex surfaces
Although curvature correction is often limited to simple curvatures [12,13] we wanted to test the ability of our methodology with more complex object with higher curvature and various changes in profile. We picked two elements that are of interest to us (an eyeball and a small mouse).
The real object was first normalized by the ABS phantom of the same shape (corrected data), and then by the flat polyurethane phantom (uncorrected data). Uncorrected data and corrected data were finally compared to show the performance of this correction method.
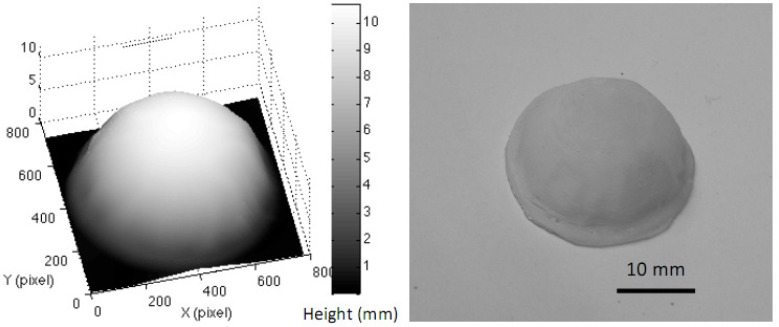
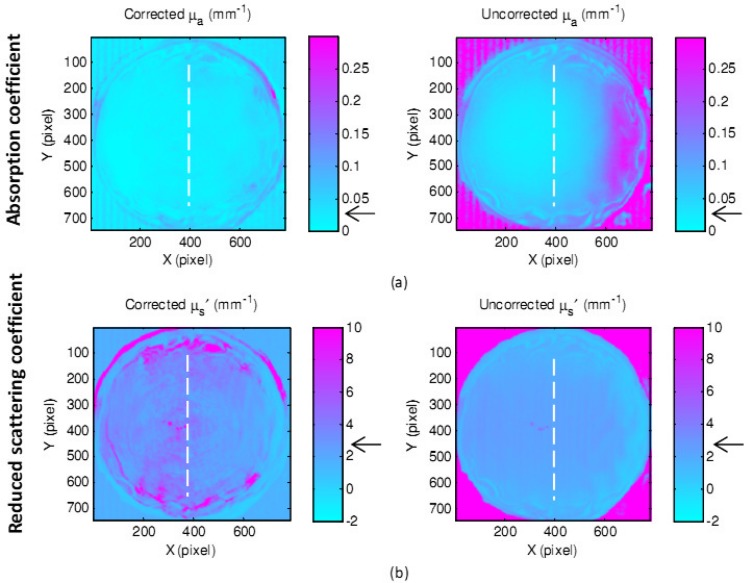
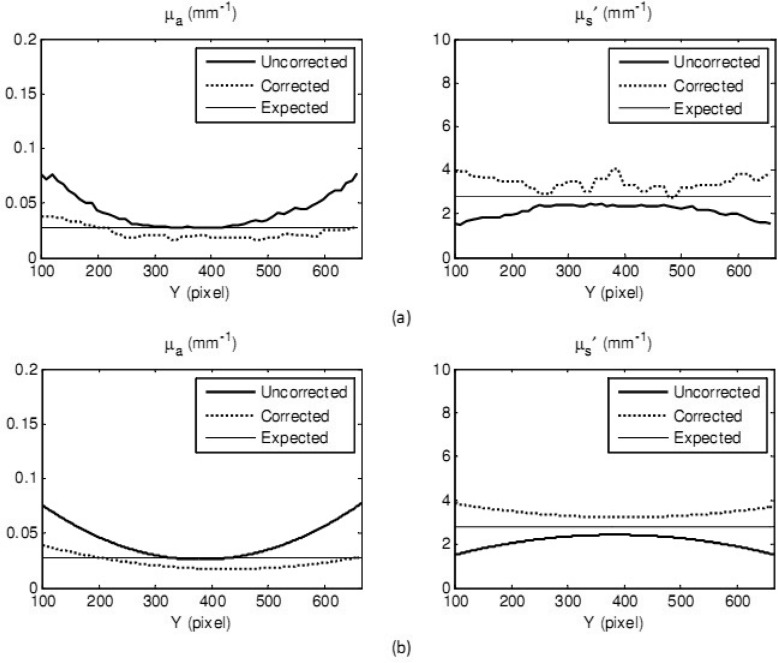
The gelatin eyeball (µa = 0.028 mm−1 and µs′ = 2.8 mm−1) with a maximum 10 mm in height, 70 degree in slope was utilized. The reconstructed 3D image of the eyeball phantom and the regenerated ABS phantom are shown in Fig. 8 . Shown in Fig. 9 are the maps of absorption coefficients (a) and reduced scattering coefficients (b) with and without correction. Pointed arrows are at the expected values measured from IAD. Vertical cross-sectional plots (raw data and curve-fitted data) through the center of the eyeball (the white dashed lines) of absorption and reduced scattering coefficients are demonstrated in Fig. 10 . Percentage errors of the mean values of absorption coefficients and reduced scattering coefficients, of an area of 300 x 300 pixels, were compared with the expected values. The area was chosen across the lines visible in Fig. 9. The percentage error of the absorption coefficient was decreased from 82.1% for uncorrected data to 21% for corrected data, and from 19.3% to 10.7% for the reduced scattering coefficient.
Fig. 8.
A reconstructed 3D image of the gelatin eyeball phantom, and the regenerated ABS 3D phantom.
Fig. 9.
Maps of absorption coefficients (a) and reduced scattering coefficients (b) of a gelatin eyeball phantom with and without correction.
Fig. 10.
Optical property measurement of a gelatin eyeball phantom: vertical cross-sectional plots, through the center of the eyeball, of the uncorrected data (thick solid curves) and corrected data (dashed curves) and expected values from IAD (thin solid curves) of absorption coefficients (left) and reduced scattering coefficients (right). Raw data is shown in Fig. 10(a) and curve-fitted data is shown in Fig. 10(b).
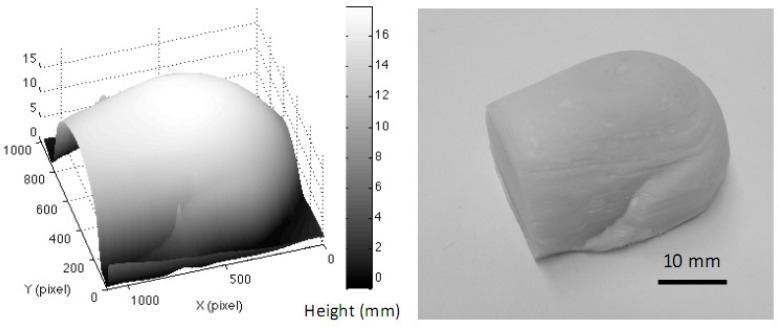
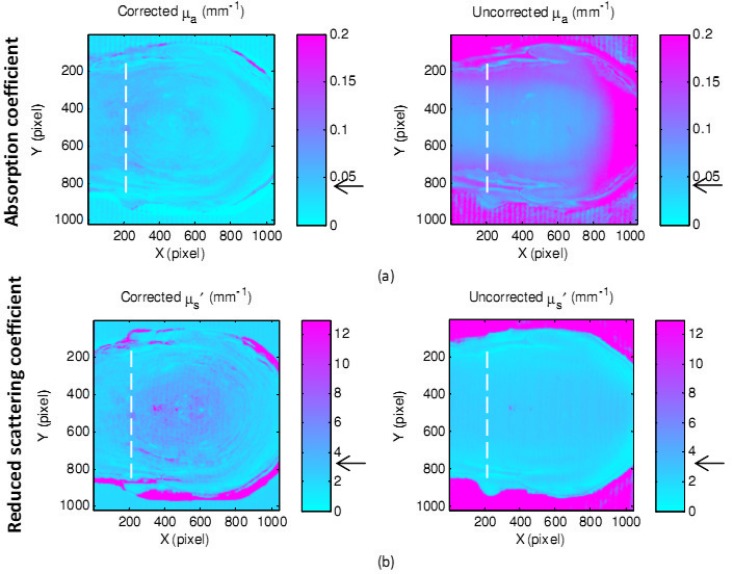
A more complicated and close-to-reality structure was used next. A gelatin mouse with a maximum height of 18 mm, a maximum slope of 80 deg and optical properties of µa = 0.045 mm−1 and µs′ = 3.2 mm−1 was created. The reconstructed 3D image of the back of the gelatin mouse phantom and the regenerated ABS phantom are shown in Fig. 11 . Figure 12 shows the maps of absorption coefficients (a) and reduced scattering coefficients (b) of the gelatin mouse with and without applying the shape correction. Pointed arrows are at the expected values measured from IAD.
Fig. 11.
A reconstructed 3D image of the back of the gelatin mouse phantom and the regenerated ABS 3D phantom.
Fig. 12.
Maps of absorption coefficients (a) and reduced scattering coefficients (b) of the gelatin mouse phantom with and without correction.
Note that some of the outlier dots present on the results of the eyeball and the mouse, are spurious specular reflections from wet gelatin during imaging. Also incorrect diffused reflectance received at the edges of the gelatin objects, due to specular reflectance and sudden changes in shape, leads to false optical properties detection. Therefore, regions of interest were chosen to exclude the edges. Furthermore, the small fringes observable only in the corrected optical properties in some parts of objects are consequences of small ABS plastic filaments not being removed. The other type of fringes appearing in parallel on both uncorrected and corrected data are formed because of the combination of nonideal sinusoidal fringes due to the gamma effect of both camera and projector.
For the purpose of showing the filament effect on the result, the middle part of the bottom of ABS mouse was not sanded. The region of interest was selected to avoid specular reflectance and un-sanded areas. Vertical cross-sectional plots (raw data and curve-fitted data) of absorption and reduced scattering coefficients along pixel 200 (the white dashed lines), belong to the ROI, are shown in Fig. 13 . The calculation of error was completed as in the previous examples, the percentage errors of absorption coefficient and reduced scattering coefficient were improved significantly. For absorption coefficient maps the uncorrected data yielded an error of 75% and 4.5% for corrected data. Similarly in the reduced scattering coefficient maps the error was diminished from 31.3% to 18.8% when correction was applied.
Fig. 13.
Optical property measurement of a gelatin mouse phantom: vertical cross-sectional plots, through the center of the eyeball, of the uncorrected data (thick solid curves) and corrected data (dashed curves) and expected values from IAD (thin solid curves) of absorption coefficients (left) and reduced scattering coefficients (right). Raw data is shown in Fig. 13(a) and curve-fitted data is shown in Fig. 13(b).
4. Conclusions and Discussions
In this study, we present an experimental method for curvature correction using 3D plastic phantoms. An FPP-based 3D imaging system was incorporated into a SFDI system to allow optical properties measurements and 3D reconstruction of an object. By applying a simple calibration method for FPP, high-quality 3D digital images were reconstructed and used to build 3D phantoms on Acrylonitrile Butadiene Styrene plastic. The experimental results of corrected optical properties of a cylindrical slab, a gelatin eyeball, and a gelatin mouse have shown the feasibility of an ABS plastic phantom to be used as a reference object in spatial frequency domain imaging. The effect of object surface profile on optical properties measurement, especially on absorption coefficients, has been reduced. This method can be applied from a slight to large surface′s curvature object and other optical imaging modalities sensitive to surface profile. For the cylindrical object, which was selected as the least challenging object, with a small curved surface, the results of optical properties with correction did not show a significant improvement. Nevertheless, when complex structures like the eyeball and the mouse were considered our correction method improved the results of several folds. The curvature effect on surfaces having 30 degree to 80 degree in slope and height variation larger than 4 mm can be detected and improved using the 3D phantom correction method. It has been observed [11] that the largest error in optical properties is in the absorption coefficient; hence our technique works best on that parameter, as shown in Fig. 9(a).
The combination of a 3D imaging method and an inexpensive 3D printer allows for the construction of phantoms of any shape. Nevertheless, the 3D phantom-based curvature correction method has several drawbacks. The appearance of small filaments on the 3D plastic phantom′s surface results in some non-uniformity in the results. Using a digital low-pass filter, or smoothing the surface with sand paper could minimize this issue. In circumstances where optical properties of homogeneous objects are of interest, digital filtering is a suitable choice. Whereas with inhomogeneous objects whose small details are sought, filtering may reduce data content, in this case the smoothing of the reference with sand paper is more appropriate. In this study, phantoms were slightly polished to partly minimize the effect of the filament but not to influence the height and structure of the 3D phantoms. Finally, a higher quality 3D printer would dramatically reduce this type of noise.
Another major drawback of this correction method is the lack of ABS plastic at different optical properties; although some printing methods use custom materials, they were not available for our specific printer. Theoretically in SFDI, any diffuse material can be used as a reference to calculate optical properties. However, it has been shown that the closer the optical properties of the reference are to the one of the measured object, the better the results. Furthermore making physical phantoms for calibration is time-consuming and may not be suitable for all clinical applications. Nevertheless we believe this technique offers a direct calibration method that is applicable to many laboratory scenarios, particularly when the calibration and validation of a clinical instrument is performed. The proposed method is also applicable to non-uniform objects due to the achievements of 3D imaging on variety of materials (such as conch shell, circuit board, and human body) [23] as well as SFDI in-vivo tests [11,24]. Improvement in imaging speed can be easily implemented both for SFDI and 3D reconstruction. The frequencies used for 3D reconstruction can be combined with the frequencies used for SFDI to obtain different penetration depths. Moreover, in the case of dynamic targets, multi-frames of each image could be recorded and ultimately the effect of movements artifact such as the one due to breathing could be corrected.
In future work we plan to study non-uniform objects as well as developing methodologies to generate 3D phantoms with different optical properties.
Acknowledgment
We acknowledge the support of NIH/NIBIB 1R15EB01343901.
Publisher’s note: This paper was updated May 9, 2012, to add an acknowledgment of funding.
References and links
- 1.Vogel A., Chernomordik V. V., Riley J. D., Hassan M., Amyot F., Dasgeb B., Demos S. G., Pursley R., Little R. F., Yarchoan R., Tao Y., Gandjbakhche A. H., “Using noninvasive multispectral imaging to quantitatively assess tissue vasculature,” J. Biomed. Opt. 12(5), 051604 (2007). 10.1117/1.2801718 [DOI] [PMC free article] [PubMed] [Google Scholar]
- 2.Bouchard M. B., Chen B. R., Burgess S. A., Hillman E. M. C., “Ultra-fast multispectral optical imaging of cortical oxygenation, blood flow, and intracellular calcium dynamics,” Opt. Express 17(18), 15670–15678 (2009). 10.1364/OE.17.015670 [DOI] [PMC free article] [PubMed] [Google Scholar]
- 3.S. L. Jacques, Spectroscopic determination of tissue optical properties using optical fiber spectrometer, available at http://omlc.ogi.edu/news/apr08/skinspectra/index.html
- 4.Delori F. C., “Noninvasive technique for oximetry of blood in retinal vessels,” Appl. Opt. 27(6), 1113–1125 (1988). 10.1364/AO.27.001113 [DOI] [PubMed] [Google Scholar]
- 5.Ramella-Roman J. C., Mathews S. C., “Spectroscopic measurements of oxygen saturation in the retina,” IEEE J. Sel. Top. Quantum Electron. 13, 00009999 (2007). [Google Scholar]
- 6.Cross K. M., Leonardi L., Payette J. R., Gomez M., Levasseur M. A., Schattka B. J., Sowa M. G., Fish J. S., “Clinical utilization of near-infrared spectroscopy devices for burn depth assessment,” Wound Repair Regen. 15(3), 332–340 (2007). 10.1111/j.1524-475X.2007.00235.x [DOI] [PubMed] [Google Scholar]
- 7.Cuccia D. J., Bevilacqua F., Durkin A. J., Tromberg B. J., “Modulated imaging: quantitative analysis and tomography of turbid media in the spatial-frequency domain,” Opt. Lett. 30(11), 1354–1356 (2005). 10.1364/OL.30.001354 [DOI] [PubMed] [Google Scholar]
- 8.D. J. Cuccia, “Modulated imaging: a spatial frequency domain imaging method for wide-field spectroscopy and tomography of turbid media,” Ph.D thesis (Department of Biomedical Engineering, University of California Irvine, 2006). [Google Scholar]
- 9.Bassi A., Cuccia D. J., Durkin A. J., Tromberg B. J., “Spatial shift of spatially modulated light projected on turbid media,” J. Opt. Soc. Am. A 25(11), 2833–2839 (2008). 10.1364/JOSAA.25.002833 [DOI] [PMC free article] [PubMed] [Google Scholar]
- 10.Cuccia D. J., Bevilacqua F., Durkin A. J., Ayers F. R., Tromberg B. J., “Quantitation and mapping of tissue optical properties using modulated imaging,” J. Biomed. Opt. 14(2), 024012 (2009). 10.1117/1.3088140 [DOI] [PMC free article] [PubMed] [Google Scholar]
- 11.Gioux S., Mazhar A., Cuccia D. J., Durkin A. J., Tromberg B. J., Frangioni J. V., “Three-dimensional surface profile intensity correction for spatially modulated imaging,” J. Biomed. Opt. 14(3), 034045 (2009). 10.1117/1.3156840 [DOI] [PMC free article] [PubMed] [Google Scholar]
- 12.Kainerstorfer J. M., Amyot F., Ehler M., Hassan M., Demos S. G., Chernomordik V., Hitzenberger C. K., Gandjbakhche A. H., Riley J. D., “Direct curvature correction for noncontact imaging modalities applied to multispectral imaging,” J. Biomed. Opt. 15(4), 046013 (2010). 10.1117/1.3470094 [DOI] [PMC free article] [PubMed] [Google Scholar]
- 13.M. Ehler, J. M. Kainerstorfer, D. Cunningham, M. Bono, B. P. Brooks, and R. F. Bonner, “Extended correction model for retinal optical imaging”, in Conf. Proc. Computational Advances in Bio and Medical Sciences, 93–98 (2011). [Google Scholar]
- 14.Schmidt F. E. W., Hebden J. C., Hillman E. M. C., Fry M. E., Schweiger M., Dehghani H., Delpy D. T., Arridge S. R., “Multiple-slice imaging of a tissue-equivalent phantom by use of time-resolved optical tomography,” Appl. Opt. 39(19), 3380–3387 (2000). 10.1364/AO.39.003380 [DOI] [PubMed] [Google Scholar]
- 15.Hebden J. C., Veenstra H., Dehghani H., Hillman E. M. C., Schweiger M., Arridge S. R., Delpy D. T., “Three-dimensional time-resolved optical tomography of a conical breast phantom,” Appl. Opt. 40(19), 3278–3287 (2001). 10.1364/AO.40.003278 [DOI] [PubMed] [Google Scholar]
- 16.Quan K. M., Christison G. B., MacKenzie H. A., Hodgson P., “Glucose determination by a pulsed photoacoustic technique: an experimental study using a gelatin-based tissue phantom,” Phys. Med. Biol. 38(12), 1911–1922 (1993). 10.1088/0031-9155/38/12/014 [DOI] [PubMed] [Google Scholar]
- 17.R. Grunert, G. Strauss, H. Moeckel, M. Hofer, A. Poessneck, U. Fickweiler, M. Thalheima, R. Schmiedel, P. Jannin, T. Schulz, J. Ocken, A. Dietz, and W. Korb, “ElePhant—an anatomical electronic phantom as simulation-system for otologic surgery,” in 28th Annual International Conference of the IEEE Engineering in Medicine and Biology Society, 2006. EMBS '06 (2006), vol. 1, pp. 4408–4411. [DOI] [PubMed] [Google Scholar]
- 18.M. A. Miller and G. D. Hutchins, “Development of anatomically realistic PET and PET/CT phantoms with rapid prototyping technology,” in IEEE Nuclear Science Symposium Conference Record,2007. NSS '07 (IEEE, 2007), pp. 4252–4257. [Google Scholar]
- 19.Vescan A. D., Chan H., Daly M. J., Witterick I., Irish J. C., Siewerdsen J. H., “C-arm cone beam CT guidance of sinus and skull base surgery: quantitative surgical performance evaluation and development of a novel high-fidelity phantom,” Proc. SPIE 7261, 72610L–, 72610L-10. (2009). 10.1117/12.813759 [DOI] [Google Scholar]
- 20.Rengier F., Mehndiratta A., von Tengg-Kobligk H., Zechmann C. M., Unterhinninghofen R., Kauczor H.-U., Giesel F. L., “3D printing based on imaging data: review of medical applications,” Int. J. CARS 5(4), 335–341 (2010). 10.1007/s11548-010-0476-x [DOI] [PubMed] [Google Scholar]
- 21.Carton A.-K., Bakic P., Ullberg C., Maidment A. D. A., “Development of a 3D high-resolution physical anthropomorphic breast phantom,” Proc. SPIE 7622, 762206–, 762206-8. (2010). 10.1117/12.845367 [DOI] [Google Scholar]
- 22.Miller B. W., Moore J. W., Barrett H. H., Fryé T., Adler S., Sery J., Furenlid L. R., “3D printing in X-ray and Gamma-Ray Imaging: A novel method for fabricating high-density imaging apertures,” Nucl. Instrum. Methods Phys. Res. A 659(1), 262–268 (2011). 10.1016/j.nima.2011.08.051 [DOI] [PMC free article] [PubMed] [Google Scholar]
- 23.Vo M., Wang Z., Hoang T., Nguyen D., “Flexible calibration technique for fringe-projection-based three-dimensional imaging,” Opt. Lett. 35(19), 3192–3194 (2010). 10.1364/OL.35.003192 [DOI] [PubMed] [Google Scholar]
- 24.Nguyen T. T. A., Shupp J. W., Moffatt L. T., Jordan M. H., Leto E. J., Ramella-Roman J. C., “Assessment of the pathophysiology of injured tissue with an in vivo electrical injury model,” IEEE J. Sel. Top. Quantum Electron. (to be published). [Google Scholar]
- 25.Moffitt T., Chen Y. C., Prahl S. A., “Preparation and characterization of polyurethane optical phantoms,” J. Biomed. Opt. 11(4), 041103 (2006). 10.1117/1.2240972 [DOI] [PubMed] [Google Scholar]
- 26.Geng J., “Structured-light 3D surface imaging: a tutorial,” Adv. Opt. Photonics 3(2), 128–160 (2011). 10.1364/AOP.3.000128 [DOI] [Google Scholar]
- 27.V. V. Tuchin, Tissue Optics: Light Scattering Methods and Instruments for Medical Diagnosis, 2nd. ed. (SPIE, 2007), Chap. 1. [Google Scholar]
- 28.Pogue B. W., Patterson M. S., “Review of tissue simulating phantoms for optical spectroscopy, imaging and dosimetry,” J. Biomed. Opt. 11(4), 041102 (2006). 10.1117/1.2335429 [DOI] [PubMed] [Google Scholar]
- 29.Maganti S. S., Dhawan A. P., “Optical nevoscope reconstructions using photon diffusion theory,” Proc. SPIE 2979, 608–618 (1997). 10.1117/12.280299 [DOI] [Google Scholar]
- 30.E. J. Troy, A. C. Fazey, and E. Crook, “A new impact modifier for toughening clear APET,” in Society of Plastics Engineers Annual Technical Conference ANTEC (2000), Vol. 58, pp. 2841–2843. [Google Scholar]


