Abstract
Several new bio-photonic techniques aim to measure flow in the human vasculature non-destructively. Some of these tools, such as laser speckle imaging or Doppler optical coherence tomography, are now reaching the clinical stage. Therefore appropriate calibration and validation techniques dedicated to these particular measurements are therefore of paramount importance. In this paper we introduce a fast prototyping technique based on laser micromachining for the fabrication of dynamic flow phantoms. Micro-channels smaller than 20 µm in width can be formed in a variety of materials such as epoxies, plastics, and household tape. Vasculature geometries can be easily and quickly modified to accommodate a particular experimental scenario.
OCIS codes: (170.3880) Medical and biological imaging, (120.3890) Medical optics instrumentation
1. Introduction
Quantitative assessment of vascular blood flow has been of interest for biomedical research for many years [1–4]. Disruption of flow, changes in vascular oxygen content, and other pathological factors has been linked to a number of diseases, including cancer and diabetes [5,6]. Imaging and sensing technologies that measure flow are becoming more common in both clinical and animal trials [7,8].
Typical techniques aimed at monitoring flow include: laser speckle [9–11], laser Doppler [12,13], Doppler ultrasound [14,15], autocorrelation methods [16], Doppler optical coherence tomography [4,17], and photo-acoustic tomography [18].
Calibration and validation of these technologies have been conducted primarily with simple phantoms mimicking one or two blood vessels [12,19]. Generally, they comprise one or two glass capillary tubes immersed in a scattering medium that mimics the biological environment surrounding the vasculature of interest.
The capillary tubes are connected to a syringe pump or other mechanical pumping system so as to accurately control the flow rate in the artificial vascular structure.
Chen et al, used one such phantom in their study of flow velocity using photoacoustic correlation spectroscopy [20], Duncan et al. [21] had a similar layout to mimic blood flow in the retina and used laser speckle imaging to quantify flow. Our group has also previously investigated an optical phantom that mimics the retina and its superficial vasculature, including flow using glass capillaries [22]. The complex structure of the layers underlying the eye vessels, retinal-pigmented epithelium, choroid, and sclera, were modeled with appropriate materials such as dyes, and titanium dioxide (TiO2) powder [22,23], while superficial capillaries were reproduced with a quartz capillary tube connected to a syringe pump.
In this paper, we present our method for fast prototyping of phantoms simulating a superficial vasculature network, based on microfluidics. Our system aims to mimic environments such as the superficial retina capillaries, the oral mucosa vascular network, or a dorsal skinfold, i.e. in-vivo scenarios where the vasculature is exposed or embedded in a very weakly absorbing and scattering media.
Microfluidics have become a popular tool for micro-scale analysis in scientific and engineering areas such as chemistry, biology, biomedical engineering, clinical medicine, etc [24,25]. Soft lithography is one of the most common fabrication methods, in which a positive relief master mold is used to quickly replicate a microfluidic pattern with a polymeric or elastomeric material such as poly(dimethylsiloxane) (PDMS), poly(methyl methacrylate) (PMMA), etc. The fabrication of the master mold, which is the main concern of this method, receives much research effort with several schemes such as: the printing of photomasks on transparency films using laser printers [26] or photo-plotters [27] with resolution up to 10μm, the direct printing of master molds using office printers [28,29], and printing using commercial 3-D printers [30]. Recently, many other methods have been suggested to pattern the microfluidic channel network on tape or films, making use of the disparate available resources such as digital craft cutters [31] or high-resolution cutting plotters [32].
Because of the growing popularity and convenience of laser cutting systems, these tools have been utilized to cut microfluidic patterns in several kinds of material. Patterns can be directly engraved on PMMA [33] or PDMS [34] sheets, followed by a plasma treatment to bond with other sheets. Additionally, this technique can be used to cut patterns in paper, which are then sealed using wax and glass slides [35]. To avoid the complication of bonding processes, adhesive transfer tape has been used for direct bonding with a cover layer [36]. Patterns cut on single-sided tape have also been employed as a master mold for micromolding in a soft lithography process [37].
Parthasarathy et al. [38] used microfluidics as tissue phantoms. They constructed a PDMS based microfluidic device to model the capillary network in human brain and investigate laser speckle techniques. A conventional soft lithography technique was employed using PDMS and TiO2 to mimic the network with various channel widths and depths ranging from 10μm to 150μm.
Unlike these authors, our work pertains to direct, rapid prototyping, which allows for easy fabrication of diverse geometries. Furthermore, the vasculature constructed with our methods will not be embedded in a scattering medium, but will be superficial and therefore constitutes the first environment that an incident beam will encounter before entering absorbing and scattering layers.
Traditional microfluidic fabrication techniques such as PDMS drop-casting or hot embossing require the design and fabrication of a master mold. Because the fabrication of this master mold is often performed using photolithography, it may require the fabrication of a photomask. As a result, traditional fabrication of microfluidic structures is not well suited for rapid prototyping. Changes in the design of the microfluidic structure may require days or even weeks to implement. Because our research spans a broad range of vascular architecture and environments it is extremely advantageous to employ a fabrication technique with a short “turn-around” time. Laser micromachining provides an accurate fabrication technique such that design changes can be implemented and tested in a matter of hours, or in some cases minutes. Laser micromachining is therefore an ideal technique for the rapid prototyping of microfluidic structures in an “interactive design cycle”.
2. Materials and methods
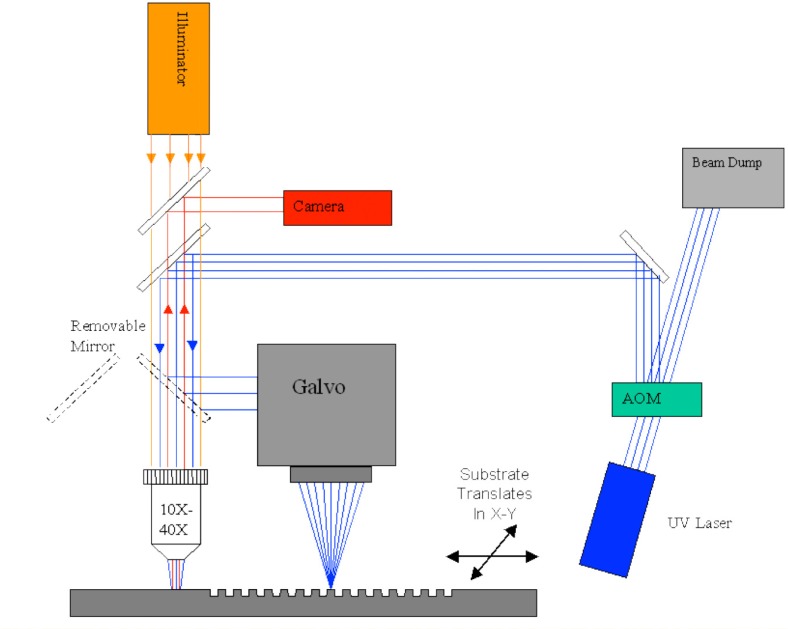
All the microfluidics discussed in this paper were laser micro-machined. The laser micro-machining system used for this purpose was previously built for a variety of different rapid prototyping applications [39–41], and is shown schematically in Fig. 1 . The system consists of a diode pumped solid state laser (266-HIPPO, Spectra Physics, Santa Clara CA, USA) operating at 266 nm wavelength, with 25 kHz pulse repetition rate and approximately 20 nsec pulse width. Pulse picking and laser fluence are controlled using an acousto-optic modulator (15000 Series, NEOS Technologies, Melbourne, FL, USA) and a delay generator (DG535, Stanford Research Systems, Sunnyvale, CA, USA). The laser beam is directed into either a microscope objective or a galvanometric beam scanner or ‘galvo’ (HurryScan 10, SCANLAB America Inc., Saint Charles, IL, USA) with a telecentric lens. The focal length of the telecentric lens is 10 cm. A digital signal processing board (RTC-4, SCANLAB America Inc., Saint Charles, IL, USA) controls the position of the beam scanner and synchronizes the firing of laser pulses. The laser beam is scanned across the substrate at a fixed linear speed. The entire system is controlled by a desktop computer and corresponding galvo software (ProLaseXP, American Laserware, Inc.Chuluota, FL, USA).
Fig. 1.
Laser micro-machining system.
The basic microfluidic structures constructed with our system followed a very simple layout (Fig. 2 ). Glass, plastic, or epoxy were used as the main substrate. Double or single sided adhesive tapes were added to the main substrate and were laser micro-machined to create the vascular structure. Finally, a plastic or glass layer was bonded to the top surface to seal the device. Each layer will be described in detail in the next section.
Fig. 2.
Basic microfluidic fabrication steps.
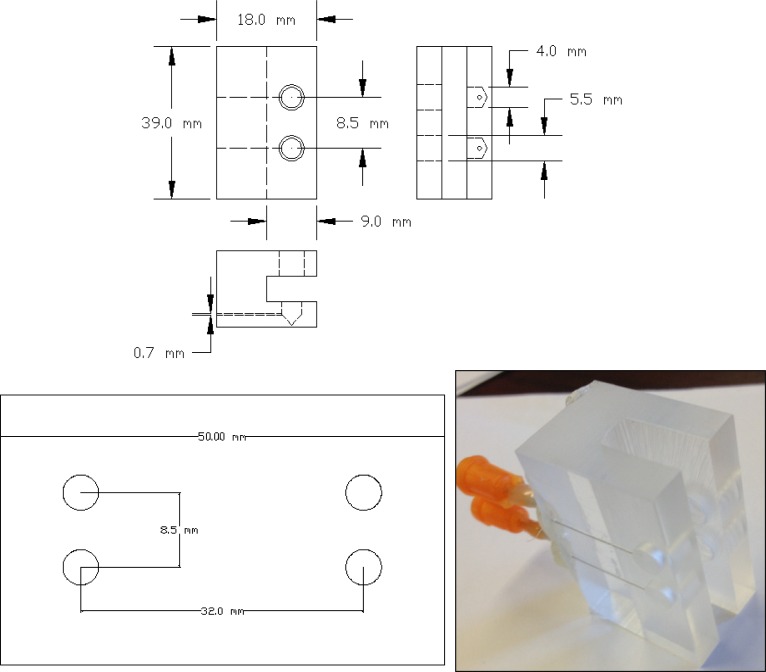
In order to easily interface micro-fluidics devices with the liquid pumping mechanism, we have designed a universal interface block that can accommodate a variety of different microfluidic geometries. The interface block design is shown in Fig. 3 , and consists of a Plexiglas® block machined to accommodate the microfluidic substrate and two hypodermic needles with Luer lock fittings. The hypodermic needles feed into two ports machined in the block and serve as inlet and outlet couplers for the flowing fluid. A rubber gasket (Buna-N rubber sheets of 1.5 mm thickness) is added between the micro-fluidic substrate and the interface block to achieve optimal sealing. The microfluidic substrate is pressed firmly against the sealing gasket using two thumb screws.
Fig. 3.
Layout (top) and implementation (bottom right) of universal interface block, along with microfluidic architecture (bottom left), units on drawing are in mm.
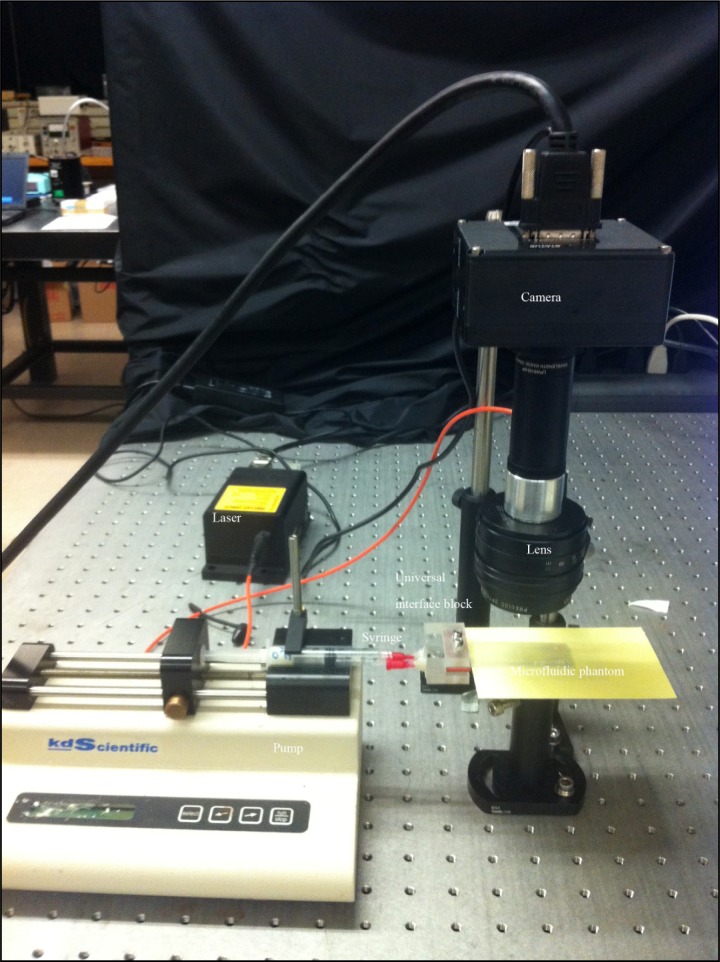
The complete experimental layout is shown in Fig. 4 below.
Fig. 4.
Experimental layout used in the measurement of flow. A syringe pump is interfaced to the microfluidic phantom through a universal interface block. On the right hand side a simple speckle flow imaging system (explained later in the paper) consisting of a fast acquisition camera, a laser source and an imaging lens.
Single-syringe pumps (Fisher Scientific, Waltham, MA) are employed to pump fluid including human blood or other liquids into the microfluidics with a controlled flow rate. A 1-mL plastic syringe (BD. Franklin Lakes, NJ), was used in all experiments.
2.1. Microfluidic device fabrication
A desired network pattern was designed using AutoCad (AutoDesk, San Rafael, CA). The drawing of the desired microfluidic pattern was modified to compensate for the laser beam width (laser kerf). The inlet circles on the left and right hand side had a diameter of 4 mm to accommodate the inlet and outlet ports on the interface block and were standard in all our microfluidic devices. A sample pattern is shown in Fig. 5 .
Fig. 5.
Design of microfluidics network and corresponding substrate.
Substrate materials used in this study included transparent, non-scattering materials such as Plexiglas® sheets with thickness of 3.1 mm and 19.0 mm and plastic microscope slides 75 mm x 25 mm x 0.44 mm (Science Stuff, Austin, Texas, USA), as well as non-transparent materials such as epoxy layers that include titanium dioxide as a scatterer and India ink as an absorber. The construction of these scattering and absorbing structures is described elsewhere [22] and we direct the reader to that article for an in-depth review of the methodology.
A variety of commercially available tape products were used to fabricate the microfluidic structures including; Scotch® Permanent Double Sided Tape (19.0 mm width and 88.9 μm thickness), Scotch® Gloss Finish MultiTask Tape (19.0 mm width and 50.8 μm thickness), Scotch® Shipping Packaging Tape (47.7 mm width and 78.7 μm thickness). These materials were chosen because they were commercially available, inexpensive, and nearly ubiquitous in modern laboratories. All these tapes laser micromachine well at 266 nm with no melting or charring and minimal heat affected zone (HAZ).
Scotch® Permanent Double Sided Tape is a cellulose film with an acrylate adhesive on both sides. This material is a nearly ideal bond-ply for rapid prototyping of microfluidic devices due to the fact that it adheres to a wide variety of surfaces, laser-micromachines well, and creates bonds that can withstand a significant pressure head without leaking.
Layers of tapes were carefully bonded onto the main substrate so as to cover the entire area of the device to be fabricated. The tape is applied in such a way as to prevent the formation of gaps or bubbles at the interface. The desired pattern was loaded into the laser system software and then cut on the tape surface.
In order to maintain the reproducibility of the channels' dimensions in the microfluidic devices, several parameters in the laser cutting process were kept constant. The output power of the laser was set at 1.45 W and was checked continuously to verify stability. The frequency of the laser (pulse repetition rate) was set to 25 kHz and the linear speed was 25 cm/s. We chose a relatively fast speed in order to minimize thermal effects on the tape during ablation. The channel depth may be varied by changing the number of laser passes. In order to determine the relationship between the number of passes and the channel depth several channels, each with a different number of passes, were cut into each type of tape and the resulting channel depth was measured using an optical microscope (Nikon Optiphot 100, Japan).
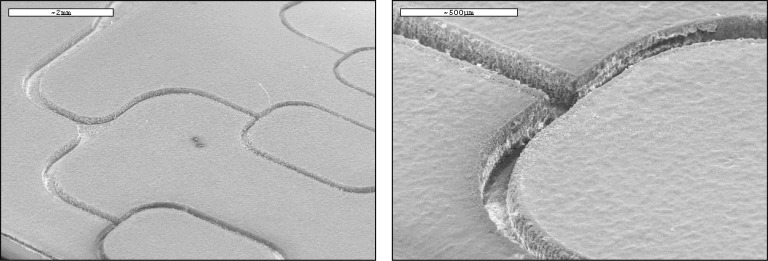
To test our ability to reproduce microfluidic channels with specific dimensions, multiple test channels were created on two different tape types (single and double sided tape). On all experiments 4 layers of tape were used. Channel depth was consistent throughout the network and through several trials with a resulting 4% error for the Scotch® single-sided tape (3 laser passes, 110 μm ± 5 μm), and 6.2% error for the Scotch® double-sided tape (4 laser passes, 160 μm ± 10 μm). Electron micrograph images of the channels' edges are shown in Fig. 6 , (SEM, Cambridge Instrument Stereoscan S360, Cambridge, UK). A standard low temperature process for biologic sample preparation was used to prepare the microfluidic structure for SEM imaging. As the structure is comprised of a non-conductive substrate and soft polymers (tapes) for the micro-channel geometries, a low temperature pulse sputtered gold layer was deposited. This process reduced coating damage to the microchannels, enables electron imaging, and reduces sample charging.
Fig. 6.
SEM images of the channels made of one-sided tape.
Both one layer and multiple layer microfluidic devices could be created with our approach. If a one-layer microfluidic device was desired, the laser-machined layer was sealed using either double-sided tape, Packaging tape, or a plastic microscope slide.
Otherwise, to produce a multi-layer microfluidics, we sealed the first layer with double-sided tape, added another layer of Packaging tape to be laser machined. The process was repeated for all the desired additional layers. Finally, a plastic microscope slide was added to complete the seal. Although the addition of the Packaging tape may seem redundant it was applied in order to obtain more robust seal. Furthermore, it was observed that the one-sided tape yields a cleaner channel but is more prone to failure than the double-sided tape.
To test the X-Y resolution of the laser system, we cut several lines of variable widths (20 to 160 µm in designed width) in the single-sided tapes and measured their actual widths versus the theoretical values. The results are summarized in Table 1 . We demonstrated that the laser system can create features smaller than 40-μm.
Table 1. Channel width and associated experimental error.
| Theoretical (μm) | Measured (μm) |
|---|---|
| 160 | 165 |
| 120 | 122.5 |
| 80 | 86.5 |
| 60 | 65.5 |
| 40 | 45.5 |
| 20 | 36 |
2.2. Optical properties of tape
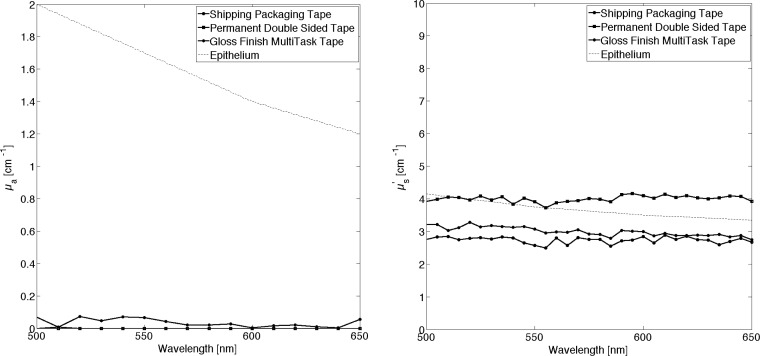
The optical properties of all three types of tape utilized during this study were measured. Measurements of index of refraction were conducted with an Abbe Refractometer (Bausch & Lomb, Rochester, New York). An experimental value of n = 1.51 at 630 nm was found for all tapes. This result is in agreement with published data of refractive index of Cellulose [42] (n = 1.47 at 630 nm), the structural material in tape, averaged with that of Styrene (n = 1.52 at 630 nm) the adhesive material. An integrating-sphere layout, and inverse Adding Doubling methodology [43] was used to measurement of optical properties of tape. The results are shown in Fig. 7 .
Fig. 7.
Optical properties of three types of Scotch tape, absorption coefficient is close to 0 (left hand side) the reduced scattering coefficient is similar to the one found in human epithelium.
We are interested in simulating superficial visible vasculature that is generally underlying an epithelial layer. A comparison with the optical properties of the tape and those of the human epithelium [44,45] shows significant similarities, particularly in the reduced scattering coefficient. The absorption coefficient is near zero for tape. We want to point out that these values were obtained following a particular process: tape was detached from its original roll and then combined into a multi-layer slab of thickness equal to 1 mm. The simple act of unrolling and reattaching the tape changes its appearance. This is ultimately the process used in the construction of microfluidics. The index of refraction of the human epithelium is ~1.4 ± 0.03, depending its location in the human body [45,46]. Given that this value is substantially different from that of tape, this discrepancy will need to be accounted for when devising experiments with this type of microfluidic structure. In future work we plan to investigate pigmented, translucent tapes to seek a better match with the optical properties of the epithelium.
2.3. Flow imaging system
A speckle-based flow imaging system was used. The system consists of a 12-bit, monochrome camera (Pantera® TF 1M60, Dalsa, Ontario, Canada) with 1024 x 1024 resolution, and maximum frame rate 60 Hz. A 50mm focal length F# 1.3 lens (Precise Optics, Bay Shore NY) was used with the camera to achieve high magnification and obtain a resolution of up to 7 μm/pixel. The light source was a 640 nm, 200 mW diode laser (Melles Griot, Longmont, Colorado), connected to a single mode fiber. Acquisition was achieved automatically with custom software (Matlab, Natick, MA).
Since the seminal work of Goodman on the statistical analysis of laser speckle [47], the use of laser speckle in measuring flow velocity has found its way into biomedical applications [19,48]. The basic mechanism is the observation of speckle contrast created by a coherent light source. Under certain conditions [47], a rough surface (RMS surface height variation large with respect to wavelength) illuminated by a coherent light source will produce a sharp speckle pattern. Any motion of the surface will decrease the speckle contrast due to the motion of the scatteres. Speckle contrast is generally measured over a small window or region of interest; in all our experiments that window was 7 pixels x 7 pixels. The speckle contrast can be calculated from the intensity of the captured image as follows:
where C is the speckle contrast; and are the standard deviation and mean of the region of interest.
2.4. Flow estimate
A quantitative estimate of flow is hard to achieve with present tools [49], techniques such as laser speckle contrast imaging often measure relative flow rather than true or absolute volumetric flow rates. Other techniques such as laser Doppler imaging can be more quantitative, yet they often rely on normalized units such as flux, which once again are hard to relate to an absolute volumetric flow rate.
The creation of dynamic phantoms where flow can be quantified and then related to an optical measurement could help in devising better calibration techniques for the validation of instruments. Our assessment of flow relies on two simplifying approximations: one that the fluids are uncompressible and two no elastic or plastic of the microfluidic device occurs during testing. In order to further characterize the flow dynamics within our microfluidic structures we used finite elements models (Comsol, Burlington, MA).
3. Results
Figure 8 shows an image of the most basic design fabricated for this study. A typical three stage branching system was constructed. This layout allows us to investigate the effect of different vessel sizes and the resulting flow velocities simultaneously.
Fig. 8.
Simple branching of a microfluidic system.
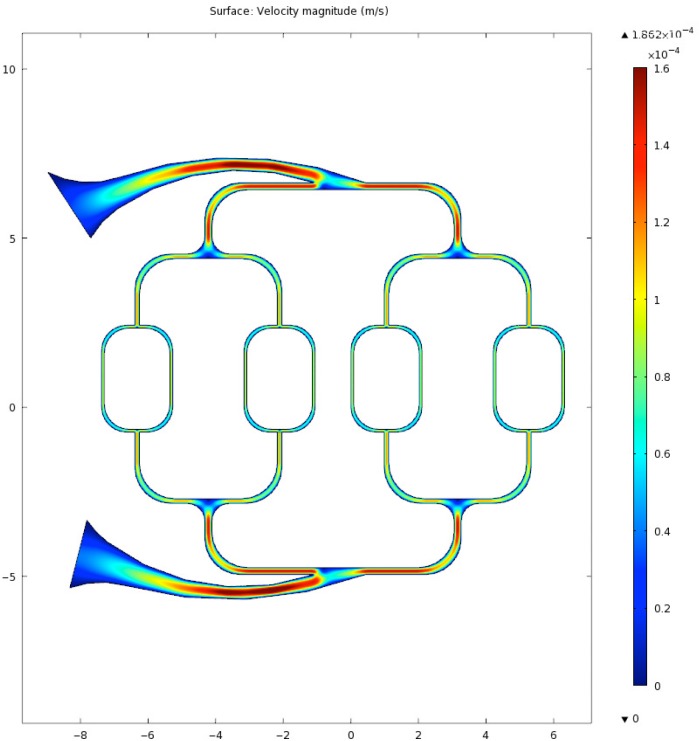
A finite element simulation of flow velocity for the above layout is shown in Fig. 9 where the input flow rate was 150ml/hr, blood density was 1060 kg/m3, and dynamic viscosity was 0.005 Ns/m2. The simulation assume a constant flow.
Fig. 9.
Blood velocity estimate in microfluidic using an FEM approach.
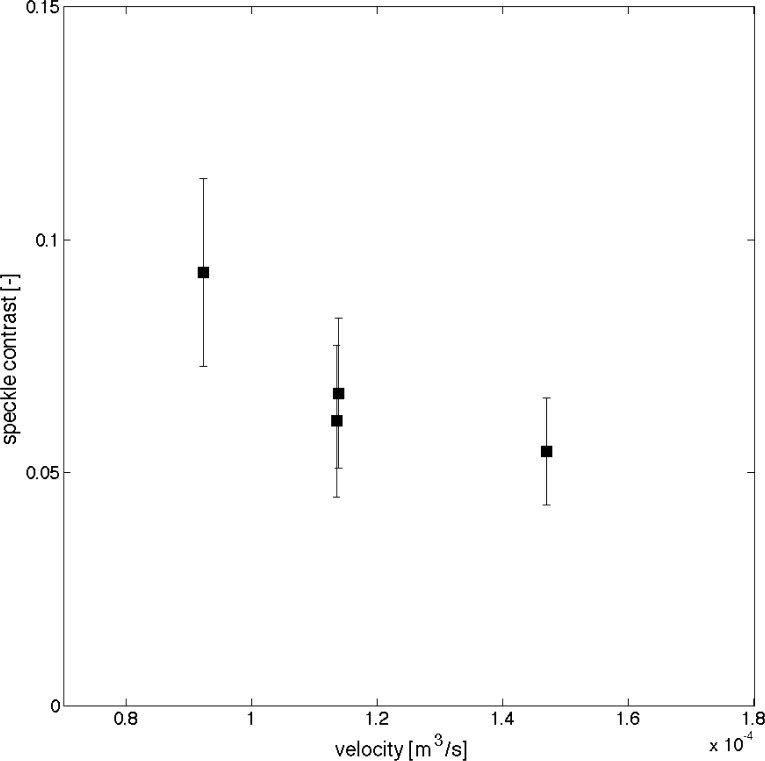
Comparison of local speckle contrast with simulations flow velocities show a reasonable trend, with speckle contrast decreasing as velocity in the vessel increases Fig. 10 .
Fig. 10.
Comparison of local speckle contrast with FEM simulation, 4 regions are captured in the data.
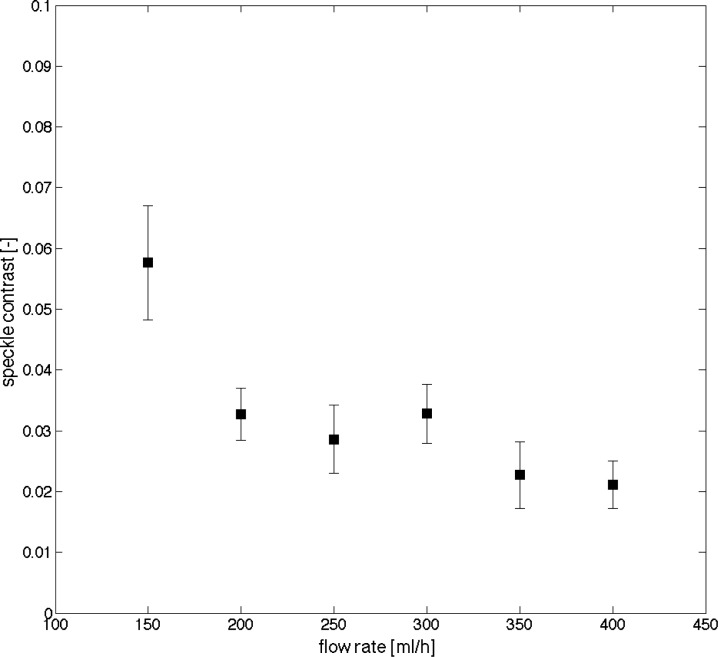
As shown in Fig. 11 , increasing flow rate at the inlet causes an increase of velocity across all vessels. The flow rate at the inlet channel of the microfluidic device is estimated as the flow rate at the syringe pump.
Fig. 11.
Speckle contrast at one vessel location (200 µm width) decreases with increasing flow rate at inlet.
Figure 12 shows a drawing and the realization of a two-layer system, where one vascular structure can be controlled by one pump and a second one at a depth of ~200 µm below the first can be controlled by a second pump. This layout could be utilized to study flow measurements at a variety of vessel depths. Blood with two different oxygenation levels could be used with this type of layout in spectroscopic applications where assessment and calibrated values of oxygen saturation are necessary [50].
Fig. 12.
Two level vasculature structure.
Overlapping vasculature is not uncommon in biology. For this reason a two layer phantom was designed. The phantom could be useful when observing the confounding effect of overlapping vasculature. In the layout shown in Fig. 13 a superficial vascular structure is overlaid (but not coincident) to a second similar structure. Hence at some location the two structures will be superimposed.
Fig. 13.
Two level overlapping vasculature structure.
Figure 14 shows an extension of this work, where the second layer is composed of a large reservoir that can accommodate moving fluid. This particular layout could be used to simulate an underlying extended vascular structure that is too fine to be resolved, as in the case of superficial retina vessel and underlying choroid [51]. The human choroid is a highly vascularized structure with densely packed capillaries. Choroidal blood is generally highly oxygenated (98-100% oxygen saturation). When optically measuring oxygen saturation on superficial arterioles and venules, it is important to consider the impact of the choroid on the measurement.
Fig. 14.
Two layers phantom, where the second layer is an extended reservoir.
Up to four different layers/depths were achieved with our construction methodology, although we believe that this could be extended in future iterations.
The brain, the esophagus, the oral mucosa, and the retina are just a few examples of exposed capillaries overly scattering and absorbing structures. Hence it is important to include in our study capillary network phantoms that try to mimic such a systems.
Figure 15 shows one such phantom that included a superficial vascular network superimposed onto a highly scattering and absorbing media (µa = 1 cm−1 µs’ = 12 cm−1). We have created a vast selection of underling substrate with a wide range of absorption and scattering coefficients. Optical properties of the substrate were measured with an integrating sphere and inverse adding doubling model.
Fig. 15.
One layer vasculature phantom overlaid to an absorbing and scattering epoxy layer. The optical properties of the epoxy layer where chosen to mimic the retina RPI and choroid.
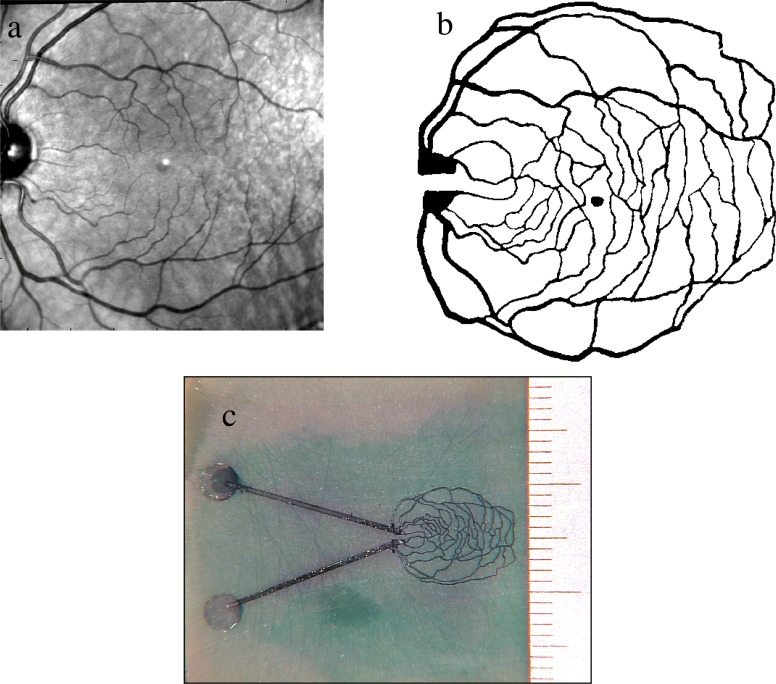
In Fig. 16 , we showcase the versatility of the laser machining system by fabricating a retinal phantom. A retinal image of a volunteer was captured with a fundus camera (Zeiss, Jana Germany), and modified with simple image processing software (Adobe Photoshop, including enhancing contrast and conversion to black-and-white (thresholding). The vessels in the upper half of the image were manually connected to vessels in the lower half of the image, in order to form closed loops. Figure 16a shows the unaltered retinal image. Figure 16b shows the processed monochrome image used to fabricate this device.
Fig. 16.
A vasculature phantom mimicking the retina of a healthy volunteer. Top left figure a, an original fundus image acquired with a commercial fundus camera. b, The same image after filtering with Photoshop. c, The realized phantom on an absorbing and scattering epoxy layer. Ruler divisions on the right hand side are in mm.
A custom substrate was fabricated by mixing an appropriate quantity of scatterer (TiO2 powder) and absorber (India ink) into a commercial epoxy resin (Devcon 5-minute Epoxy) in order to achieve the desired optical properties. The pattern, shown in Fig. 16b was loaded into the control software as a bitmap, raster image. The pattern was laser cut into the substrate with a uniform depth of approximately 100 microns. The fluidic structure was capped using transparent tape, with laser cut holes for the input and output ports. Using the interface block described above, a blue dye solution was pumped through the structure. Figure 16c shows an optical micrograph of the completed microfluidic structure. Note that the blue discoloration of the substrate surrounding the fluidic network resulted from a previous failed attempt at assembling the device. The device shown in Fig. 16c showed no leakage at the flow rate and pressure of the test.
4. Conclusions
Optical monitoring of flow in the human and animal superficial vasculature has reached the clinical stage and several new techniques measuring either flow or red blood cell velocity are now used in animal and human trials. To date, calibration and validation of the techniques is based on simple experimental layouts such as cylindrical capillary tubes embedded into a liquid or semi-liquid phantom mimicking the optical properties of the environment of interest. Recently some researchers [38] have suggested microfluidics as a possible phantom for validation.
The aim of the effort illustrated in this paper was to introduce a fast and inexpensive prototyping technique that can be used to generate optical phantoms targeting flow measurements for many different biological scenarios.
Our focus was limited to visible vasculature, underlying a semi-transparent protective layer of cells. This scenario occurs frequently in nature, as in the vasculature of the retina, or the mucosa tissue with a protective epithelium layer.
In the construction of the phantoms, we followed a modular approach. An off-the-shelf syringe pump could be adjusted to different flow-rates providing a very flexible platform for flow studies.
The pump to microfluidics interface was designed so as to accommodate different vasculature designs by using a fixed inlet and outlet geometry.
The large majority of the phantoms proposed in this work were laser micro-machined in Scotch adhesive tape. This material has several advantages: it is readily available, inexpensive, it provides an extremely good seal to flowing liquids even at moderately high-pressure levels, it is semi-transparent with a scattering coefficient similar to that of the human epithelium. SEM images of the laser-machined devices showed clear channels with repeatable sizes. Multiple layers can be achieved simply by overlaying tape sections. Disadvantages are that the index of refraction and the absorption coefficient of this material do not represent accurately the epithelium. Furthermore, the optical properties of the sealing adhesive tape are expected to change over time as the device ages and it is exposed to a variety of different liquids. Solvents cannot be used with these devices, as they will compromise the seal of the devices.
A significant advantage of the laser micromachining technique is the ability to construct multi-layered fluidic structures. We built two-layer phantoms to mimic the superficial vasculature of the retina and the underlying choroid. In one of such structure, the superficial and underlying vasculature coincided at some locations. A second phantom was constructed where the underlying choroid is mimicked with a thin reservoir covering the entire region of interest.
This is clearly a very simple approximation of what occurs in nature since the choroid has substantial structural features that increase its scattering coefficient. Nevertheless it is very useful when trying to decouple the effect of the bottom layer from the top layer.
The laser micromachining system versatility is demonstrated in the last example in the results section where the retinal vasculature of a volunteer obtained, with a fundus camera, is reproduced in a microfluidic device. The ability of fabricating realistic geometries could potentially be very beneficial when trying to quantify loss of flow in diseases such as diabetic retinopathy [48].
Our goal in this paper was to obtain a quantifiable measure of flow, and to aid in the calibration of non-invasive optical tools. It is then worth mentioning that direct measurement of flow could only be achieved at the main inlet branch based on the pump flow rate. Subsequent vasculature flow values were obtained making some assumptions of a lossless layout. FEM simulations were also used to obtain values that took into account the fluid viscosity as well as the micro-channel specific losses. In future work we intend to investigate direct measurement of flow, including thermocouple based [52] flowmeters or mechanical mill-like [53] sensors.
References and links
- 1.Lipowsky H. H., Zweifach B. W., “Network analysis of microcirculation of cat mesentery,” Microvasc. Res. 7(1), 73–83 (1974). 10.1016/0026-2862(74)90038-7 [DOI] [PubMed] [Google Scholar]
- 2.Kety S. S., Schmidt C. F., “The nitrous oxide method for the quantitative determination of cerebral blood flow in man: theory, procedure and normal values,” J. Clin. Invest. 27(4), 476–483 (1948). 10.1172/JCI101994 [DOI] [PMC free article] [PubMed] [Google Scholar]
- 3.Chen Z., Milner T. E., Dave D., Nelson J. S., “Optical Doppler tomographic imaging of fluid flow velocity in highly scattering media,” Opt. Lett. 22(1), 64–66 (1997). 10.1364/OL.22.000064 [DOI] [PubMed] [Google Scholar]
- 4.Izatt J. A., Kulkarni M. D., Yazdanfar S., Barton J. K., Welch A. J., “In vivo bidirectional color Doppler flow imaging of picoliter blood volumes using optical coherence tomography,” Opt. Lett. 22(18), 1439–1441 (1997). 10.1364/OL.22.001439 [DOI] [PubMed] [Google Scholar]
- 5.Grunwald J. E., DuPont J., Riva C. E., “Retinal haemodynamics in patients with early diabetes mellitus,” Br. J. Ophthalmol. 80(4), 327–331 (1996). 10.1136/bjo.80.4.327 [DOI] [PMC free article] [PubMed] [Google Scholar]
- 6.Carmeliet P., Jain R. K., “Angiogenesis in cancer and other diseases,” Nature 407(6801), 249–257 (2000). 10.1038/35025220 [DOI] [PubMed] [Google Scholar]
- 7.Nelson D. A., Krupsky S., Pollack A., Aloni E., Belkin M., Vanzetta I., Rosner M., Grinvald A., “Special report: Noninvasive multi-parameter functional optical imaging of the eye,” Ophthalmic Surg. Lasers Imaging 36(1), 57–66 (2005). [PubMed] [Google Scholar]
- 8.Burgansky-Eliash Z., Nelson D. A., Bar-Tal O. P., Lowenstein A., Grinvald A., Barak A., “Reduced retinal blood flow velocity in diabetic retinopathy,” Retina 30(5), 765–773 (2010). 10.1097/IAE.0b013e3181c596c6 [DOI] [PubMed] [Google Scholar]
- 9.Zakharov P., Völker A. C., Wyss M. T., Haiss F., Calcinaghi N., Zunzunegui C., Buck A., Scheffold F., Weber B., “Dynamic laser speckle imaging of cerebral blood flow,” Opt. Express 17(16), 13904–13917 (2009). 10.1364/OE.17.013904 [DOI] [PubMed] [Google Scholar]
- 10.Dunn A. K., “Laser speckle contrast imaging of cerebral blood flow,” Ann. Biomed. Eng. 40(2), 367–377 (2012). 10.1007/s10439-011-0469-0 [DOI] [PMC free article] [PubMed] [Google Scholar]
- 11.Ponticorvo A., Dunn A. K., “Simultaneous imaging of oxygen tension and blood flow in animals using a digital micromirror device,” Opt. Express 18(8), 8160–8170 (2010). 10.1364/OE.18.008160 [DOI] [PubMed] [Google Scholar]
- 12.Riva C., Ross B., Benedek G. B., “Laser Doppler measurements of blood flow in capillary tubes and retinal arteries,” Invest. Ophthalmol. 11(11), 936–944 (1972). [PubMed] [Google Scholar]
- 13.Feke G. T., Rivat C. E., “Laser Doppler measurements of blood velocity in human retinal vessels,” J. Opt. Soc. Am. 68(4), 526–531 (1978). 10.1364/JOSA.68.000526 [DOI] [PubMed] [Google Scholar]
- 14.Dauzat M., Laroche J. P., Deklunder G., Ayoub J., Quére I., Lopez F. M., Janbon C., “Diagnosis of acute lower limb deep venous thrombosis with ultrasound: trends and controversies,” J. Clin. Ultrasound 25(7), 343–358 (1997). [DOI] [PubMed] [Google Scholar]
- 15.Hatab M. R., Giller C. A., Clarke G. D., “Evaluation of cerebral arterial flow with transcranial Doppler ultrasound: theoretical development and phantom studies,” Ultrasound Med. Biol. 23(7), 1025–1031 (1997). 10.1016/S0301-5629(97)00030-6 [DOI] [PubMed] [Google Scholar]
- 16.Duncan D. D., Lemaillet P., Ibrahim M., Nguyen Q. D., Hiller M., Ramella-Roman J. C., “Absolute blood velocity measured with a modified fundus camera,” J. Biomed. Opt. 15(5), 056014 (2010). 10.1117/1.3494565 [DOI] [PMC free article] [PubMed] [Google Scholar]
- 17.Singh A. S., Kolbitsch C., Schmoll T., Leitgeb R. A., “Stable absolute flow estimation with Doppler OCT based on virtual circumpapillary scans,” Biomed. Opt. Express 1(4), 1047–1058 (2010). 10.1364/BOE.1.001047 [DOI] [PMC free article] [PubMed] [Google Scholar]
- 18.Yao J., Maslov K. I., Shi Y., Taber L. A., Wang L. V., “In vivo photoacoustic imaging of transverse blood flow by using Doppler broadening of bandwidth,” Opt. Lett. 35(9), 1419–1421 (2010). 10.1364/OL.35.001419 [DOI] [PMC free article] [PubMed] [Google Scholar]
- 19.Dunn A. K., Bolay H., Moskowitz M. A., Boas D. A., “Dynamic imaging of cerebral blood flow using laser speckle,” J. Cereb. Blood Flow Metab. 21(3), 195–201 (2001). 10.1097/00004647-200103000-00002 [DOI] [PubMed] [Google Scholar]
- 20.Chen S. L., Ling T., Huang S. W., Won Baac H., Guo L. J., “Photoacoustic correlation spectroscopy and its application to low-speed flow measurement,” Opt. Lett. 35(8), 1200–1202 (2010). 10.1364/OL.35.001200 [DOI] [PMC free article] [PubMed] [Google Scholar]
- 21.Duncan D. D., Kirkpatrick S. J., Gladish J. C., Hurst S. A., “Laser speckle contrast imaging for the quantitative assessment of flow,” Proc. SPIE 7176(717603), 717603–, 717603-8. (2009). 10.1117/12.809401 [DOI] [Google Scholar]
- 22.Lemaillet P., Ramella-Roman J. C., “Dynamic eye phantom for retinal oximetry measurements,” J. Biomed. Opt. 14(6), 064008 (2009). 10.1117/1.3258669 [DOI] [PMC free article] [PubMed] [Google Scholar]
- 23.de Bruin D. M., Bremmer R. H., Kodach V. M., de Kinkelder R., van Marle J., van Leeuwen T. G., Faber D. J., “Optical phantoms of varying geometry based on thin building blocks with controlled optical properties,” J. Biomed. Opt. 15(2), 025001 (2010). 10.1117/1.3369003 [DOI] [PubMed] [Google Scholar]
- 24.P. Tabeling, Introduction to Microfluidics (Oxford University, New York, 2005). [Google Scholar]
- 25.N. T. Nguyen and S. Wereley, Fundamentals and Applications of Microfluidics (Artech House: Boston, MA, 2002). [Google Scholar]
- 26.Duffy D. C., McDonald J. C., Schueller O. J. A., Whitesides G. M., “Rapid prototyping of microfluidic systems in poly(dimethylsiloxane),” Anal. Chem. 70(23), 4974–4984 (1998). 10.1021/ac980656z [DOI] [PubMed] [Google Scholar]
- 27.Linder V., Wu H. K., Jiang X. Y., Whitesides G. M., “Rapid prototyping of 2D structures with feature sizes larger than 8 microm,” Anal. Chem. 75(10), 2522–2527 (2003). 10.1021/ac026441d [DOI] [PubMed] [Google Scholar]
- 28.Bao N., Zhang Q., Xu J. J., Chen H. Y., “Fabrication of poly(dimethylsiloxane) microfluidic system based on masters directly printed with an office laser printer,” J. Chromatogr. A 1089(1-2), 270–275 (2005). 10.1016/j.chroma.2005.07.001 [DOI] [PubMed] [Google Scholar]
- 29.Vullev V. I., Wan J., Heinrich V., Landsman P., Bower P. E., Xia B., Millare B., Jones G., 2nd, “Nonlithographic fabrication of microfluidic devices,” J. Am. Chem. Soc. 128(50), 16062–16072 (2006). 10.1021/ja061776o [DOI] [PubMed] [Google Scholar]
- 30.McDonald J. C., Chabinyc M. L., Metallo S. J., Anderson J. R., Stroock A. D., Whitesides G. M., “Prototyping of microfluidic devices in poly(dimethylsiloxane) using solid-object printing,” Anal. Chem. 74(7), 1537–1545 (2002). 10.1021/ac010938q [DOI] [PubMed] [Google Scholar]
- 31.Yuen P. K., Goral V. N., “Low-cost rapid prototyping of flexible microfluidic devices using a desktop digital craft cutter,” Lab Chip 10(3), 384–387 (2010). 10.1039/b918089c [DOI] [PubMed] [Google Scholar]
- 32.Bartholomeusz D. A., Boutte R. W., Andrade J. D., “Xurography: rapid prototyping of microstructures using a cutting plotter,” J. Microelectromech. Syst. 14(6), 1364–1374 (2005). 10.1109/JMEMS.2005.859087 [DOI] [Google Scholar]
- 33.Klank H., Kutter J. P., Geschke O., “CO(2)-laser micromachining and back-end processing for rapid production of PMMA-based microfluidic systems,” Lab Chip 2(4), 242–246 (2002). 10.1039/b206409j [DOI] [PubMed] [Google Scholar]
- 34.Liu H. B., Gong H. Q., “Templateless prototyping of polydimethylsiloxane microfluidic structures using a pulsed CO2 laser,” J. Micromech. Microeng. 19(3), 037002 (2009). 10.1088/0960-1317/19/3/037002 [DOI] [Google Scholar]
- 35.Gong X., Yi X., Xiao K., Li S., Kodzius R., Qin J., Wen W., “Wax-bonding 3D microfluidic chips,” Lab Chip 10(19), 2622–2627 (2010). 10.1039/c004744a [DOI] [PubMed] [Google Scholar]
- 36.Nath P., Fung D., Kunde Y. A., Zeytun A., Branch B., Goddard G., “Rapid prototyping of robust and versatile microfluidic components using adhesive transfer tapes,” Lab Chip 10(17), 2286–2291 (2010). 10.1039/c002457k [DOI] [PubMed] [Google Scholar]
- 37.L.W. Luo, C.Y. Teo, W.L. Ong, K.C. Tang, L.F. Cheow and L. Yobas, “Rapid prototyping of microfluidic systems using a laser-patterned tape,” J. Micromech. Microeng. 17, N107–N111 (2007).
- 38.Parthasarathy A. B., Shin W. G., Zhang X. J., Dunn A. K., “Laser speckle contrast imaging of flow in a microfluidic device,” Proc. SPIE 6446, 644604–, 644604-11. (2007). 10.1117/12.700572 [DOI] [Google Scholar]
- 39.Mathews S. A., Mirotznik M., Good B. L., Piqué A., “Rapid prototyping of frequency selective surfaces by laser direct-write,” Proc. SPIE 6458, 64580R–, 64580R-14. (2007). 10.1117/12.705957 [DOI] [Google Scholar]
- 40.A. Piqué, H. Kim, R. Auyeung, J. Wang, A. Birnbaum, and S. Mathews, “Laser-based digital microfabrication,” in NIP25: International Conference on Digital Printing Technologies and Digital Fabrication (2009). [Google Scholar]
- 41.S. A. Mathews, M. Mirotznik, and A. Piqué, “Development of novel RF and millimeter wave structures by laser direct-write,” in Proceedings of LAMP2009—the 5th International Congress on Laser Advanced Materials Processing (2009). [Google Scholar]
- 42.Kasarova S. N., Sultanova N. G., Ivanov C. D., Nikolov I. D., “Analysis of the dispersion of optical plastic materials,” Opt. Mater. 29(11), 1481–1490 (2007). 10.1016/j.optmat.2006.07.010 [DOI] [Google Scholar]
- 43.S. A. Prahl, “Light transport in tissue,” Ph.D. thesis (University of Texas at Austin, 1988). [Google Scholar]
- 44.Drezek R., Sokolov K., Utzinger U., Boiko I., Malpica A., Follen M., Richards-Kortum R., “Understanding the contributions of NADH and collagen to cervical tissue fluorescence spectra: modeling, measurements, and implications,” J. Biomed. Opt. 6(4), 385–396 (2001). 10.1117/1.1413209 [DOI] [PubMed] [Google Scholar]
- 45.Chang S. K., Arifler D., Drezek R., Follen M., Richards-Kortum R., “Analytical model to describe fluorescence spectra of normal and preneoplastic epithelial tissue: comparison with Monte Carlo simulations and clinical measurements,” J. Biomed. Opt. 9(3), 511–522 (2004). 10.1117/1.1695559 [DOI] [PubMed] [Google Scholar]
- 46.Patel S., Marshall J., Fitzke F. W., 3rd, “Refractive index of the human corneal epithelium and stroma,” J. Refract. Surg. 11(2), 100–105 (1995). [DOI] [PubMed] [Google Scholar]
- 47.J. W. Goodman, “Statistical properties of laser speckle,” in Laser Speckle and Related Phenomena, J. C. Dainty, ed. (Springer, Berlin, 1995). [Google Scholar]
- 48.Briers J. D., Fercher A. F., “Retinal blood-flow visualization by means of laser speckle photography,” Invest. Ophthalmol. Vis. Sci. 22(2), 255–259 (1982). [PubMed] [Google Scholar]
- 49.Duncan D. D., Kirkpatrick S. J., “Can laser speckle flowmetry be made a quantitative tool?” J. Opt. Soc. Am. A 25(8), 2088–2094 (2008). 10.1364/JOSAA.25.002088 [DOI] [PMC free article] [PubMed] [Google Scholar]
- 50.Schwenzer K. J., Srinivas S., Kim D., Tiedeman J. S., “Oximetry of retinal vessels by dual-wavelength imaging: calibration and influence of pigmentation,” J. Appl. Physiol. 86(2), 748–758 (1996). [DOI] [PubMed] [Google Scholar]
- 51.Preece S. J., Claridge E., “Monte Carlo modelling of the spectral reflectance of the human eye,” Phys. Med. Biol. 47(16), 2863–2877 (2002). 10.1088/0031-9155/47/16/303 [DOI] [PubMed] [Google Scholar]
- 52.Rasmussen A., Mavriplis C., Zaghloul M. E., Mikulchenko O., Mayaram K., “Simulation and optimization of a microfluidic flow sensor,” Sens. Actuators A Phys. 88(2), 121–132 (2001). 10.1016/S0924-4247(00)00503-3 [DOI] [Google Scholar]
- 53.Rasmussen A., Zaghloul M. E., “In the flow with MEMS,” IEEE Circuits Devices Mag. 14(4), 12–25 (1998). 10.1109/101.708474 [DOI] [Google Scholar]


