Abstract
Hyperspectral imaging has the potential to achieve high spatial resolution and high functional sensitivity for non-invasive assessment of tissue oxygenation. However, clinical acceptance of hyperspectral imaging in ischemic wound assessment is hampered by its poor reproducibility, low accuracy, and misinterpreted biology. These limitations are partially caused by the lack of a traceable calibration standard. We proposed a digital tissue phantom (DTP) platform for quantitative calibration and performance evaluation of spectral wound imaging devices. The technical feasibility of such a DTP platform was demonstrated by both in vitro and in vivo experiments. The in vitro DTPs were developed based on a liquid blood phantom model. The in vivo DTPs were developed based on a porcine ischemic skin flap model. The DTPs were projected by a Hyperspectral Image Projector (HIP) with high fidelity. A wide-gap 2nd derivative oxygenation algorithm was developed to reconstruct tissue functional parameters from hyperspectral measurements. In this study, we have demonstrated not only the technical feasibility of using DTPs for quantitative calibration, evaluation, and optimization of spectral imaging devices but also its potential for ischemic wound assessment in clinical practice.
OCIS codes: (170.0170) Medical optics and biotechnology, (120.4800) Optical standards and testing
1. Introduction
Accurate assessment of wound tissue oxygenation is important for appropriate diagnosis, prevention, and treatment of chronic wounds [1,2]. From a diagnostic standpoint, measuring wound oxygenation will help in identifying the etiology, staging the disease, and guiding the treatment plans in debridement and amputation. From a preventive standpoint, measuring oxygenation in ischemic limbs can follow up wounds to prevent infection and other complications. From a therapeutic standpoint, monitoring wound oxygenation will evaluate oxygen demand of a given wound and will enable oxygen therapy dosing for personalized wound care.
Hyperspectral imaging opens a new avenue for non-invasive and real-time assessment of ischemic wounds. A hyperspectral imager collects a set of images at continuous wavelengths to reveal the absorption spectroscopic characteristics of multiple tissue components. Among these tissue components, oxygenated hemoglobin and deoxygenated hemoglobin are dominant tissue chromophores. Previous studies have demonstrated the technical feasibility for hyperspectral imaging of wound oxygenation [3–5]. However, its broader clinical application in chronic wound assessment is hindered by several limitations. First of all, many hyperspectral wound imaging systems have poor reproducibility and low accuracy. The hyperspectral measurements are vulnerable to variations of illumination, detection, and tissue surface conditions. Second, many hyperspectral wound imaging systems only provide relative information about tissue oxygenation, with significant measurement bias introduced by patient-to-patient variations in skin color, blood concentration, and adipose content. Third, appropriate interpretation of hyperspectral measurements is challenged by the missing link between tissue spectral properties and pathophysiological characteristics. Finally, there is no quantitative method to calibrate and evaluate the performance of spectral imaging devices for wound assessment.
One possible reason contributing to the above limitations is the lack of biologically relevant calibration standards. Since the hyperspectral imaging technique was originated from geological and remote sensing applications, the established calibration protocols are based on spectral reflectance measurements on a flat surface, without considering three-dimensional tissue morphology, diffuse scattering, background pigmentation, and other biological effects. The lack of biologically relevant calibration protocols has hindered the quantitative biological interpretation of hyperspectral measurements. The lack of traceable calibration standards has contributed to incomparable measurements and patient-to-patient variations for different spectral imaging systems. Due to these limitations, it is difficult to establish standard criteria for quantitative diagnosis and staging of chronic wounds.
To facilitate quantitative hyperspectral wound imaging, it is important to develop a traceable calibration standard with biological relevancy. An ideal calibration standard should have the following characteristics: (1) mimicking the optical properties of biological tissue; (2) reproducing the spectral characteristics of wound pathophysiology; (3) long shelf-time without degradation or spectral fluctuation; and (4) minimal batch-to-batch variations introduced by the fabrication process. In order to satisfy the above design requirements, we propose a digital tissue phantom (DTP) platform. A DTP is a hyperspectral data cube representing the spectral and functional characteristics of biological tissue. It is generated by acquiring hyperspectral data cubes from an actual biological system and reproducing it by a hyperspectral image projector (HIP). A DTP is an ideal substitute for a physical calibration phantom since it can be projected directly to other spectral imaging devices for system calibration and validation. Due to its digital nature, the same DTP can be easily disseminated to medical device manufacturers, clinical practitioners, government agencies, and other stakeholders in clinical wound management. Compared with a physical phantom standard, a DTP system has the potential for providing a biologically relevant, stable, reliable, and traceable calibration without concerns of degradation, portability, and manufacturing-induced variations.
In this paper, we will first introduce a hyperspectral image acquisition system and a hyperspectral image projector. Then we will demonstrate the proposed DTP platform by both an in vitro and an in vivo model. The in vitro model is based on a liquid blood phantom with controlled oxygenation levels. The in vivo model is based on porcine ischemic skin flaps. Spectral characteristics of both in vitro and in vivo DTPs are reproduced by a National Institute of Standards and Technology (NIST) Hyperspectral Image Projector (HIP) system and projected to a reference spectrometer with high fidelity. Finally, we will introduce a wide-gap 2nd derivative oxygenation algorithm for biological interpretation of hyperspectral measurements. To the best of the authors’ knowledge, the work described in this paper represents the first effort of developing and validating a DTP platform for ischemic wound imaging.
2. Hyperspectral image acquisition
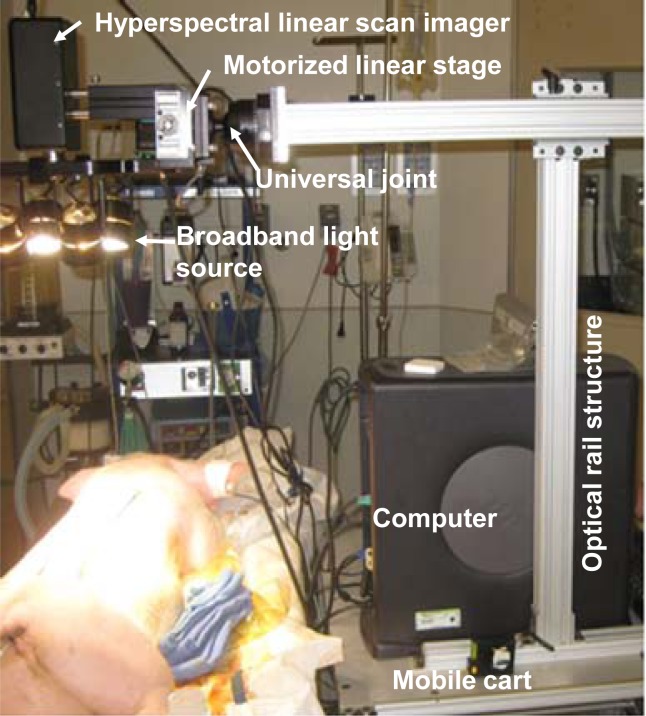
A PIKA II hyperspectral line scan imager (Resonon, Bozeman, MT) system was used to acquire hyperspectral data cubes from both the in vitro and the in vivo models, as shown in Fig. 1 . The imager is able to acquire spectral reflectance intensities along a line of 640 pixels at a spectral resolution of 2 nm. The working wavelength range of the imager is from 400 nm to 900 nm. The maximal sampling rate is 50 frames per second. The imager was mounted on a motorized linear stage and attached to an optical rail structure through a lockable universal joint. As the linear stage translates at the designated step size and speed, the line imager acquires a hyperspectral data cube within a designated two-dimensional field of view. A broadband halogen lighting system (Resonon, Bozeman, MT) was used to provide a stable illumination. The imaging setup was installed on a mobile cart for easy adjustment and quick deployment in an operating room. Prior to data acquisition, the system was calibrated following a standard procedure of setting exposure, setting focus, setting dark current, and setting response correction cube. The response correction cube was calibrated by a Fluorilon reflectance standard (Avian Technologies, LLC, Sunapee, NH). The aspect ratio of the hyperspectral images was adjusted by tuning the step size of the motorized linear stage. During a hyperspectral data acquisition session, a standard reference material (SRM) 2044 NIST traceable white diffuser (NIST, Gaithersburg, MD) was placed next to the sample for reflectance reference.
Fig. 1.
A hyperspectral imaging setup for benchtop and in vivo experiments. The system consists of a broadband light source, a hyperspectral linear camera, a motorized linear stage, a universal joint, and an optical rail structure installed on a mobile cart.
3. Spectral projection by hyperspectral image projector
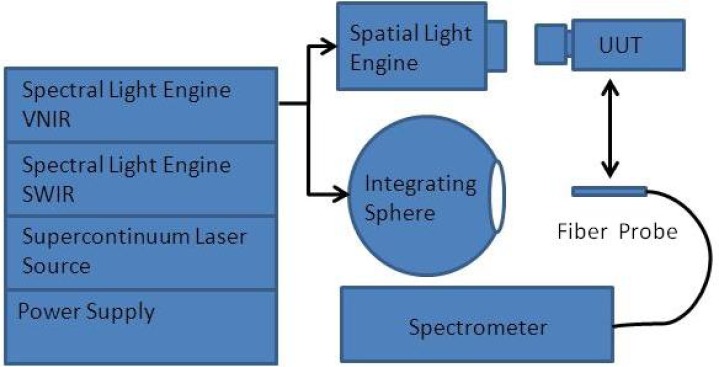
A NIST Hyperspectral Image Projector (HIP) was used to reproduce the spectral characteristics of the DTPs. The NIST HIP system was originally developed to support remote sensing imager characterization over the solar reflective region (250 nm to 2500 nm) [6]. The HIP is based on digital micro-mirror devices (DMDs) which allow for the control of light by accepting or rejecting light spatially on a pixel by pixel basis. Spectrally dispersed light incident on a DMD can be shaped to produce any arbitrary spectra. The spectra generated on a DMD can then be projected onto another DMD used to provide the spatial information by controlling the intensity of the full spectrum at each position. The spectral and spatial DMDs are cycled through a series of synchronized spectra and grey scale images. The integrated result is a scene with full spectral content at each pixel, in effect mimicking reality. The HIP can be used to produce a spatially uniform spectral source or alternatively spatially and spectrally complex scenes. When the HIP is used to project scenes of the tissue, the output product is referred to as a DTP [7]. In general, the HIP is set up to provide spectrally/spatially uniform or spectrally/spatially structured information. For cases where only spectral radiance is the desired source, an integrating sphere is used as the output optic to provide a spatially uniform distribution. For cases where full spatial/spectral scenes are needed, the HIP spatial light engine is illuminated, via a liquid light guide from the spectral light engine.
Since our primary interest is to reproduce the spectral characteristics of biological systems with high fidelity, the HIP was set up to provide spatially uniform information. In this configuration, an integrating sphere and a spectrometer were used to output and measure the optically produced spectra. The HIP was configured to match the spectra obtained from the biological system. The reflectance spectra were loaded to the HIP software one at a time to match the spectra based on the output from the spectral light engine.
Figure 2 shows the experimental setup. The output from the spectral light engine of the HIP was coupled into an integrating sphere via a liquid light guide. The output from the spectral light engine was then measured by a FieldSpec spectrometer (ASD Inc, Boulder, Co). The ASD FieldSpec was calibrated using NIST scales of spectral radiance. The spectral output from the spectral light engine was optimized through an iterative process where the figure of merit was the standard deviation of the differences squared. The optimization process was allowed to continue until a match of better than 3% was achieved. The typical number of iterations required to reach this point was 50 for each of the spectra. In the future use, the output of the spectral light engine can also be coupled to a spatial light engine and observed by a unit-under-test (UUT). The UUT could be any spectral imaging devices needing calibration or performance validation.
Fig. 2.
The schematic of the HIP experimental setup. The HIP system consists of a VNIR spectral light engine, a SWIR spectral light engine, a supercontinuum laser source, and a power supply. The output from the spectral light engine is coupled into an integrating sphere and a spatial light engine respectively. The output from the integrating sphere is measured by a spectrometer. The output from a spatial light engine is detected by a unit-under-test (UUT). The UUT could be any spectral imaging devices needing calibration or performance validation.
4. Generation of the in vitro DTPs
4.1. Blood phantom preparation
In vitro DTPs were generated based on a liquid blood phantom with a total volume of 300 mL. The phantom was prepared by mixing 4% porcine whole blood, India ink (Sanford, Bellwood, IL), and powdered milk solution (Topco Associate LLC, IL) in phosphate buffered saline (Fisher Scientific, Newton, NJ). The milk concentration was adjusted in order to reach a reduced scattering coefficient of 6.0 cm−1 (measured at 690 nm), as confirmed by an OxiplexTS tissue spectrophotometer (ISS Inc., Champaign, IL). The pH level of the phantom was adjusted to 7.4 by adding NaOH and HCl. The oxygenation level of the phantom was adjusted by dropwise addition of sodium hydrosulfite (0.025 g/mL) using a syringe pump (New Era Pump Systems, Inc, Farmingdale, NY).
4.2. Hyperspectral data acquisition
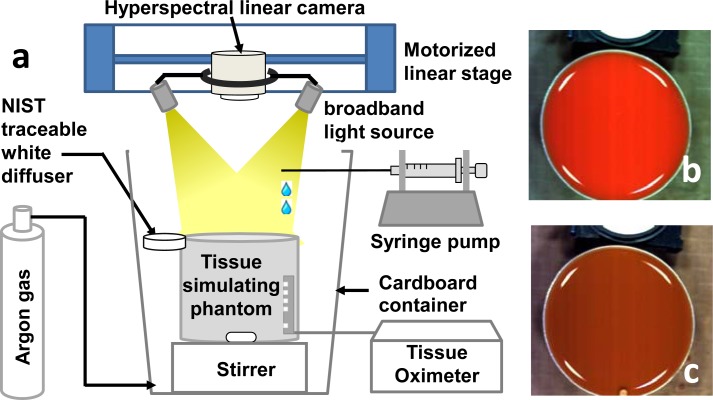
Hyperspectral data cubes were acquired from the above blood phantom using an experimental setup as shown in Fig. 3 . To eliminate the measurement artifact caused by oxygen in ambient air, we placed the blood phantom in a cardboard container and ventilated it with argon gas. During the test, 8 oxygenation plateaus ranging from nearly 100% to nearly 0% were achieved by dropwise addition of sodium hydrosulfite at the following doses: 0, 0.5, 0.3, 0.3, 0.3, 0.3, 0.3 and 0.5 mL. At each oxygenation plateau, the blood phantom was mixed to homogeneity by a magnetic stirrer and a hyperspectral data cube was acquired at 240 wavelengths from 380 nm to 885 nm by the PIKA II linear scanning imager. As comparison, the oxygenation level of the phantom was also measured by the OxiplexTS tissue spectrophotometer.
Fig. 3.
(a) Schematic drawing of the experimental setup for hyperspectral imaging of a tissue-simulating phantom. The phantom was placed in a cardboard container ventilated with argon gas. Sodium hydrosulfite was added dropwise by a syringe pump to reach different oxygenation plateaus. A NIST traceable white diffuser was placed next to the phantom as the reflectance reference. A hyperspectral linear camera was driven by a motorized linear stage to scan over the whole field of view. The oxygenation level of the phantom was compared with the invasive measurements by a tissue oximeter. (b) Blood phantom at full oxygenation. (c) Blood phantom at full deoxygenation. The white part on the top of (b) and (c) is the NIST traceable white diffuser.
4.3. Hyperspectral data projection
The hyperspectral data cubes acquired from the blood phantom were used as the in vitro DTPs. They were transmitted to NIST, projected by a NIST HIP system, and collected by a hyperspectral imaging device. To eliminate the spectral bias associated with illuminating and detecting conditions, each DTP was projected directly to the hyperspectral imaging device with full view pixel-to-pixel mapping. Figures 4(a) and 4(b) show the reflectance spectra of the actual phantom at different oxygenation levels and those of the DTPs, respectively. The averaged reflectance spectra were calculated from the same region of interest (ROI). Relative spectral differences between the blood phantom of different oxygenation levels and the corresponding DTPs were also calculated and plotted in Fig. 4(c). According to the Fig., the relative spectral deviations between the actual phantom and the DTPs are around ±0.5%, indicating that DTPs are capable of reproducing the spectral characteristics of the original phantom with high fidelity.
Fig. 4.
(a) Reflectance spectra of the blood phantom at different oxygenation levels ranging from 93% to 4%. (b) Reflectance spectra of the corresponding digital phantoms at the same oxygenation levels ranging from 93% to 4%. (c) The spectral differences between the blood phantom and the digital phantom at different oxygenation levels from 93% to 4%. Reflectance spectra in (b) is almost identical to those in (a) at different oxygenation levels, indicating that a DTP is able to reproduce the spectral characteristics of the original blood phantom with high fidelity.
5. Generation of the in vivo DTPs
5.1. Animal model preparation
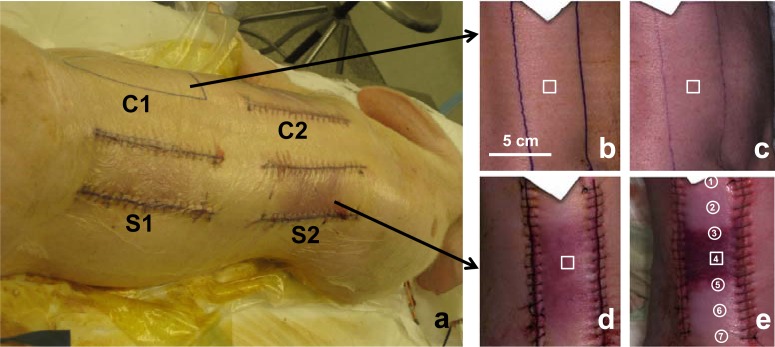
In vivo DTPs were prepared based on a preclinical model of chronic ischemic wound [8]. The animal protocol was approved by the Institutional Lab Animal Care and Use Committee (IACUC) at the Ohio State University (OSU) (protocol ID: 2009A0012). A domestic swine (~27kg) was anesthetized with Telazol, and the entire dorsal region was shaved. After the skin was cleaned with Nolvasan and 70% alcohol, a surgical marking pen was used to mark four incision areas of 15 cm x 5 cm in the dorsal region (labeled as “C1”, “C2”, “S1”, and “S2” in Fig. 5(a) ). Under the aseptic condition, three bipedicle skin flaps were created by making parallel incisions along two sides of the marked areas. Two sample dermal flaps (i.e., “S1” and “S2”) were created by elevating skin from the underlying tissue and placing silastic sheets underneath to prevent the graft bed reperfusion. One control flap (i.e., “C2”) was created by the similar procedure except that no silastic sheet was placed. The dermal flaps S1, S2, and C2 were sutured in place using 3-0 nylon sutures in a continuous pattern. C1 was the blank control of normal skin tissue without any incision. After the surgery, the dermal flaps were aseptically bandaged to limit contamination in the cage environment. The animal was provided with individual housing (21°C ±2°C; 40%–70% humidity) and standard care in accordance with the OSU IACUC guidelines.
Fig. 5.
(a) Ischemic skin flaps created in the dorsal area of a domestic pig. S1 and S2 are sample dermal flaps created by elevating skin from the underlying tissue and placing silastic sheets underneath to prevent the graft bed reperfusion. C2 is the control flap created by the similar procedure except that no silastic sheet is placed. C1 is the blank control of normal skin tissue without any incision. (b-c) RGB images of the hyperspectral data cubes acquired on the 1st day (b) and the 3rd day (c) after surgery from the control tissue (“C1”). (d-e) RGB images of the hyperspectral data cubes acquired on the 1st day (b) and the 3rd day (e) after surgery from the sample tissue (“S2”).
5.2. Hyperspectral data acquisition
The in vivo hyperspectral imaging tests were carried out at the OSU experimental animal surgical services. Hyperspectral data cubes were acquired from the control and the sample skin tissues by the hyperspectral linear scanning imager on the first and the third day after the skin flap surgery. Before each imaging session, the animal was sedated by Telazol (6 mg/kg) and anesthesia was maintained with isofluorane (1%–3%). The animal was first placed in the left lateral position with the right dorsal skin flaps exposed for hyperspectral imaging, and then switched to the right lateral position to image the skin flaps on the left side. The ambient light was shielded in order to minimize the background noise. A PeriFlux 5000 laser Doppler and transcutaneous oxygen meter (Perimed Inc., North Royalton, OH) was placed at seven spots along each skin flap to measure tissue oxygenation and perfusion levels at these positions. By the end of the 3rd day imaging session, the animal was euthanized and the tissue biopsies were taken for histopathology analysis. Figures 5(b)–5(c) are RGB images of the hyperspectral data cubes acquired on the first day and the 3rd day after surgery from the control (i.e., “C1”). Figures 5(d)–5(e) are those acquired from the sample skin flap (i.e., “S2”). A ROI was defined at the center of each hyperspectral data cube, and the reflectance spectrum was averaged within the ROI to study the spectral characteristics at different stages of a wound healing process.
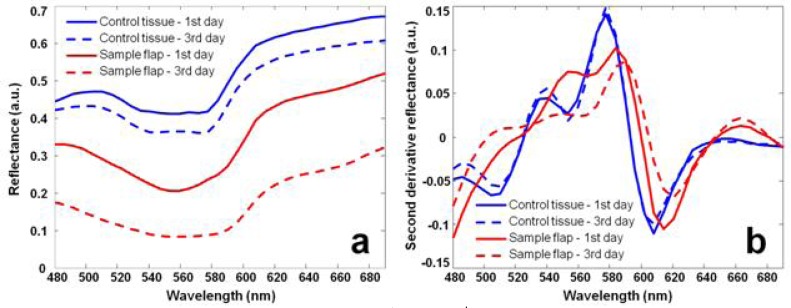
Figure 6 shows the reflectance spectra of the control and the sample skin flap acquired on the 1st and the 3rd days after surgery. According to Fig. 6(a), the reflectance spectrum of the sample skin flap changes significantly due to the developments of ischemia after surgery (red lines). However, the reflectance spectrum of the control also fluctuates even if no surgical resection has been made (blue lines). The non-specific fluctuation of the control spectrum may be caused by dirt, skin color change, surface condition variations, and the change of the illumination condition. These non-specific spectral fluctuations need to be eliminated or minimized so that the actual tissue hypoxia can be identified. For this purpose, we introduced the wide-gap 2nd derivative method for spectral analysis in hyperspectral imaging. Figure 6(b) shows the 2nd derivative spectra calculated from the conventional reflectance spectra in Fig. 6(a). The calculation used a spectral gap of 20 nm. According to Fig. 6(b), the 2nd derivative reflectance spectrum of the control remains consistent (blue lines), whereas that of the sample skin flap alters significantly after surgery (red lines), indicating the development of ischemia and hypoxia.
Fig. 6.
(a) Reflectance spectra acquired on the 1st and the 3rd days after surgery from the control and the sample skin flap. Spectral fluctuations can be observed on both the sample ischemic flap and the control. (b) Corresponding wide-gap 2nd derivative spectra. The 2nd derivative spectrum of the sample ischemic flap shows significant fluctuation after surgery, whereas that of the control tissue shows minimal fluctuation.
5.3. Hyperspectral data projection
The hyperspectral data cubes collected from in vivo porcine tissue were transmitted to NIST and projected to a different hyperspectral imaging device by a NIST HIP system. Figures 7(a) and 7(b) show the reflectance spectra averaged within 7 ROIs along the ischemic skin flap and those of the corresponding DTPs, respectively. The locations of these ROIs are indicated in Fig. 5(e). At these ROIs, the relative spectral deviations between the skin tissue and the corresponding DTPs were calculated and plotted in Fig. 7(c). According to Fig. 7(c), the relative spectral deviations at most of the 7 ROIs are nominally ±0.5% with the exception of spot #4. The maximal spectral deviation is observed at spot #4 where tissue ischemia is developed with the lowest overall reflectance. Nevertheless, the overall spectral deviations are relatively small, indicating that an in vivo DTP is capable of reproducing the spectral characteristics of the original biological tissue with high fidelity.
Fig. 7.
(a) Reflectance spectra obtained from the hyperspectral data cubes of the in vivo porcine ischemic skin flap at 7 different spots. (b) Reflectance spectra acquired from the corresponding in vivo DTPs. The in vivo DTPs were generated by projecting the hyperspectral data cubes using a HIP projector. Reflectance spectra in (b) are almost identical to those in (a) at different spots, indicating that a DTP is able to reproduce the spectral characteristics of the original ischemic skin flap with high fidelity.
6. DTPs for heterogeneous biological systems
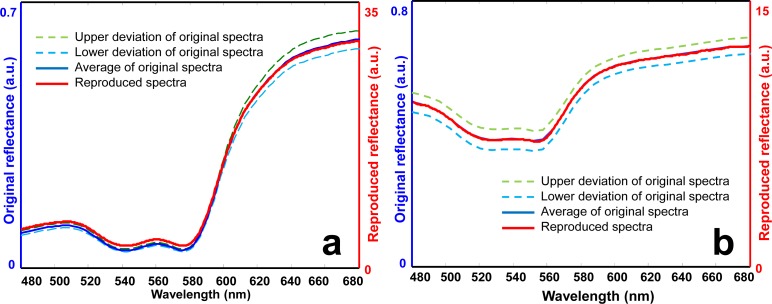
The spectral fidelity of the DTPs generated from heterogeneous biological systems was evaluated on both the in vitro blood phantom model and the in vivo porcine skin flap model. The reflectance spectra were averaged within each ROI of these models, and the spatial deviations were calculated. The HIP system was used to project the averaged reflectance spectrum to a spectrometer. The HIP-projected spectrum was compared with the original spectrum of the biological system in order to evaluate its spectral fidelity at the presence of tissue heterogeneity.
Figure 8(a) shows the averaged reflectance spectrum of the blood phantom, its spatial deviations, and the HIP-projected spectral reflectance (i.e., the DTP). According to Fig. 8(a), the DTP matches the reflectance spectrum of the original biological system well. Most of the spectral profiles of the DTP fall between the upper and the lower limits of the spatial deviation, indicating that the spectral characteristics reproduced by the DTP could be distinguished from the spectral variations due to tissue heterogeneity. Similar results were also observed for an ROI in the ischemic skin flap, as shown in Fig. 8(b). According to Figs. 8(a) and 8(b), the HIP system is able to reproduce the reflectance spectrum appropriately, with the spectral difference smaller than that caused by tissue heterogeneity, indicating the technical feasibility of using the HIP-projected DTPs to mimic the original tissue spectra for calibration and performance evaluation of medical optical imaging systems.
Fig. 8.
Comparison of the reflectance spectra of the original biological systems and those projected by the HIP. (a) Original and HIP-projected reflectance spectra of a blood phantom with full oxygenation. (b) Original and HIP-projected reflectance spectra at one ROI in the ischemic skin flap. Lower and upper deviations represent the spatial heterogeneity of the reflectance spectra.
7. Reconstruction of tissue oxygenation
A DTP is capable of preserving functional characteristics of biological tissue without the need for a biological sample or a physical phantom. Since the functional properties of biological tissue are represented by its spectral characteristics, an appropriate interpretation of these spectral characteristics is the key to link hyperspectral measurements with tissue pathophysiology. Among a variety of tissue functional parameters, oxygenated hemoglobin and deoxygenated hemoglobin are major chromophores contributing to the healing of an ischemic wound. Various algorithms have been developed to reconstruct tissue oxygenation levels from hyperspectral or multispectral measurements [9–12]. However, many of these algorithms calculate the relative changes of tissue oxygenation instead of the absolute values. Quantitative assessment of tissue oxygenation is hampered by patient-to-patient variations in skin color, tissue pigmentation, background absorption, blood concentration, and lipid content. In order to facilitate quantitative calibration and performance evaluation of spectral imaging devices in wound assessment, it is necessary to reconstruct tissue oxygenation levels with minimal patient-to-patient biases.
7.1. Algorithm development
We explored a wide-gap 2nd derivative algorithm for hyperspectral imaging of tissue oxygenation [5]. The algorithm takes the 2nd derivative of a reflectance spectrum so that non-specific variations in tissue scattering and background absorption can be minimized or even eliminated [13,14]. Once the wide-gap 2nd derivative reflectance spectrum is obtained, tissue oxygen saturation can be reconstructed by various hyperspectral oximetry methods at the selected spectral bands. The frequently used hyperspectral oximetry algorithms include principal component analysis, fuzzy C-means clustering, the Gaussian superposition, multivariate analysis, least-squares regression, and Monte Carlo simulation [9,10,12,15].
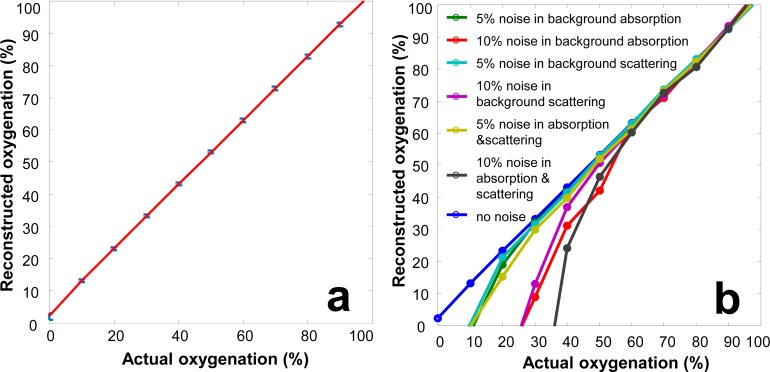
A forward model and an inverse model of the oxygenation algorithm were implemented in MATLAB (MathWorks, Natick, MA). The forward model simulated the diffuse reflectance spectra of a blood phantom by modeling light transport in a semi-infinite turbid media with the following parameters: 1% of intralipid concentration, 5% of whole blood concentration, reduced scattering coefficient of 5.2 cm−1 (measured at 690 nm), and the India ink concentrations simulating the melanin content in white, yellow, and black skins, respectively. As to the inverse algorithm, the 2nd derivative reflectance spectrum with a wavelength gap of 20 nm was obtained from the simulated measurements. A least-squares linear regression method was then used to derive the correlation between the oxygenation levels and the spectral characteristics within the selected wavelength band. In order to test the robustness of the inverse algorithm for real-world applications, the simulated measurements were combined with two types of noises. Type I noise is the white noise associated with material concentration, with the assumption that the chemical composition of the phantom is known but the concentration of each ingredient is inaccurate (with up to ±20% variations in material concentration). Type II noise is the white noise associated with material composition, with the assumption that the chemical composition of the phantom is unknown (with up to 10% variations in background absorption and scattering spectra). Figures 9(a) shows the actual oxygenation levels versus those reconstructed from the simulated measurements with 20% of type I noise in absorption and scattering background. According to Fig. 9(a), the inverse algorithm accurately reconstructs the phantom oxygenation levels, indicating the technical potential for reliable measurement of tissue oxygenation regardless of variations in skin color and adipose tissue content. Figure 9(b) shows the actual oxygenation levels versus those reconstructed from the simulated measurements with up to 10% of type II noise in absorption and scattering background. According to Fig. 9(b), the inverse algorithm is accurate at the oxygenation level above 60%. However, at the oxygenation level lower than 60%, the inverse algorithm tends to underestimate the oxygenation values.
Fig. 9.
(a) Actual oxygenation levels versus oxygenation levels reconstructed from the wide-gap 2nd derivative spectra based on the simulated measurements. 20% of type I noise is introduced into the simulated measurements. (b) Actual versus reconstructed oxygenation levels for the simulated measurements where up to 10% of type II noise is introduced in the absorption and scattering spectra.
7.2. Algorithm validation
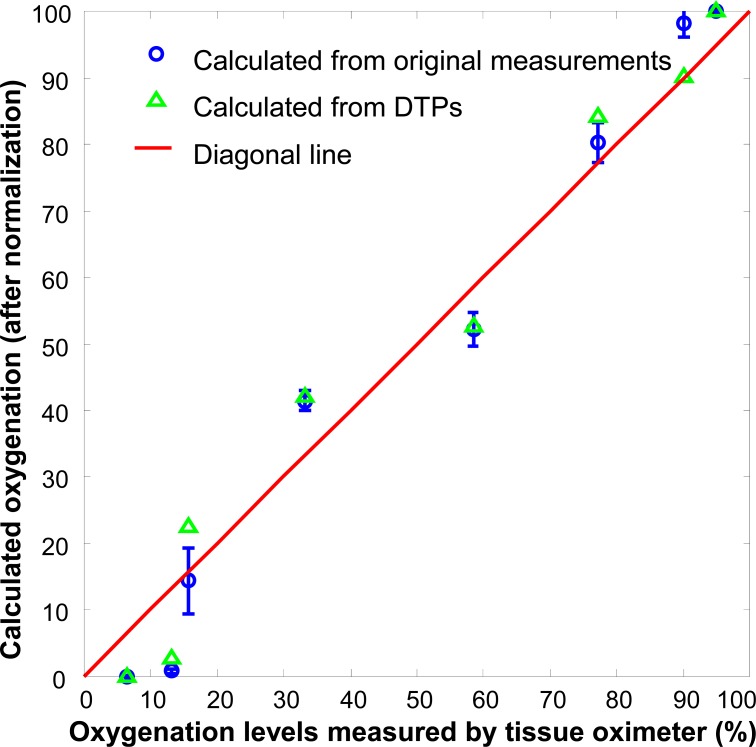
The oxygenation algorithm was validated on the liquid blood phantom as shown in Fig. 3. Hyperspectral images were acquired from both the physical phantom and the corresponding DTPs at different oxygenation levels. The reflectance spectra were obtained by averaging the same ROI in these phantoms. Figure 10 shows the oxygenation levels reconstructed from the original measurements and from the corresponding DTPs. Linear correlation is observed between the calculated oxygenation levels and their actual values, indicating that the inverse algorithm is able to reconstruct tissue oxygenation. Furthermore, the oxygenation levels reconstructed from the DTPs are consistent with those from the original measurements, indicating that the DTPs are able to preserve the functional characteristics of the original phantom. Our next step work is to validate the oxygenation algorithm in the in vivo porcine ischemic skin flap model. Oxygenation levels reconstructed from both the original and the DTP spectra at different locations of the skin flap will be compared side by side with the oxygen tension and perfusion measurements at the same locations to determine the accuracy for oxygenation reconstruction.
Fig. 10.
Actual phantom oxygenation levels measured by a tissue oximeter versus those reconstructed from the original hyperspectral measurements (blue circles) and from the projected DTPs (green triangles). The solid redline is a 1:1 diagonal line. The reconstructed oxygenation values have been normalized to the scale of 0 to 100. Linear correlation is observed between the reconstructed and the actual oxygenation levels. The error bars indicate the oxygen heterogeneity of the tested blood phantom.
8. Discussion and conclusions
We have studied the technical feasibility of using digital tissue phantoms (DTPs) to preserve functional characteristics of in vitro and in vivo biological systems. We have also explored a wide-gap 2nd derivative algorithm to reconstruct tissue oxygenation from the hyperspectral data cubes. In this study, we have demonstrated not only the technical feasibility of using DTPs for quantitative calibration, evaluation, and optimization of spectral imaging devices but also the potential for ischemic wound assessment in clinical practice.
In our current design, a DTP is directly projected to a spectral imaging device by a HIP system with pixel-to-pixel mapping in the whole field of view. This configuration eliminates the imaging artifacts associated with different illumination and detection conditions. Therefore, a DTP is able to reproduce the spectral reflectance of the original biological system with high fidelity. In the meantime, the current DTP design has to overcome several limitations before it can be adopted as a calibration standard for biomedical optical imaging devices. The first limitation is associated with the coupling of the specular reflectance, the diffuse reflectance, and the shadowing effect in a hyperspectral data cube. In order to establish a calibration standard independent of the test condition, it is necessary to eliminate or at least minimize the specular reflectance and the shadowing effect. The other limitation is associated with biological interpretation of hyperspectral measurements. The oxygenation algorithm we are currently implementing is based on spectral analysis without solving the inverse problem of light transport in biological tissue. This approach assumes the negligible multi-scattering effect owing to the limited penetration depth of the visible light. Although spectral analysis has been used by many reflectometry devices [16], it may not provide the required accuracy for biological interpretation of a DTP standard. Numerical tools, such as a multi-layer Monte Carlo modeling [17], may be used to simulate the light transport in a multi-layered DTP. The simulation will help to optimize the wavelength band of DTP for minimal scattering-induced bias. Further advancements in imaging techniques and inverse algorithms are also required for accurate reconstruction of biological parameters from optical measurements.
The DTP can provide medical images with realistic spatial and spectral content that can be used in evaluating optical medical imaging devices. This can greatly reduce the costs associated with running live experiments on volunteers in addition to conveniently providing a consistent scene. It is anticipated that the DTP will be used not only in device development but also as a validation tool at the end of assembly lines and in the clinic. As the HIP technology advances, the DTP can be advanced from a temporally static state to a dynamic projection. The time lapse may be on the order of seconds in order to take into account the pulse from a heartbeat or on the order of days in order to show the progression of the healing of wounds. Overall, the DTP will advance the ability to evaluate the performance of spectral imagers that will be used in future healthcare.
By integrating with microscopy techniques, the 2D projected hyperspectral image from the HIP could be focused onto a microscope sample slide. This opens up a range of possibilities in clinical pathology as well which was not possible with conventional uniform-field microscope illuminators, since now the illuminating spectrum and irradiance level at each region of interest of the specimen can be independently and dynamically controlled in vitro and in vivo. This approach is expected to enhance the dynamic range of the image contrast and to mitigate potential photo-induced damage to live tissues.
Acknowledgments
This project is sponsored by the National Institute of Standards and Technology (60NANB10D184), the U.S. Army Medical Research Acquisition Act (W81XWH-11-2-0142), and the National Institutes of Health (GM077185, GM069589, and CA159077). We thank Drs. Eric Shirley and Kimberly Briggman at NIST for helpful discussions and support. The authors are also grateful for the helpful inputs from Dr. Roy Sashwati at OSU Department of Surgery and the technical assistance from Joseph Agoston and Thoma Shives (OSU Circulation Technology Division), Joseph Ewing (OSU Mechanical Engineering), as well as Jennifer Dickerson, Lori Mattox, and Jeannie Green (OSU ULAR). D. A., M. L., and J. H. were supported by NIST Innovative Measurement Science program on optical medical imaging. References are made to certain commercially available products in this paper to adequately specify the experimental procedures involved. Such identification does not imply recommendation or endorsement by the National Institute of Standards and Technology, nor does it imply that these products are the best for the purpose specified.
References and links
- 1.Sen C. K., Gordillo G. M., Roy S., Kirsner R., Lambert L., Hunt T. K., Gottrup F., Gurtner G. C., Longaker M. T., “Human skin wounds: a major and snowballing threat to public health and the economy,” Wound Repair Regen. 17(6), 763–771 (2009). 10.1111/j.1524-475X.2009.00543.x [DOI] [PMC free article] [PubMed] [Google Scholar]
- 2.Sen C. K., “Wound healing essentials: let there be oxygen,” Wound Repair Regen. 17(1), 1–18 (2009). 10.1111/j.1524-475X.2008.00436.x [DOI] [PMC free article] [PubMed] [Google Scholar]
- 3.Khaodhiar L., Dinh T., Schomacker K. T., Panasyuk S. V., Freeman J. E., Lew R., Vo T., Panasyuk A. A., Lima C., Giurini J. M., Lyons T. E., Veves A., “The use of medical hyperspectral technology to evaluate microcirculatory changes in diabetic foot ulcers and to predict clinical outcomes,” Diabetes Care 30(4), 903–910 (2007). 10.2337/dc06-2209 [DOI] [PubMed] [Google Scholar]
- 4.Shah S. A., Bachrach N., Spear S. J., Letbetter D. S., Stone R. A., Dhir R., Prichard J. W., Brown H. G., LaFramboise W. A., “Cutaneous wound analysis using hyperspectral imaging,” Biotechniques 34(2), 408–413 (2003). [DOI] [PubMed] [Google Scholar]
- 5.Xu R. X., Huang K., Qin R., Huang J., Xu J. S., Ding L., Gnyawali U. S., Gordillo G. M., Gnyawali S. C., Sen C. K., “Dual-mode imaging of cutaneous tissue oxygenation and vascular function,” J. Vis. Exp. (46): (2010), doi:. 10.3791/2095 [DOI] [PMC free article] [PubMed] [Google Scholar]
- 6.Rice J. P., Brown S. W., Allen D. W., Yoon H. W., Litorja M., Hwang J. C., “Hyperspectral image projector applications,” Proc. SPIE 8254, 82540R (2012). 10.1117/12.907898 [DOI] [Google Scholar]
- 7.Allen D. W., Maxwell S., Rice J. P., Chang R., Litorja M., Hwang J., Cadeddu J., Livingston E., Wehner E., Zuzak K. J., “Hyperspectral image projection of a pig kidney for the evaluation of imagers used for oximetry,” Proc. SPIE 7906, 79060V (2011). 10.1117/12.875498 [DOI] [Google Scholar]
- 8.Roy S., Biswas S., Khanna S., Gordillo G., Bergdall V., Green J., Marsh C. B., Gould L. J., Sen C. K., “Characterization of a preclinical model of chronic ischemic wound,” Physiol. Genomics 37(3), 211–224 (2009). 10.1152/physiolgenomics.90362.2008 [DOI] [PMC free article] [PubMed] [Google Scholar]
- 9.Basiri A., Nabili M., Mathews S., Libin A., Groah S., Noordmans H. J., Ramella-Roman J. C., “Use of a multi-spectral camera in the characterization of skin wounds,” Opt. Express 18(4), 3244–3257 (2010). 10.1364/OE.18.003244 [DOI] [PubMed] [Google Scholar]
- 10.Mansfield J. R., Sowa M. G., Payette J. R., Abdulrauf B., Stranc M. F., Mantsch H. H., “Tissue viability by multispectral near infrared imaging: a fuzzy C-means clustering analysis,” IEEE Trans. Med. Imaging 17(6), 1011–1018 (1998). 10.1109/42.746634 [DOI] [PubMed] [Google Scholar]
- 11.Sowa M. G., Leonardi L., Payette J. R., Fish J. S., Mantsch H. H., “Near infrared spectroscopic assessment of hemodynamic changes in the early post-burn period,” Burns 27(3), 241–249 (2001). 10.1016/S0305-4179(00)00111-X [DOI] [PubMed] [Google Scholar]
- 12.Zuzak K. J., Schaeberle M. D., Lewis E. N., Levin I. W., “Visible reflectance hyperspectral imaging: characterization of a noninvasive, in vivo system for determining tissue perfusion,” Anal. Chem. 74(9), 2021–2028 (2002). 10.1021/ac011275f [DOI] [PubMed] [Google Scholar]
- 13.Cooper C. E., Elwell C. E., Meek J. H., Matcher S. J., Wyatt J. S., Cope M., Delpy D. T., “The noninvasive measurement of absolute cerebral deoxyhemoglobin concentration and mean optical path length in the neonatal brain by second derivative near infrared spectroscopy,” Pediatr. Res. 39(1), 32–38 (1996). 10.1203/00006450-199601000-00005 [DOI] [PubMed] [Google Scholar]
- 14.Myers D. E., Anderson L. D., Seifert R. P., Ortner J. P., Cooper C. E., Beilman G. J., Mowlem J. D., “Noninvasive method for measuring local hemoglobin oxygen saturation in tissue using wide gap second derivative near-infrared spectroscopy,” J. Biomed. Opt. 10(3), 034017 (2005). 10.1117/1.1925250 [DOI] [PubMed] [Google Scholar]
- 15.Nishidate I., Tanaka N., Kawase T., Maeda T., Yuasa T., Aizu Y., Yuasa T., Niizeki K., “Noninvasive imaging of human skin hemodynamics using a digital red-green-blue camera,” J. Biomed. Opt. 16(8), 086012 (2011). 10.1117/1.3613929 [DOI] [PubMed] [Google Scholar]
- 16.Berendschot T. T., DeLint P. J., van Norren D., “Fundus reflectance—historical and present ideas,” Prog. Retin. Eye Res. 22(2), 171–200 (2003). 10.1016/S1350-9462(02)00060-5 [DOI] [PubMed] [Google Scholar]
- 17.Wang L., Jacques S. L., Zheng L., “MCML—Monte Carlo modeling of light transport in multi-layered tissues,” Comput. Methods Programs Biomed. 47(2), 131–146 (1995). 10.1016/0169-2607(95)01640-F [DOI] [PubMed] [Google Scholar]


