Abstract
Optical microscopy of blood cells in vivo provides a unique opportunity for clinicians and researchers to visualize the morphology and dynamics of circulating cells, but is usually limited by the imaging speed and by the need for exogenous labeling of the cells. Here we present a label-free approach for in vivo flow cytometry of blood using a compact imaging probe that could be adapted for bedside real-time imaging of patients in clinical settings, and demonstrate subcellular resolution imaging of red and white blood cells flowing in the oral mucosa of a human volunteer. By analyzing the large data sets obtained by the system, valuable blood parameters could be extracted and used for direct, reliable assessment of patient physiology.
OCIS codes: (170.1790) Confocal microscopy, (170.1470) Blood or tissue constituent monitoring, (170.1610) Clinical applications
1. Introduction
Measuring the composition of a patient's blood is often the first step in clinical diagnosis [1], and is most commonly performed by extracting a blood sample for ex vivo analysis using optical flow cytometry and other biochemical assays, providing invaluable quantitative information on cell concentration and morphology. While for most cases this approach provides data which correlates well with actual blood parameters, it lacks the ability to provide real-time monitoring of patients in critical conditions, requires invasive procedures for blood extraction, and often involves a certain bias of some parameters owing to the inherent differences between ex vivo measurements and the true physiological properties. Several approaches for noninvasive monitoring of various blood parameters have been proposed using electric [2] and ultrasound [3] waves; however, these techniques often provide indirect measurements and are characterized by relatively low spatial resolution. Optical techniques have been well known for resolving subcellular structures in a wide range of applications; unfortunately, the scattering of visible light by the tissue surrounding the blood vessels prevents current optical flow cytometry techniques from being applied in situ and noninvasively. Alternative optical methods for this task have been demonstrated promising by utilizing fluorescent labeling of cells flowing in the blood stream using a non-imaging modality [4] and at cellular resolution [5]. For extensive clinical use, however, the high toxicity and short lifetime of most fluorescent dyes limit their use mainly to research [6,7] and specific clinical [8,9] applications. Label-free optical imaging of blood flow has been demonstrated based on its unique absorption and scattering properties, using orthogonal polarization spectral imaging [10] and sidestream dark field imaging [11]. Photothermal and photoacoustic flow cytometry [12,13] have been shown useful for characterizing blood cells [14,15] and estimating some of their physical properties [16].
Most commonly, label-free high resolution imaging through thick tissue is accomplished using reflectance confocal microscopy (RCM) which relies on the endogenous contrast provided by the different scattering coefficients of cellular and subcellular structures. High resolution RCM of the skin [17], retina [18], mucosa [19] and blood [20] has been demonstrated, and commercial instruments for RCM are currently available mainly for dermatologic and ophthalmologic imaging. For most applications, however, conventional RCM systems require bulky dual-axis scanning mechanisms that increase system size and complexity, and strictly limit imaging speed. Recently, our group has demonstrated a technique for label-free, high resolution spectrally encoded imaging of flowing blood cells [21]. By taking advantage of the unidirectional movement of cells flowing through a vessel, we have accomplished high speed imaging of rapid parallel flow of red blood cells (RBCs) using a compact probe which does not require mechanical scanning.
In this paper, we demonstrate the feasibility of this approach, termed spectrally encoded flow cytometry (SEFC), for high resolution imaging of flowing red and white blood cells (WBCs) in human patients. We find that different types of leukocytes could be clearly identified and classified, and observe cellular flow dynamics with submicron resolution. SEFC images of flowing cells in a patient are compared to in vitro images and to fluorescence images of sorted blood cells for assisting in vivo data interpretation and establishing the clinical diagnostic value of the technique.
2. Methods
2.1. Imaging system
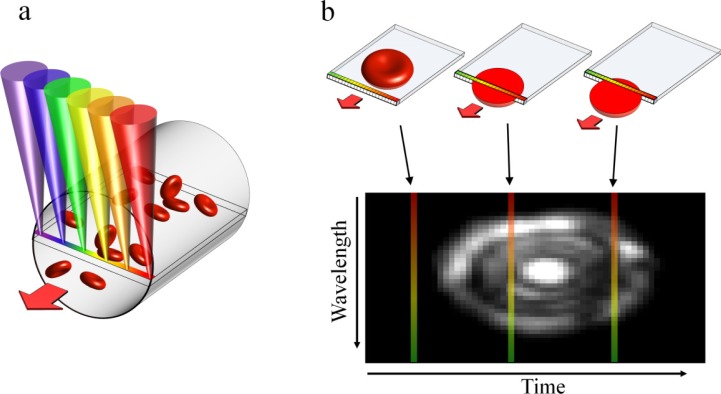
The SEFC system used in this study is a form of spectrally encoded confocal microscopy (SECM) [22] which has been shown promising for minimally invasive imaging and for imaging large areas with submicron resolution [23,24]. In SEFC, a transverse spectrally encoded line is imaged within a vessel, recording a reflectance image of the cells flowing across it (Fig. 1(a) ). The resulting data sets form an effective two-dimensional image of the cells in which one axis is encoded by wavelength and the other (the direction of flow) is encoded by time (Fig. 1(b)) [21].
Fig. 1.
Image acquisition in SEFC. (a) A single line within a blood vessel is imaged with multiple colors of light that encode lateral positions. (b) A single cell crossing the spectral line produces a two-dimensional image with one axis encoded by wavelength and the other by time.
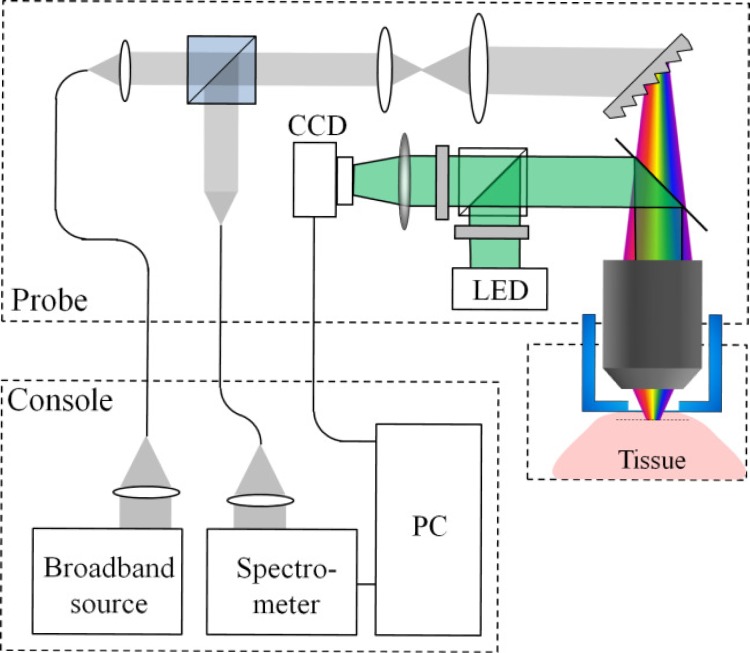
The optical setup of the SEFC system for in vivo imaging is shown in Fig. 2 . Broadband light from a fiber-coupled superluminescent diode array (Superlum S840-B-I-20, 840 nm central wavelength, 50 nm bandwidth) was collimated into a 2.5 mm diameter beam using an aspheric lens (11 mm focal length), expanded using a 3.75× beam expander, and focused onto a transverse spectral line using a transmission diffraction grating (1200 l/mm, Wasatch photonics) and a water immersion objective lens (60× , NA = 1.2, Olympus). Imaging depth inside the tissue was adjusted by manually threading a protective aluminum cap with an attached 0.17 mm thick cover glass which was in contact with the tissue. The gap between the objective’s front element and the cover glass was filled with water. Backscattered light from the tissue was collected and collimated by the illumination optics in a confocal geometry, split by a 50:50 cubic beam splitter, coupled to a single-mode collection fiber and directed to a home-built spectrometer with a high-sensitivity electron-multiplying CCD camera (DU970N, Andor, 1300 lines/s). For high acquisition rates which were required for imaging rapid cell flow, a faster CCD camera (Aviiva EM4, e2v) was used, allowing acquisition rates up to 71,000 lines/s. The lateral resolution of the imaging probe was 0.7 μm (edge response, FWHM), the axial resolution was 1.5 μm (FWHM, measured by axially scanning a reflective surface across the focal volume), and the lateral field of view in the wavelength axis was 110 μm. The total power incident on the sample was approximately 7 mW.
Fig. 2.
Schematic illustration of the SEFC system.
The relatively small field of view of the confocal spectrally encoded line imposed a difficulty in identifying the capillary vessels deep below the tissue surface. In order to assist the detection of blood vessels, an additional widefield green imaging channel was added to the probe through the same objective lens. A beam from a light-emitting diode (M530L2, Thorlabs, 530 nm central wavelength) was collimated and coupled to the imaging channel using a dichroic mirror. The light backscattered from the tissue was imaged using a two-dimensional CCD camera (UI-2220, IDS) at 20 frames/s. In this method, blood vessels were observed at high contrast within a field of view of 400 × 300 μm2 as dark regions on a bright background [10] due to the relatively high absorption of green light by hemoglobin. A pair of crossed polarizers was used to reject surface reflections to further enhance image contrast. Data from both the SEFC and green channels was simultaneously sampled and displayed by a personal computer in real-time, using a custom built software (Labview, National Instruments).
2.2. In vivo imaging
The experimental procedure for in vivo imaging was approved by our institutional review board. A healthy volunteer (healthy male, age 32) was seated in a high chair with a padded chin rest and placed his lower lip against the imaging probe. Blood vessels at depths ranging from 70 μm to 200 μm under the tissue surface were detected using the live view from the green imaging channel. Each continuous imaging session was limited to less than 30 s, primarily due to subject motion.
2.3. In vitro imaging
Blood for in vitro imaging was extracted from healthy donors by venipuncture. 5000 units/ml Heparin (Fresenius) were added to prevent coagulation. Diluted whole blood (1:5) was prepared by adding phosphate buffered saline with 2% bovine serum albumin. Blood components were separated by density gradient centrifugation. The mononuclear cell fraction was incubated for 1 hr at 37°C humidified incubator followed by collection of the non-adherent lymphocytes. Polymorphonuclear cells were purified by using an RBC lysis solution (Miltenyi Biotec). All WBCs were resuspended in autologous plasma which was diluted (1:1) with phosphate buffered saline. In vitro SEFC imaging of the different cell samples was performed at average flowing speed of 0.4 mm/s (Syringe pump 11 Elite, Harvard Apparatus) through a 5 mm × 0.8 mm rectangular plastic flow chamber. For standard fluorescence images, cell nuclei were stained with 1 mg/ml Hoechst 33342 (Sigma Aldrich) and imaged using a 0.45 NA objective lens.
2.4. Image and data analysis
The average flow velocity vav was calculated according to
| (1) |
where dav denotes the average lateral size of the RBCs and tav denotes their average passage time across the spectrally encoded line. Both dav and tav were calculated following manual segmentation of the cells in the raw image with a custom software (Matlab, Mathworks). The concentration of WBCs in a vessel was calculated according to
| (2) |
where N denotes the total number of observed cells during a total imaging time T, and R denotes the estimated radius of the vessel. Assuming that cell detection follows Poisson statistics, the estimated error σWBC in determining the concentration is given by .
The fractional volume occupied by RBCs in a single image was estimated by calculating the 3/2 power of the ratio between the total apparent (manually segmented) cells area and the total vessel area in the two-dimensional image (Photoshop CS3, Adobe).
3. Results
3.1. In vitro imaging
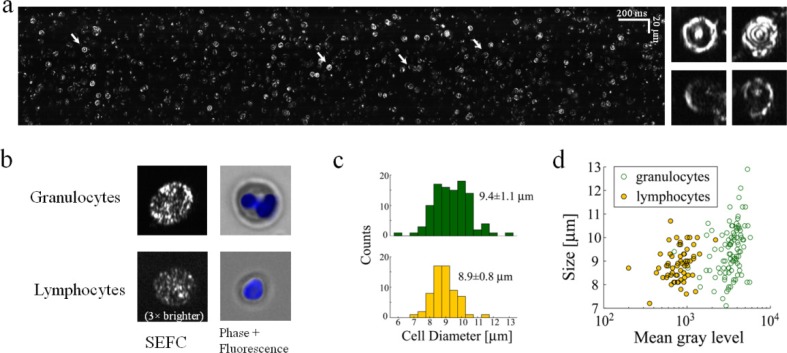
Clear images of flowing RBCs without interfering reflections from the chamber wall were obtained after blood dilution (1:5) which allowed high image quality (Fig. 3(a) ). The nearly random orientation of RBCs in the diluted blood flow resulted in a wide diversity of cell shapes and brightness levels in the SEFC images. RBCs which were oriented with their symmetry axis pointing toward the objective lens showed a few bright concentric rings, caused by interference of light reflections from the front and back plasma membranes (Fig. 3(a), insets). Slanted and/or deformed RBCs appeared smaller and somewhat dimmer with various shapes including half circles, ellipses, and sharp curves.
Fig. 3.
In vitro imaging of flowing blood cells. (a) SEFC raw image of diluted whole blood. Right insets, four individual RBCs of different orientations in space whose location in the raw image is marked by arrows. (b) Typical SEFC images of live granulocytes and lymphocytes separated from whole blood compared to standard fluorescence microscopy. Cells' nuclei were stained blue (Hoechst). The lymphocyte SEFC image was brightened (3×) to allow visual comparison. (c) Diameter histograms of granulocytes and lymphocytes, with corresponding mean ± S.D values. (d) Scatter plot of WBC as function of size and integrated brightness allows good statistical separation of lymphocytes from granulocytes.
WBCs appeared distinctively different from RBCs, with a larger size and a bright, speckled appearance. In order to better discriminate between different WBC subtypes in the SEFC image, granulocytes and lymphocytes were isolated from a whole blood sample, imaged within a flow chamber (Fig. 3(b)) and compared to fluorescently labeled widefield images of cells from the same group. Granulocytes were characterized by high brightness, pronounced speckled appearance and multi-lobed nuclei visible as darker regions within the cells, while lymphocytes were much fainter in comparison, with a more uniform (although still speckled) appearance. Granulocytes were also slightly larger on average (Fig. 3(c)) in accordance with previously reported results [1]. A two dimensional scatter plot of the cells’ size and brightness shows clear separation between the two groups, where the brightness difference is much more distinctive than cell size (Fig. 3(d)).
3.2. In vivo imaging
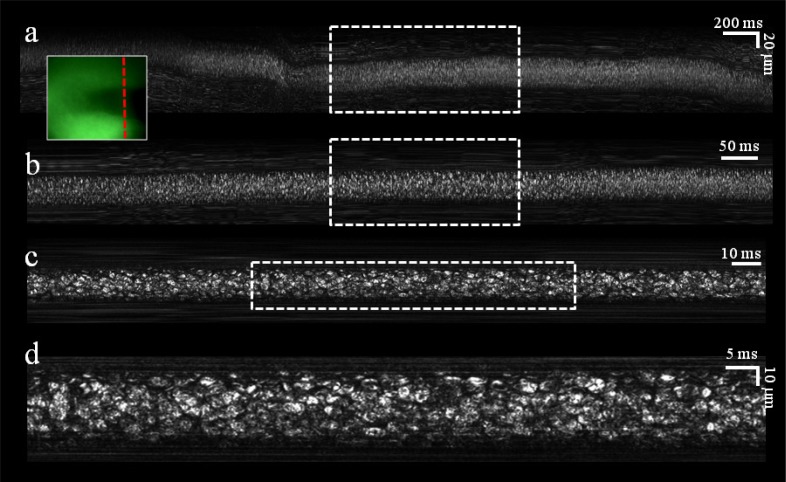
Microvessels approximately 70 μm below the surface of the lower lip of a human volunteer were first located using the real-time green channel imager (Fig. 4 , inset), albeit at low resolution which could not resolve single cells. An SEFC image which was co-registered with the green image and captured from the location marked by a dashed red line in the inset, revealed a bright, dense population of blood cells as they crossed the spectral line. Three digital magnification steps of the raw image (Fig. 4, top-to-bottom panels) reveal the shapes and geometries of individual flowing cells. Light scattered from the vessel walls and from the surrounding tissue formed constant horizontal streaks, indicative of the relatively fixed orientation of the probe with respect to the tissue during imaging. As penetration depth into the blood vessel was increased, contrast and resolution were quickly deteriorating; in most cases, best balance between image quality and number of visible cells was obtained 2-4 μm below the front vessel wall.
Fig. 4.
In vivo noninvasive imaging of blood flow in a single vessel. (a) Raw image acquired during 4 seconds of flow. (b) Crop of the raw data acquired during the period marked by the dashed rectangle in a. (c) Crop of the raw data acquired during the period marked by the dashed rectangle in b. (d) Crop of the raw data marked by the dashed rectangle in c. Inset, an image of the blood vessel as seen through the auxiliary green channel. Dashed red line indicates the transverse location of the spectrally encoded line.
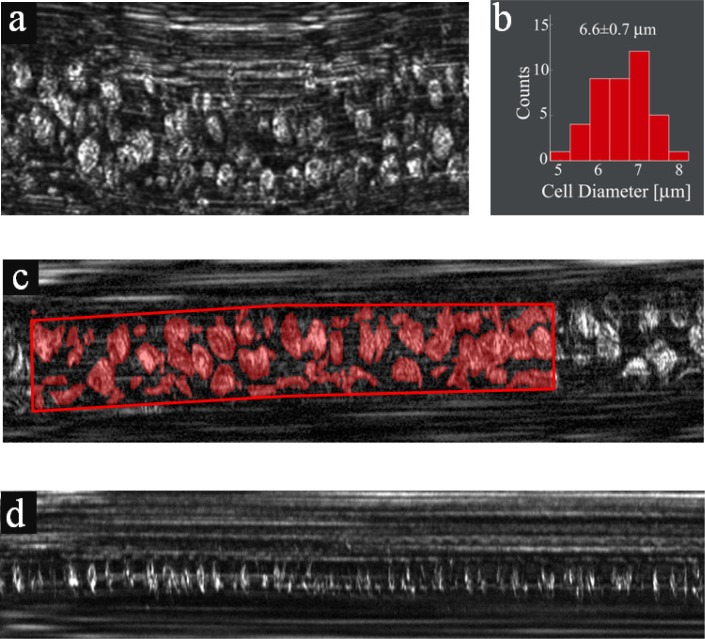
On several occasions, a better view of the cells could be gained by applying a slight pressure with the probe on the tissue, deforming the blood vessel into a flat oval shape and forcing the cells to align with their narrow dimension parallel to the direction of flow (Fig. 5(a) ). Using this technique, the average diameter of the RBCs was measured to be 6.6 ± 0.7 μm (Fig. 5(b)), in agreement with ex vivo cell size measurements [1].
Fig. 5.
In vivo imaging in microvessels. (a) RBC flow in a vessel which was slightly deformed by applying external pressure. (b) A histogram showing distribution of RBC diameters. (c) Extracting the fractional area occupied by RBCs in a vessel using manual segmentation for assessing hematocrit levels. Red regions correspond to areas occupied by RBCs. (d) Individual RBCs flowing in a small-diameter capillary.
In vivo SEFC images (Figs. 4 and 5(a)) could provide direct means for estimating the hematocrit level of a patient. This essential parameter could be derived by measuring the fractional area occupied by RBCs in the raw image; within six different vessels (see Fig. 5(c) for a typical vessel) with diameters ranging from 7 μm to 20 μm, the RBC fractional area was estimated as 0.47 ± 0.05, resulting in a calculated hematocrit of 32%, somewhat smaller when compared with expected values for an adult male (40%-52%). Additional factors which may affect the accuracy of such measurement include underestimation of the cells' area due to speckle noise, variation of cell density across the vessel and physiological factors accounting for the size and location of the imaged vessel. These factors would need to be determined in a future study with a larger number of subjects. Individual RBCs could also be visualized in smaller capillaries (~5-8 μm diameter), in which single-file flow enabled the identification and counting of practically all cells flowing through the vessel (Fig. 5(d)).
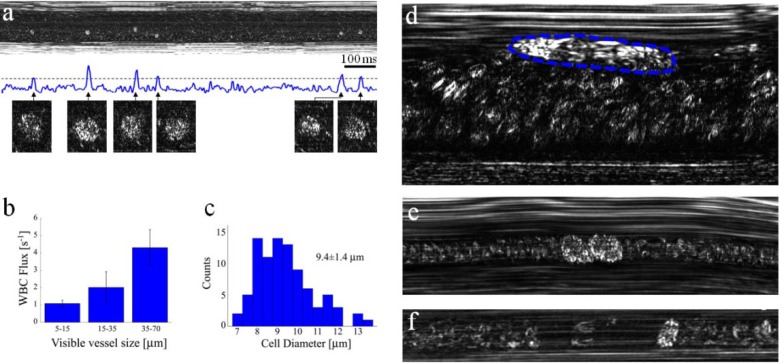
Identification of WBCs in vivo would be valuable for many clinical applications, yet their low concentration in healthy subjects requires a more sophisticated means for imaging, as well as longer imaging periods for gaining sufficient data. For efficient detection of WBCs, the depth of focus of our imaging probe was positioned only a few microns below the front wall of post-capillary venules, where marginated WBCs are abundant [25] and RBCs are rarely seen. At this location, WBCs (most likely granulocytes due to their high brightness) could be detected and automatically registered by plotting the total scattered power as a function of time (Fig. 6(a) ). While some variations in WBC brightness were observed, it was still difficult to determine their exact types; further experiments would be required for a more accurate classification of these cells in vivo. The measurable WBC flux increases with vessel diameter, as shown by measuring the flux in ten different vessels (Fig. 6(b)). An average WBC diameter of 9.4 ± 1.4 μm was measured (Fig. 6(c)), in agreement with our in vitro granulocyte measurements. WBCs rolling on the endothelial vessel wall (Fig. 6(d)) and small aggregates of WBCs (Fig. 6(e)) were also observed on numerous occasions.
Fig. 6.
In vivo imaging of WBCs. (a) Imaging close to the wall of a post capillary venule allows forming a plot of the total intensity across the image as a function of time. Good correlation between the appearances of WBCs (magnified cell images below the plot) and intensity peaks was obtained. (b) Averaged flux of WBCs for different vessel diameters. (c) Diameter histogram of the imaged WBCs. (d) A single rolling WBC (outlined by a dashed blue line) near a vessel wall, characterized by an elongated shape which indicates its low relative velocity (approximately 0.18 mm/s) in contrast to the nearby fast RBC flow (approximately 1.1 mm/s). (e) Two attached WBCs flowing in a capillary. (f) A single WBC flowing in a small capillary with a downstream plasma gap (RBC depleted region).
In small capillaries whose diameter is roughly that of a WBC, all passing WBCs could be easily viewed and counted. Most WBCs were viewed with a characteristic downstream RBC depleted region and an upstream accumulation of RBCs [25] (Fig. 6(f)). A continuous 9.2 s long measurement across a 10 μm diameter capillary revealed a total of 12 cells, which correspond to a rough estimate of 8800 ± 2500 WBCs/μL - within the normal range for healthy adults [1]. Longer measurement periods would significantly increase the accuracy of this estimate, and may allow continuous tracking of WBC count in critical care patients which are sensitive to sudden inflammation.
4. Discussion
The ability of SEFC to directly and continuously visualize blood cells flowing inside human patients' vessels has the potential of providing noninvasive measurement of important blood parameters such as hematocrit, mean corpuscular volume (MCV) and WBC count, as well as for establishing new clinical indices derived from the cells' morphology and dynamics within their natural physiological environment. Continuous tracking of hematocrit levels could be useful for intra- and post-surgical monitoring of patients for detecting sudden changes in the circulation caused by internal bleeding, for example, and online monitoring of WBC concentration could be highly useful in critical care to detect a rapidly developing inflammatory process. Other phenomena which could potentially be visualized by SEFC, including cellular deformation, aggregation, margination and adhesion, were previously studied mainly in animals using intravital microscopy [25,26] and have shown correlation to various pathological conditions. For example, SEFC could provide a unique opportunity to assess patients with hemoglobinopathies such as sickle cell anemia and beta thalassemia, providing information on the percentage of sickled and thalassemic cells, respectively. Aggregation of WBCs has been shown to be correlated with the level of neutrohpil-platelet interactions [27] involved in several thrombotic and inflammatory disorders.
Further basic and clinical studies are required in order to uncover and demonstrate the true potential of in vivo SEFC. System improvements are still needed for increasing imaging depth, for effective imaging at more accessible parts of the body, and for minimizing tissue motion to allow longer imaging periods, for example by using medical adhesives [28] or low pressure suction [29]. Further miniaturization of the imaging probe would be possible using custom optics and smaller, battery-powered and wireless auxiliary green channel [30]. Such hand-held SEFC probes would be compact, free of moving parts, and connected to the main system console only by a pair of optical fibers. Additional miniaturization of the probe's optics [24,31] would allow the application of SEFC for minimally invasive applications either as a standalone device or through the instrument channel of an endoscope.
Practical implementation of SEFC would also need to address the vast amount of captured and recorded data: several thousands of RBCs and a few dozens of WBCs were imaged in this work during only 10 s through vessels of up to 50 μm in diameter and 5 mm/s flow velocities, and saved in a few hundred megabytes files. Larger data sets would be needed in practice either for collecting sufficient data for accurate diagnosis or to continuously monitor blood flows. Future clinically feasible SEFC systems would require fast and parallel data storage, effective real-time display, and automated image analysis.
Future research will study the feasibility of SEFC for the diagnosis of various RBC disorders such as sickle cell anemia and beta thalassemia, which are manifested by unique cell morphologies. Other possible fields include end organ effects of diabetes and atherosclerosis, which are characterized by abnormal blood cell dynamics. Finally, screening for hematological disorders (e.g., hemoglobinopathies, anemia, and leukocytosis) could be performed in developing countries at the point of care, without the overhead cost of blood sampling and laboratory procedures.
In summary, an optical system that allows noninvasive imaging of blood cells in vivo has been demonstrated. With no fluorescence labeling, we have shown high resolution imaging of red and white blood cells, derived important parameters which are useful for clinical diagnosis, and observed unique dynamics of cellular flow. By providing direct information on cells’ morphology and flow, SEFC offers a new set of tools which could be utilized for a wide range of screening and diagnostics applications, and would open new possibilities in the clinical research and practice.
References and Links
- 1.V. Hoffbrand, P. Moss, and J. Pettit, Essential Hematology, 5th ed. (Blackwell, Malden, Mass., 2006), pp. 320–365. [Google Scholar]
- 2.Yamakoshi K., Tanaka S., Shimazu H., “Electrical admittance cuff for noninvasive and simultaneous measurement of haematocrit, arterial pressure and elasticity using volume-oscillometric method,” Med. Biol. Eng. Comput. 32(S1Suppl), S99–S107 (1994). 10.1007/BF02523335 [DOI] [PubMed] [Google Scholar]
- 3.Secomski W., Nowicki A., Guidi F., Tortoli P., Lewin P. A., “Noninvasive in vivo measurements of hematocrit,” J. Ultrasound Med. 22(4), 375–384 (2003). [DOI] [PubMed] [Google Scholar]
- 4.Novak J., Georgakoudi I., Wei X., Prossin A., Lin C. P., “In vivo flow cytometer for real-time detection and quantification of circulating cells,” Opt. Lett. 29(1), 77–79 (2004). 10.1364/OL.29.000077 [DOI] [PMC free article] [PubMed] [Google Scholar]
- 5.Sarelius I. H., Duling B. R., “Direct measurement of microvessel hematocrit, red cell flux, velocity, and transit time,” Am. J. Physiol. 243(6), H1018–H1026 (1982). [DOI] [PubMed] [Google Scholar]
- 6.Georgakoudi I., Solban N., Novak J., Rice W. L., Wei X., Hasan T., Lin C. P., “In vivo flow cytometry: a new method for enumerating circulating cancer cells,” Cancer Res. 64(15), 5044–5047 (2004). 10.1158/0008-5472.CAN-04-1058 [DOI] [PubMed] [Google Scholar]
- 7.Sipkins D. A., Wei X., Wu J. W., Runnels J. M., Côté D., Means T. K., Luster A. D., Scadden D. T., Lin C. P., “In vivo imaging of specialized bone marrow endothelial microdomains for tumour engraftment,” Nature 435(7044), 969–973 (2005). 10.1038/nature03703 [DOI] [PMC free article] [PubMed] [Google Scholar]
- 8.Hsiung P.-L., Hardy J., Friedland S., Soetikno R., Du C. B., Wu A. P., Sahbaie P., Crawford J. M., Lowe A. W., Contag C. H., Wang T. D., “Detection of colonic dysplasia in vivo using a targeted heptapeptide and confocal microendoscopy,” Nat. Med. 14(4), 454–458 (2008). 10.1038/nm1692 [DOI] [PMC free article] [PubMed] [Google Scholar]
- 9.Kiesslich R., Burg J., Vieth M., Gnaendiger J., Enders M., Delaney P., Polglase A., McLaren W., Janell D., Thomas S., Nafe B., Galle P. R., Neurath M. F., “Confocal laser endoscopy for diagnosing intraepithelial neoplasias and colorectal cancer in vivo,” Gastroenterology 127(3), 706–713 (2004). 10.1053/j.gastro.2004.06.050 [DOI] [PubMed] [Google Scholar]
- 10.Groner W., Winkelman J. W., Harris A. G., Ince C., Bouma G. J., Messmer K., Nadeau R. G., “Orthogonal polarization spectral imaging: a new method for study of the microcirculation,” Nat. Med. 5(10), 1209–1212 (1999). 10.1038/13529 [DOI] [PubMed] [Google Scholar]
- 11.Ince C., “Sidestream dark field imaging: an improved technique to observe sublingual microcirculation,” Crit. Care 9(Suppl 1), P72 (2005). 10.1186/cc3135 [DOI] [Google Scholar]
- 12.Zharov V. P., Galanzha E. I., Tuchin V. V., “Photothermal image flow cytometry in vivo,” Opt. Lett. 30(6), 628–630 (2005). 10.1364/OL.30.000628 [DOI] [PubMed] [Google Scholar]
- 13.Tuchin V. V., Tárnok A., Zharov V. P., “In vivo flow cytometry: a horizon of opportunities,” Cytometry A 79A(10), 737–745 (2011). 10.1002/cyto.a.21143 [DOI] [PMC free article] [PubMed] [Google Scholar]
- 14.Petrova I. Y., Esenaliev R. O., Petrov Y. Y., Brecht H.-P. F., Svensen C. H., Olsson J., Deyo D. J., Prough D. S., “Optoacoustic monitoring of blood hemoglobin concentration: a pilot clinical study,” Opt. Lett. 30(13), 1677–1679 (2005). 10.1364/OL.30.001677 [DOI] [PubMed] [Google Scholar]
- 15.Zharov V. P., Galanzha E. I., Menyaev Y., Tuchin V. V., “In vivo high-speed imaging of individual cells in fast blood flow,” J. Biomed. Opt. 11(5), 054034 (2006). 10.1117/1.2355666 [DOI] [PubMed] [Google Scholar]
- 16.Galanzha E. I., Zharov V. P., “In vivo photoacoustic and photothermal cytometry for monitoring multiple blood rheology parameters,” Cytometry A 79A(10), 746–757 (2011). 10.1002/cyto.a.21133 [DOI] [PMC free article] [PubMed] [Google Scholar]
- 17.Rajadhyaksha M., Grossman M., Esterowitz D., Webb R. H., Anderson R. R., “In vivo confocal scanning laser microscopy of human skin: melanin provides strong contrast,” J. Invest. Dermatol. 104(6), 946–952 (1995). 10.1111/1523-1747.ep12606215 [DOI] [PubMed] [Google Scholar]
- 18.Webb R. H., Hughes G. W., Delori F. C., “Confocal scanning laser ophthalmoscope,” Appl. Opt. 26(8), 1492–1499 (1987). 10.1364/AO.26.001492 [DOI] [PubMed] [Google Scholar]
- 19.White W. M., Rajadhyaksha M., González S., Fabian R. L., Anderson R. R., “Noninvasive imaging of human oral mucosa in vivo by confocal reflectance microscopy,” Laryngoscope 109(10), 1709–1717 (1999). 10.1097/00005537-199910000-00029 [DOI] [PubMed] [Google Scholar]
- 20.González S., Sackstein R., Anderson R. R., Rajadhyaksha M., “Real-time evidence of in vivo leukocyte trafficking in human skin by reflectance confocal microscopy,” J. Invest. Dermatol. 117(2), 384–386 (2001). 10.1046/j.0022-202x.2001.01420.x [DOI] [PubMed] [Google Scholar]
- 21.Golan L., Yelin D., “Flow cytometry using spectrally encoded confocal microscopy,” Opt. Lett. 35(13), 2218–2220 (2010). 10.1364/OL.35.002218 [DOI] [PubMed] [Google Scholar]
- 22.Tearney G. J., Webb R. H., Bouma B. E., “Spectrally encoded confocal microscopy,” Opt. Lett. 23(15), 1152–1154 (1998). 10.1364/OL.23.001152 [DOI] [PubMed] [Google Scholar]
- 23.Yelin D., Boudoux C., Bouma B. E., Tearney G. J., “Large area confocal microscopy,” Opt. Lett. 32(9), 1102–1104 (2007). 10.1364/OL.32.001102 [DOI] [PubMed] [Google Scholar]
- 24.Kang D., Suter M. J., Boudoux C., Yoo H., Yachimski P. S., Puricelli W. P., Nishioka N. S., Mino-Kenudson M., Lauwers G. Y., Bouma B. E., Tearney G. J., “Comprehensive imaging of gastroesophageal biopsy samples by spectrally encoded confocal microscopy,” Gastrointest. Endosc. 71(1), 35–43 (2010). 10.1016/j.gie.2009.08.026 [DOI] [PMC free article] [PubMed] [Google Scholar]
- 25.Schmid-Schönbein G. W., Usami S., Skalak R., Chien S., “The interaction of leukocytes and erythrocytes in capillary and postcapillary vessels,” Microvasc. Res. 19(1), 45–70 (1980). 10.1016/0026-2862(80)90083-7 [DOI] [PubMed] [Google Scholar]
- 26.Bishop J. J., Nance P. R., Popel A. S., Intaglietta M., Johnson P. C., “Effect of erythrocyte aggregation on velocity profiles in venules,” Am. J. Physiol. Heart Circ. Physiol. 280(1), H222–H236 (2001). [DOI] [PubMed] [Google Scholar]
- 27.Konstantopoulos K., Neelamegham S., Burns A. R., Hentzen E., Kansas G. S., Snapp K. R., Berg E. L., Hellums J. D., Smith C. W., McIntire L. V., Simon S. I., “Venous levels of shear support neutrophil-platelet adhesion and neutrophil aggregation in blood via P-selectin and beta2-integrin,” Circulation 98(9), 873–882 (1998). [DOI] [PubMed] [Google Scholar]
- 28.Rajadhyaksha M., Anderson R. R., Webb R. H., “Video-rate confocal scanning laser microscope for imaging human tissues in vivo,” Appl. Opt. 38(10), 2105–2115 (1999). 10.1364/AO.38.002105 [DOI] [PubMed] [Google Scholar]
- 29.Lindert J., Werner J., Redlin M., Kuppe H., Habazettl H., Pries A. R., “OPS imaging of human microcirculation: a short technical report,” J. Vasc. Res. 39(4), 368–372 (2002). 10.1159/000065549 [DOI] [PubMed] [Google Scholar]
- 30.Iddan G., Meron G., Glukhovsky A., Swain P., “Wireless capsule endoscopy,” Nature 405(6785), 417 (2000). 10.1038/35013140 [DOI] [PubMed] [Google Scholar]
- 31.Liang C., Sung K.-B., Richards-Kortum R. R., Descour M. R., “Design of a high-numerical-aperture miniature microscope objective for an endoscopic fiber confocal reflectance microscope,” Appl. Opt. 41(22), 4603–4610 (2002). 10.1364/AO.41.004603 [DOI] [PubMed] [Google Scholar]


