Abstract
Embryonic stem (ES) cells are capable of proliferating and differentiating to form cells of the three embryonic germ layers, namely, endoderm, mesoderm, and ectoderm. The utilization of human ES cell derivatives requires the ability to direct differentiation to specific lineages in defined, efficient, and scalable systems. Better markers are needed to identify early differentiation. Lectins have been reported as an attractive alternative to the common stem cell markers. They have been used to identify, characterize, and isolate various cell subpopulations on the basis of the presentation of specific carbohydrate groups on the cell surface. This article demonstrates how simple adhesion assays in lectin-coated microfluidic channels can provide key information on the interaction of lectins with ES and definitive endoderm cells and thereby track early differentiation. The microfluidic approach incorporates both binding strength and cell surface receptor density, whereas traditional flow cytometry only incorporates the latter. Both approaches are examined and shown to be complementary with the microfluidic approach providing more biologically relevant information.
INTRODUCTION
Embryonic stem cells (ESCs) have obtained broad recognition for their pluripotency and potential in therapeutic applications.1, 2 Originating in the inner cell mass of the blastocyst of the embryo, they have the ability to differentiate into cells of all three germ layers.3, 4 Surface markers such as alkaline phosphatase, the glycolipids stage specific embryonic antigens 3 and 4 (SSEA 3 and 4, respectively) and TRA1-60/80 are commonly used to characterize and identify human embryonic stem cells.5 These markers are, however, not successful at tracking early differentiation, i.e., their expression continues beyond the time at which ESCs become irreversibly committed to differentiation.6 Marker transcripts such as Rex1, Gbx2, and c-myc conversely have been successful at analyzing pluripotent state and early differentiation.7, 8, 9 However, these transcripts are intracellular markers and cannot be utilized for the recovery of functional cells due to the need for cell lysis before analysis.6
Lectins have been reported as an alternative to conventional stem cell differentiation markers.10 They are a group of proteins that bind specifically and reversibly to mono- and oligosaccharide carbohydrate structures.11, 12 The carbohydrate expression pattern on the surfaces of cells differs for each mammalian cell type, and consequently lectins have been successful at indicating early differentiation.13 For example, the lectin Dolichos biflorus agglutinin (DBA) can be employed to identify initial mouse embryonic stem cell (mESC) differentiation6 by distinguishing between mESC and primitive ectoderm cells using immunofluorescent staining and flow cytometry. Flow cytometry has been the method of choice for identifying stem cell differentiation markers14 but this technique cannot assess binding strength, a parameter that is of considerable importance not only from a biological standpoint but also from the standpoint of cell isolation and enrichment.
This article describes how cell-adhesion within microfluidic channels can be utilized to characterize the interactions of lectins with definitive endoderm (DE) and human embryonic stem (ES) cells and compares the microfluidic characterization with traditional flow cytometry analysis. Disagreements between the microfluidic assay and flow cytometry are explored and are putatively related to cell-ligand binding strength. Due to the bond that occurs between the cell and ligand, binding strength information can be obtained using a simple microfluidic assay. The significance of this approach is the ability to extract such information without pre-processing labeling or tagging of cells.
MATERIALS AND METHODS
Ethanol (200 proof), cover slips (35 × 60 mm, no. 1), microcentrifuge tubes, cell culture flasks, and bovine serum albumin (BSA) were purchased from Fisher (Waltham MA). 3-mercaptopropyl trimethoxysilane was obtained from Gelest, Inc. (Morrisville, PA) and the coupling agent GMBS (N-y-maleimidobutyryloxy succinimide ester) was obtained from Pierce Biotechnology (Rockford, IL). SU-8-50 photoresist and developer were obtained from MicroChem (Newton, MA); silicone elastomer and curing agent were obtained from Dow Corning (Midland, MI). Phosphate buffered saline (1X PBS) was purchased from Mediatech (Herndon, VA). The lectins Ulex europaeus agglutinin I (UEA I), DBA, and peanut agglutinin (PNA) were all acquired from Vector Laboratories (Covington, LA) (as listed in Table TABLE I.). Antibodies against SSEA3, SSEA4, and CXCR4 were obtained from Ebioscience (San Diego, CA).
TABLE I.
Acronyms used with their respective definitions.
| Acronym | Definition |
|---|---|
| SSEA4 | Surface specific antigen 4 |
| SSEA3 | Surface specific antigen 3 |
| CXCR4 | Chemokine receptor 4 |
| PNA | Peanut agglutinin |
| DBA | Dolichos biflorus agglutinin |
| UEA I | Ulex europaeus agglutinin I |
| DE | Definitive endodermal cells |
| ES | Embryonic stem cells |
| DE-DBA | DE cells bound to immobilized DBA |
| DE-SSEA3 | DE cells bound to immobilized anti-SSEA3 |
| ES-SSEA3 | ES cells bound to immobilized anti-SSEA3 |
| ES-DBA | ES cells bound to immobilized DBA |
Microfluidic device design and fabrication
Two devices, namely, Hele-Shaw and straight channel devices were used in this study. The Hele-Shaw device has a geometry whereby fluid shear stress along the longitudinal axis of the device decreases linearly with device length.15 Microfluidic device design and fabrication followed previously described soft lithography techniques.16, 17 Negative masters for device fabrication were manufactured at the George J. Kostas Nanoscale Technology and Manufacturing Research Center at Northeastern University. Preceding this step, 2-dimensional projections of the device were drawn using autocad, and the image printed at high resolution on transparency (FineLine Imaging, Colorado Springs, CO). A negative master was generated from the photo mask. SU 8-50 photoresist was spin coated on silicon wafers to a thickness of approximately 70 μm and the transparency overlaid. This was exposed to ultraviolet light (365 nm, 17.75 mW/cm2) from a Quintel 2001 mask aligner. Once curing was completed the unexposed photoresist was removed using SU 8 developer, and the feature height verified using a Dektak surface profiler (Veeco Instruments, Santa Barbara, CA).
Polydimethysiloxane (PDMS) replicas were generated using silicone elastomer and curing agents in the ratio of 10:1 (w/w). This mixture was poured onto the negative master and allowed to degas, then cured at 65 °C for 2 h. PDMS replicas were released from the wafers prior to punching inlet and outlet holes with a 19-gauge blunt-nose needle.
For bonding, the replicas and glass slides were exposed to oxygen plasma (100 mW with 8% oxygen for 30 s) in a PX-250 plasma chamber (March Instruments, Concord, MA) and then immediately placed in contact with each other. The irreversible bond between PDMS and glass was completed by baking for 5 min at 65 °C. Surface functionalization of the devices was performed immediately following the baking step.
Surface modification
Functionalization of microfluidic device surfaces followed previously described protocols.16 Briefly, a 4% (v/v) solution of 3-mercaptopropyl trimethoxysilane in ethanol was prepared under nitrogen atmosphere and injected into each device. This was left to react for 30 min and the unreacted silane was flushed out with ethanol and a 0.28% GMBS in ethanol solution flowed through the devices. The GMBS was left to react for 15 min. Thereafter, ethanol was used to flush out unreacted GMBS followed by flushing with PBS. Each ligand was diluted with 1× PBS to a concentration of 0.01 mg/ml and this solution injected into individual devices. Following a 30 min incubation period, the devices were flushed with PBS and either used directly in experiments or stored at 4 °C.
Cell culture
BG02 human ES cells were sustained in mitomyocin C inactivated mouse embryonic feeder (MEF) layers in DMEM/F 12, 20% knockout serum replacer, 2 mM L-glutamine, 0.1 mM MEM non-essential amino acids, 50 U/ml penicillin, 50 μg/mL streptomycin (all from Invitrogen), 1000 U/ml hLIF (Chemicon), 0.1 mM βME (Sigma), and 4 ng/ml bFGF (Sigma). Cells were passaged every 3 days with 0.05% trypsin-EDTA (Invitrogen) and replated on fresh feeder layers. Cell differentiation was completed by plating collagenase/trypsin passaged at a density of 1-5 × 10⁴ cells/cm2 on Matrigel in MEF-CM, 8 ng/ml of human recombinant fibroblast growth factor 2 (Fgf2) (R&D Systems), 20% Knockout Serum Replacement (KSR) (Gibco).
Flow cytometry
Cells were incubated in fluorescently labeled anti-SSEA3, anti-SSEA4, anti-CXCR4, PNA, DBA, and UEA I for 30 min. Cells were centrifuged at 190 × g and resuspended in PBS prior to loading in the flow cytometer for analysis.
Cell capture experiments
Homogeneous suspensions containing 1 × 10⁵cells/ml of ES or DE cells in culture medium were flowed through ligand functionalized Hele-Shaw devices at 60 μl/min, which represents a shear stress range of 0.74–2.12 dyn/cm2,16 using a Harvard Apparatus PHD 2000 syringe pump (Holliston, MA) for 10 min. Unfunctionalized, bare glass devices were used as controls. Cell adhesion was measured by placing a field finder (with 1 mm × 1 mm grids) under the device and counting manually at selected points along the device axis under a Nikon Eclipse TE2000 inverted microscope. Three cell counts were taken and averaged at each location, with each location representing a 1 mm square. All flow experiments were performed at room temperature.
Binding kinetics experiments
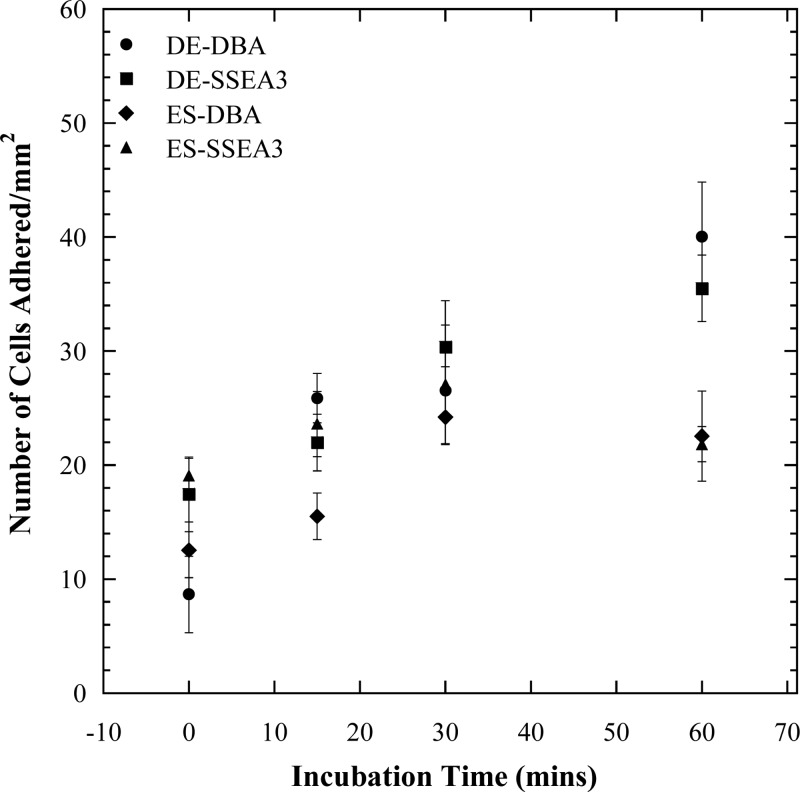
Bond strength experiments involved pumping DE and ES cells at a concentration of 2 × 10⁶ cells/ml into straight channel devices at a flowrate of 10 μl/min for 10 min. This allowed for a high number of cells to enter the device without settling in the syringe. The flowrate was then lowered to 3.62 μl/min for 10 min to allow for a high number of cells to adhere to the device surface. These flow rates were determined to be the most ideal in terms of having sufficient numbers of cells within the devices. The captured cells were enumerated and incubated for 0, 15, 30, and 60 min. These cells were then detached by flowing culture medium into the microchannel at a flowrate of 8 μl/min (1.54 dyn/cm2) for 20 min. The remaining cells were enumerated by using a field finder (with 1 mm × 1 mm grids) placed under the microfluidic chamber and counting cells at locations corresponding to ¼, ½, and ¾ × the total channel length. Binding strength was determined from the experiments completed following simple binding kinetic equations formulated as follows. Cell adhesion to ligand coated surfaces can be rationalized as a pseudo-first order binding dependent on the number of available discrete cell binding sites (assuming a single cell binds to one site), s(t) (Eq. 1).18, 19 The result of this is the number of bound cells, b(t) expressed in Eq. 1. Bound cells may detach from the surface by either shear flow or collision with another cell in suspension. This event is accounted for with the reverse reaction,
| (1) |
Utilizing the principles of mass action kinetics, the equation describing the time rate change of the cell and site as a function of the cell-site complex b(t) is
| (2) |
The association rate constant kon (M−1min−1) characterizes the second-order interaction between the cell and site, while the dissociation rate constant koff (min−1) characterizes the first-order breakdown of the cell/site complex. Solving Eq. 2 for s(t) gives the following equation with an additional term s0, the maximum number of cells adhered
| (3) |
Solving for b(t) in Eq. 2 gives
| (4) |
Equation 4 is determined using the experimental protocol in this section. The apparent saturation (s0app,) and rate (kapp) constants are related to kon and koff (Eq. 5)
| (5) |
Once kon and koff are known, the dissociation constant (Kd) can be determined as follows:
At equilibrium in Eq. 2, hence and
| (6) |
Statistics and data analysis
For each ligand, five repetitions of experiments were performed. Reported uncertainties represent standard errors of the mean (standard deviation/√n, where n = 5). One-way analysis of variance (ANOVA) was performed to investigate the relationship between cell adhesion of the two cell types measured within Hele-Shaw devices at a shear stress level of 0.74 dyn/cm2. This analysis was executed using kaleidagraph 4.0. A p value ≤ 0.01 was considered significant.
RESULTS AND DISCUSSION
Flow cytometry characterization
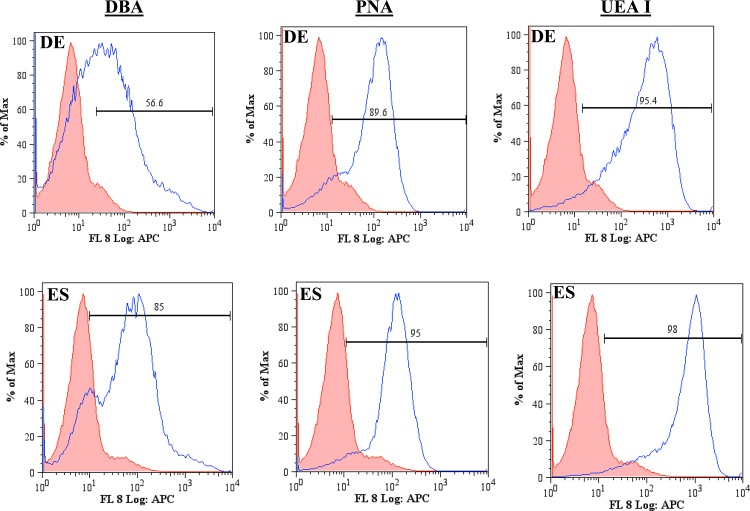
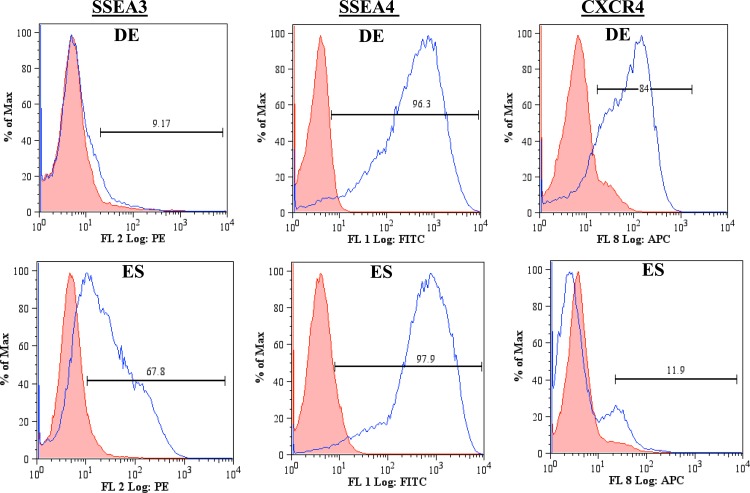
The carbohydrate patterns recognized by the lectins DBA, PNA, and UEA I on DE and ES cells (Table TABLE I.) were first evaluated using flow cytometry (Fig. 1). Comparisons were made between the negative and positive populations for each condition studied. DE cells displayed a lower expression of the carbohydrates recognized by DBA than those recognized by PNA and UEA I. PNA and UEA I recognize the sugars D-(+)-galactose20 and α (1,2)-fucose,21 respectively. More than 90% of the DE population was positive for the carbohydrates recognized by PNA and UEA I, while 56% of the DE population was positive for the carbohydrates recognizing DBA. DBA recognizes the sugar β-N-acetylgalactosamine (GalNAc) on the surface of DE cells.14 Given that 85% of the ES population is positive for DBA in the flow cytometry data, it is clear that the surface of these cells is highly populated with GalNAc. The abundance of GalNAc decreases as ES cells differentiate into DE cells. This observation is consistent with that reported in the literature.6 There is incomplete suppression of this sugar suggesting that undifferentiated cells may be present within the DE cell population. The flow cytometry data indicate that D-(+)-galactose and α (1,2)-fucose are also abundant on the cells surface. The expression of SSEA3, SSEA4, and CXCR4 by ES and DE cells was also examined via flow cytometry (Fig. 2). DE cells express SSEA3 in low levels while expressing SSEA4 and CXCR4 highly. SSEA3 is known as a sensitive marker of the most primitive state for human ES cells, and there is evidence of the rapid loss of SSEA3 expression before that of the other human ES cell surface antigens during differentiation.22 SSEA4 is a marker that is generally present on differentiated and undifferentiated ES cells23 and the high expression observed is therefore expected. ES cells express CXCR4 minimally while having a higher expression for SSEA3. This observation is consistent with the association of CXCR4 with ES differentiation.24
Figure 1.
Flow cytometry plots of ES and DE cells' expression of the carbohydrates recognizing the lectins DBA, PNA, and UEAI. The shaded population represents the negative control, while unshaded population represents the cells binding to the ligand. Both cell types express high levels of carbohydrate patterns for the lectins studied.
Figure 2.
Flow cytometry plots for ES and DE cells expression of common stem cell markers. The shaded population represents the negative control, while unshaded population represents the cells binding to the ligand. DE and ES cells have different expressions of SSEA3 and CXCR4.
Microfluidic characterization
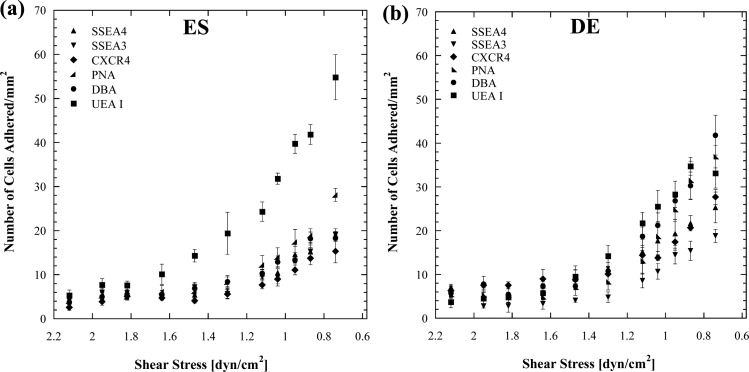
Microfluidic channels with flared geometry were used to characterize cell adhesion at various shear stresses. This channel geometry generates a linear decay in shear stress from inlet to outlet along the channel axis, a flow pattern known as Hele-Shaw flow.16 By functionalizing the channel surfaces with different ligands, shear-mediated cell adhesion measurements along the axis can therefore be obtained for a fixed ligand surface density. The lectins DBA, PNA, and UEA I that recognize the sugars GalNAc, D-(+)-galactose, and α (1,2)-fucose, respectively, and antibodies against the stem cell markers SSEA3, SSEA4, and CXCR4 were immobilized within Hele-Shaw devices to examine ES and DE adhesion profiles. Homogenous populations of DE and ES cells were flowed into these devices and the captured cells enumerated. The affinity that each cell type has for a given ligand can be determined based on the degree of cell adhesion over the experimental shear stress range. Within the microchannels ES cells have the highest affinity for UEA I (Fig. 3). These cells, however, have a higher affinity for PNA than for SSEA3, SSEA4, CXCR4, and DBA. DE cells in general displayed higher adhesion/affinity for all the ligands studied. These cells had the highest affinity for DBA and lowest for SSEA3.
Figure 3.
Cell adhesion as a function of shear stress with (a) human embryonic stem cells and (b) Definitive endodermal cells on ligand coated surfaces. DE cells in general have a higher affinity for each ligand than ES cells with the exception of UEAI that ES cells have a substantially high affinity for.
Comparison of flow cytometry and microfluidics
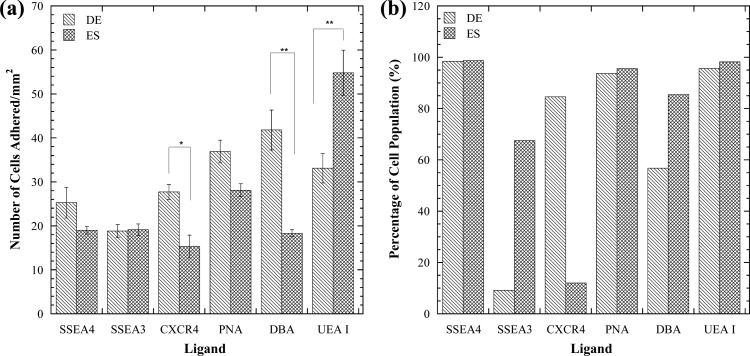
Flow cytometry is a powerful tool that is relied highly upon to identify cells via fluorescent labeling of surface markers; the overall fluorescence intensity of a cell is therefore proportional to the surface density of these markers. This technique is however unable to provide any measure, direct or indirect, of the strength of the bond between receptors and ligands. In a ligand-coated microfluidic channel, by contrast, the cell adhesion resulting from receptor-ligand affinity is, in turn, dependent on bond strength and receptor density. Consequently, flow cytometry data and microfluidic cell adhesion data sometimes appear to contradict each other, as discussed below. A portion of Fig. 3 results was selected for further examination in Fig. 4. For this analysis, a shear stress of 0.74 dyn/cm2 was selected. This shear stress was chosen because clear distinctions can be made between the affinity levels each cell type has for each ligand at this point. In Fig. 4a, comparisons are made between the adhesion of ES and DE cells to the panel of adhesive immobilized molecules. There is a significant difference in cell adhesion between DE and ES cells in DBA-, UEA I-, and anti CXCR4-coated microchannels. DE cells adhere significantly more to DBA-coated devices than ES cells. Conversely, ES cells adhere significantly more to UEA I-coated surfaces than DE cells. Based on this, immobilized DBA and UEA I ligands could be used to selectively capture DE and ES cells, respectively, and further track differentiation. CXCR4 would not be a good candidate for a distinction between ES or DE cells as the overall cell capture is low.
Figure 4.
(a) Comparison of ES and DE cell adhesion to a panel of adhesive molecules at a shear stress of 0.74 dyn/cm2. *denotes significant difference with p = 0.009 and ** denotes significant difference with p < 0.003. (b) Evaluation of lectin and stem cell maker expression for ES and DE cell populations with flow cytometry. Microfluidic and flow cytometry differ for some ligand studied.
The data from Figs. 12 are summarized in Fig. 4b for comparison with the data in Fig. 4a. DE and ES cells have a high population of SSEA4, PNA, and UEA I positive cells (Fig. 4b). ES cells highly express SSEA3 and the carbohydrates recognized by DBA, while DE cells express them in lower levels. DE cells express high levels of CXCR4 while ES cells have very low levels of expression for this marker. In comparing Figs. 4a, 4b, there appears to be a difference between the ES and DE profiles for SSEA4 and PNA in the microfluidic measurement, while little difference exists in the flow cytometry data. The microfluidic measurements are, however, not statistically different (p = 0.16 for SSEA4, p = 0.03 for PNA). This lack of difference is due to equally high receptor expression (the majority of DE and ES cells are positive for SSEA4 and PNA as illustrated in Figs. 12). DE cells have more receptors for CXCR4 than ES cells according to flow cytometry, and this result agrees with the microfluidic data. By contrast, the profiles for DE and ES expression of SSEA3 are different for flow cytometry but similar in microfluidics. The carbohydrate molecule (α (1,2)-fucose) that UEA I recognizes is highly expressed in both cell types as indicated in flow cytometry. The high number of α (1,2)-fucose molecules present on DE and ES cells thereby allows them to adhere highly to immobilized UEA I within microchannels. The flow cytometry data shows that ES cells highly express the carbohydrate recognized by DBA more than DE cells. However, the microfluidic data shows an opposite trend indicative by ES cells adhering less to DBA than DE cells (Figs. 4a, 4b).
Binding kinetics analysis
To address the above inconsistencies observed between the microfluidic and flow cytometry data, binding strength experiments were performed with the ligands DBA and anti-SSEA3 in linear microchannels with parallel geometry. The results from these experiments (Fig. 5) indicate that as incubation time increases, the bond between cell and ligand grows stronger; hence, cells detach less after longer incubation times. In general, DE cells detached to a lesser extent than ES cells from DBA- and anti-SSEA3-coated channel surfaces. Best fit curves were obtained for each condition in Fig. 5 and the parameters from Eq. 4 extracted from the equation of each curve. The Kd was determined for each condition using Eq. 6 (Table TABLE II.). The bond between ES cells and anti-SSEA3 has the highest dissociation constant, while the bond between DE cells and anti-SSEA3 has the lowest dissociation constant. A small Kd value corresponds to a large value of equilibrium association constant, Ka = 1/Kd, indicating a high affinity for the receptor ligand. Therefore, within the four cell-ligand combinations examined in Fig. 5, the strongest cell-ligand bond is between DE cells and anti-SSEA3, while the weakest bond is between ES cells and anti-SSEA3. ES cells have weaker overall binding with both anti-SSEA3 and DBA. The literature on dissociation constants of embryonic stem cells with lectins is very limited; however, it is known that in general cells bind weakly to lectins (Kd between 10−3 and 10−6M).25, 26 In the experiments performed herein, we observed that under flow conditions embryonic stem cells are not very adhesive and hence the dissociation constants obtained are comparatively much higher.
Figure 5.
The kinetics of DE and ES cells adhesion to DBA and anti-SSEA3 coated parallel flow devices. These data points are fitted to a pseudo-first order kinetic model (Eq. 4). Longer incubation time results in less cell detachment.
TABLE II.
Fitted parameters to the cell binding kinetic model for the varying cell ligand interactions.
| kon (M−1 min−1) | koff (min−1) | kapp | Kd (M) | |
|---|---|---|---|---|
| DE-DBA | 0.0134 | 0.0156 | 0.029 | 1.159 |
| DE-SSEA3 | 0.0126 | 0.0053 | 0.0179 | 0.422 |
| ES-SSEA3 | 0.0535 | 0.1575 | 0.211 | 2.946 |
| ES-DBA | 0.0120 | 0.0315 | 0.0435 | 2.632 |
Comparison of microfluidic binding strength assay with flow cytometry
An analysis of the observed inconsistencies between the microfluidic and flow cytometry follows. DE and ES cells have similar microfluidic profiles but different flow cytometry profiles for SSEA3 affinity. The flow cytometry data indicate that ES cells have an abundance of SSEA3 receptors, while DE cells have minimal expression levels (Fig. 2). The binding kinetics experiments indicate that the bond between DE cells and anti-SSEA3 is strong while the bond between ES cells and anti-SSEA3 is much weaker (Table TABLE II.). Taken together, the microfluidic cell adhesion data, the flow cytometry data and the binding kinetics data suggest that high cell adhesion (defined arbitrarily as >20 cells/mm2) requires both a strong cell-ligand bond and a high number of receptors capable of binding to the given ligand. In the case considered above each pair (DE-SSEA3 and ES-SSEA3 (Table TABLE I.)) is lacking in one of these attributes, hence the low level of cell adhesion observed and the similar microfluidic profiles (Fig. 4a) despite the difference in flow cytometry profiles.
The adhesion of DE cells to DBA is greater than 20 cells/mm2 in Fig. 4a, which means that these cells are expected to have a strong bond and high receptor numbers per the criteria established above. The adhesion of ES cells to DBA is, however, below 20 cells/mm2 in Fig. 4a indicating either a weak bond or low receptor numbers. In this pair of cases (DE-DBA and ES-DBA (Table TABLE I.)), the flow cytometry and microfluidics data show different trends, because the two conditions required for high adhesion are not met. Specifically, while both cells have high expression of DBA-binding receptors, the ES-DBA bond is considerably weaker than the DE-DBA bond (Table TABLE II.). This distinction explains why ES cells are unable to bind at high levels in DBA-coated microchannels while DE cells do.
The above analysis illustrates that surface abundance of an antigen is not enough to achieve high cell capture. To achieve high capture within a microchannel there needs to be sufficiently high receptor density in addition to a strong ligand-receptor bond. This latter point is very relevant to the design of affinity-based separation systems for cells as well as in cell adhesion assays.
CONCLUSIONS
This work had a twofold objective. The first was to characterize stem cell differentiation markers. In the process of characterizing the markers with our microfluidic cell adhesion assay, comparisons were made between this assay and standard flow cytometry. The results from the comparison indicated an apparent discrepancy between the microfluidic and flow cytometry data, which was examined further. Insights were gained into how simple cell adhesion assay in microfluidic channels can complement flow cytometry analysis and how immobilized lectins can be utilized to track embryonic stem cell differentiation. An advantage of the microfluidic approach is its ability to provide information about the combined effect of receptor-immobilized ligand bond strength and receptor density whereas flow cytometry only assesses the latter. Another advantage of the microfluidic approach is its relative simplicity with no fluorescent labeling or expensive instrumentation needed.
ACKNOWLEDGMENTS
We gratefully acknowledge financial support from the U.S. National Science Foundation through Grant No. CBET-0747166 (CAREER) to S.K.M. and the U.S. National Institutes of Health through Grant Nos. P01 GM75334 and P41 RR018502 to S.D.
References
- Calhoun J. D., Rao R. R., Warrenfeltz S., Rekaya R., Dalton S., McDonald J., and Stice S. L., Biochem. Biophys. Res. Commun. 2, 323 (2004). 10.1016/j.bbrc.2004.08.117 [DOI] [PubMed] [Google Scholar]
- Azarin S. M. and Palecek S. P., Biochem. Eng. J. 3, 48 (2010). 10.1016/j.bej.2009.10.020 [DOI] [PMC free article] [PubMed] [Google Scholar]
- Metallo C. M., Ji L., de Pablo J. J., and Palecek S. P., “ Directed differentiation of human embryonic stem cells to epidermal progenitors,” in Epidermal Cells: Methods and Protocols, Second Edition, edited by Turksen K. (Humana, Totowa, 2010), Vol. 585, pp. 83–92. [DOI] [PMC free article] [PubMed] [Google Scholar]
- Thomson J. A., Itskovitz-Eldor J., Shapiro S. S., Waknitz M. A., Swiergiel J. J., Marshall V. S., and Jones J. M., Science 5391, 282 (1998). 10.1126/science.282.5391.1145 [DOI] [PubMed] [Google Scholar]
- Pera M. F., Reubinoff B., and Trounson A., J. Cell Sci. 1, 113 (2000). [DOI] [PubMed] [Google Scholar]
- Nash R., Neves L., Faast R., Pierce M., and Dalton S., Stem Cells 4, 25 (2007). 10.1634/stemcells.2006-0224 [DOI] [PubMed] [Google Scholar]
- Gertow K., Cedervall J., Jamil S., Ali R., Imreh M. P., Gulyas M., Sandstedt B., and Ährlund-Richter L., PLoS ONE 11, 6 (2011). 10.1371/journal.pone.0027741 [DOI] [PMC free article] [PubMed] [Google Scholar]
- Chapman G., Remiszewski J. L., Webb G. C., Schulz T. C., Bottema C. D. K., and Rathjen P. D., Genomics 2, 46 (1997). 10.1006/geno.1997.4969 [DOI] [PubMed] [Google Scholar]
- Varlakhanova N., Cotterman R., Bradnam K., Korf I., and Knoepfler P., Epigenetics Chromatin 1, 4 (2011). [DOI] [PMC free article] [PubMed] [Google Scholar]
- Alvarez-Manilla G., Warren N. L., Atwood J., Orlando R., Dalton S., and Pierce M., J. Proteome Res. 5, 9 (2010). 10.1021/pr8007489 [DOI] [PMC free article] [PubMed] [Google Scholar]
- Zheng T., Yu H. M., Alexander C. M., Beebe D. J., and Smith L. M., Biomed. Microdevices 4, 9 (2007). 10.1007/s10544-007-9074-2 [DOI] [PubMed] [Google Scholar]
- Chatterjee U., Bose P. P., Dey S., Singh T. P., and Chatterjee B. P., Glycoconjugate J. 8, 25 (2008). 10.1007/s10719-008-9134-8 [DOI] [PubMed] [Google Scholar]
- Chen S. Y., Zheng T., Shortreed M. R., Alexander C., and Smith L. M., Anal. Chem. 15, 79 (2007). 10.1021/ac070423k [DOI] [PMC free article] [PubMed] [Google Scholar]
- Dodla M. C., Young A., Venable A., Hasneen K., Rao R. R., Machacek D. W., and Stice S. L., PLoS ONE 8, 6 (2011). 10.1371/journal.pone.0023266 [DOI] [PMC free article] [PubMed] [Google Scholar]
- Usami S., Chen H. H., Zhao Y. H., Chien S., and Skalak R., Ann. Biomed. Eng. 1, 21 (1993). [DOI] [PubMed] [Google Scholar]
- Plouffe B. D., Njoka D. N., Harris J., Liao J. H., Horick N. K., Radisic M., and Murthy S. K., Langmuir 9, 23 (2007). 10.1021/la0700220 [DOI] [PubMed] [Google Scholar]
- Xia Y. N. and Whitesides G. M., Annu. Rev. Mater. Sci. 28, 153 (1998). 10.1146/annurev.matsci.28.1.153 [DOI] [Google Scholar]
- Sin A., Murthy S. K., Revzin A., Tompkins R. G., and Toner M., Biotechnol. Bioeng. 7, 91 (2005). 10.1002/bit.20556 [DOI] [PubMed] [Google Scholar]
- Lauffenburger D. A., Receptors: Models for Binding, Trafficking, and Signalling (Oxford University Press, New York, 1993). [Google Scholar]
- Suzuki-Nishimura T., Nakagawa H., and Uchida M. K., Jpn. J. Pharmacol. 4, 85 (2001). 10.1254/jjp.85.443 [DOI] [PubMed] [Google Scholar]
- Wearne K. A., Winter H. C., O’Shea K., and Goldstein I. J., Glycobiology 10, 16 (2006). 10.1093/glycob/cwl019 [DOI] [PubMed] [Google Scholar]
- Enver T., Soneji S., Joshi C., Brown J., Iborra F., Orntoft T., Thykjaer T., Maltby E., Smith K., Abu Dawud R., Jones M., Matin M., Gokhale P., Draper J., and Andrews P. W., Hum. Mol. Genet. 21, 14 (2005). 10.1093/hmg/ddi345 [DOI] [PubMed] [Google Scholar]
- Ramirez J.-M., Gerbal-Chaloin S., Milhavet O., Qiang B., Becker F., Assou S., Lemaître J.-M., Hamamah S., and De Vos J., Stem Cells 9, 29 (2011). 10.1002/stem.681 [DOI] [PubMed] [Google Scholar]
- Touboul T., Hannan N. R. F., Corbineau S., Martinez A., Martinet C., Branchereau S., Mainot S., Strick-Marchand H., Pedersen R., Di Santo J., Weber A., and Vallier L., Hepatology 5, 51 (2010). 10.1002/hep.23506 [DOI] [PubMed] [Google Scholar]
- Lo K. Y., Sun Y. S., Landry J. P., Zhu X. D., and Deng W. B., Biotechniques 6, 50 (2011). 10.2144/000113670 [DOI] [PMC free article] [PubMed] [Google Scholar]
- Smith E. A., Thomas W. D., Kiessling L. L., and Corn R. M., J. Am. Chem. Soc. 20, 125 (2003). 10.1021/ja034165u [DOI] [PubMed] [Google Scholar]


