Abstract
Self-imaging Petri dish platforms with microscopy resolution, which we term as ePetri, can significantly streamline cell cultures and/or other longitudinal biological studies. In this paper, we demonstrate high resolution imaging and long term culture of motile microorganisms in a specialized ePetri platform by taking advantage of the inherent motion. By applying a superresolution algorithm to a set of low-resolution images of the microorganisms as they move across the sensing area of a Complementary metal Oxide Semiconductor (CMOS) image sensor chip, we can render an improved resolution image of the microorganisms. We perform longitudinal study of Euglena gracilis cultured in an ePetri platform and image based analysis on the motion and morphology of the cells. As a miniaturized and automated culture monitoring platform, this ePetri technology can greatly improve studies and experiments with motile microorganisms.
Introduction
Optical detection and monitoring is a key tool in interrogating the growth and behaviour mechanism of microorganisms. Various optical methods, such as optical density, speckle pattern, spectral analysis, colorimetry and bright field/fluorescence imaging are used to measure the changes in various motion and growth parameters of microorganisms in a non-invasive manner.1–5 Among all, imaging based monitoring gives more direct and detailed information about the culture by visualizing the morphological and behavioural changes of each individual cell. In addition, current computational capabilities allows for automated longitudinal imaging and analysis, with low cost, reduced labour and better temporal resolution. 6–9
A microscope has long been a standard equipment in conducting imaging-based studies. However, time-resolved imaging using an expensive microscope increases the cost of these experiments. In addition, numerical aperture limitation of the objective lens in a microscope prohibits high-resolution imaging over a large area without the use of additional actuation systems. Miniaturization of imaging tools can benefit many scientific researches, such as study on the swimming behaviour of flagellated protozoa1, 10 and behavioural studies using Caenorhabditis elegans models.11 In addition, it can lower the cost of many clinical applications such as sperm counting,12 toxin screening assay using fresh water microorganisms,13 and blood/water-born parasite diagnostics.14
In recognition of this need, low-cost on-chip imaging techniques, such as optofluidic microscopes (OFM) 15, 16, have been developed recently. In the OFM, as the sample is carried along a microfluidic channel on a CMOS image sensor, light transmission through the sample is collected and time-resolved transmission signal is converted into spatial information of the sample. In the case of the most recent version of OFM, referred to as subpixel resolving optofluidic microscope (SROFM)16, pixel superresolution algorithm is used to combine a sequence of low resolution shadow images to a high resolution image. OFM method relies on translational delivery of the target object by electro-kinetic or laminar flow inside a microfluidic channel, which makes it tough to continuously monitor the same living specimen repeatedly over a long period of time.
Recently, we have reported a self-imaging Petri dish for biological studies, named ePetri dish platform.17 Here, the CMOS image sensor serves as the substrate of cell growth. The ePetri allows for continuous monitoring of live specimen in a large field of view over a long period of time with the minimum labour and low cost. In our previous work, subpixel sweeping microscopy (SPSM) method was used in order to boost the resolution beyond the pixel size of the sensor. SPSM uses raster scanning of a light source to create sub-pixel shifted low resolution shadow images, which are later combined into a single high resolution image with a pixel superresolution algorithm. This approach works well for biological targets that are relatively immotile, as the time required to acquire an adequate sequence of low resolution shadow images is relatively long. For moving microorganisms, the SPSM ePetri is simply unable to perform good imaging.
Fortunately, we believe that the inherent motion of the microorganisms can be used a means to obtain subpixel shifts that are required for pixel superresolution image reconstruction. In this paper, we report a strategy that combines key ideas of SROFM and ePetri to appropriately perform microscopy imaging of motile microorganisms. We name this technique subpixel motion microscopy (SPMM). Using SPMM, We first demonstrate high resolution imaging by taking advantage of the swimming behaviour of motile protozoa Euglena gracilis, which is a well-known model organism for cellular tracking studies and many biological assays. Then, we conduct longitudinal study of Euglena gracilis, demonstrating microorganism counting, tracking and statistical analysis capabilities using the described ePetri system. Through the proof-of-concept experiments, we show that the ePetri platform using SPPM method allows for inexpensive, miniaturized and minimum-labour culture monitors, that can benefit clinical and scientific researches.
Results and Discussions
Operation principle and device structure
The SPMM ePetri dish platform takes a very simple geometry; a bare CMOS image sensor and a PDMS well mounted on top. As the microorganisms are cultured in the ePetri dish, the shadow images of the cells are continuously captured through the sensor. The resolution of the raw images is fundamentally limited to be equal to twice the pixel size of the image sensor by the Nyquist criterion (the pixel size is 2.2 μm in our experiment.). The use of SPMM method improves the optical resolution of the final images beyond this limit. SPMM is based on the pixel superresolution algorithm18, 19, where low resolution images of the same object with subpixel shifts are combined to a higher resolution image. For motile microorganisms, their inherent motion allows themselves to be scanned on the sensor’s pixel grid, providing the subpixel shifts between each low resolution frame that are essential for the image reconstruction. Collected low resolution images are redistributed into a denser grid of a single high resolution image, with the redistribution vector determined by the subpixel displacement of the cell at each frame with respect to the first frame. We use minimum of n2 low resolution frames for a single high resolution image reconstruction, where n is the enhancement factor, defined as the size ratio between the original low resolution pixel and the virtual high resolution pixel.
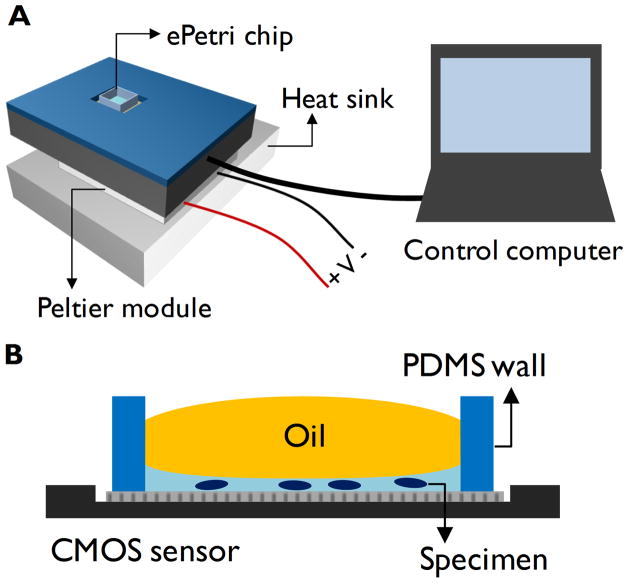
The ePetri system is shown in figure 1. Each ePetri chip containing the sample is loaded into a camera board. A customized software controls the camera through a frame grabber and performs subsequent image processing for pixel superresolution reconstruction. We used Aptina MT9P031 5 megapixel image sensors with the pixel size of 2.2 μm, which has the total imaging area of 6.3 mm × 4.8 mm. As in OFM systems, the optical resolution of the ePetri is the highest at the floor of the image sensor. In order to keep the microorganisms as close to the sensor surface as possible, we dispensed a small amount (< 5 μL) of culture medium containing the specimen into an ePetri chip, and confined the vertical location of the microorganisms to less than 100 μm from the sensor’s surface. A drop of oil was put on top of the culture medium on order to prevent drying during the experiment.
Figure 1.
(a) ePetri dish imaging platform is composed of an ePetri chip, camera module and a control computer. A Peltier module and a heat sink are used to maintain the temperature of the chip. (b) Schematic diagram of a single ePetri dish chip. Sample is dispensed into a chip and a drop of oil is used to prevent evaporation of the medium.
SPMM imaging of motile microorganisms with ePetri platform does not require a use of special light source, and can use the room lighting or natural lighting for illumination. We used a green LED lamp (0.2 W/m2) in all experiments as an illumination source to keep the phototaxis level identical in all cultures. Under this illumination condition, 0.2 ms exposure for single frame was found to be adequate. Since the camera board can exhibit elevated temperature during the course of long term imaging, we used a Peltier module and a heat sink to dissipate the heat from the board.
SPMM imaging of Euglena gracilis
Pixel superresolution image reconstruction in SPMM method requires a sequence of shadow images where the target object is continuously translated. The raw images captured through the sensor can be considered as undersampled images of the original object with a known subpixel shift between each frame. Upon reconstruction, the low resolution images are enhanced by n times, meaning that the physical size that a single pixel represents decreases by the factor of 1/n in the reconstructed high resolution image. This subpixel shift ((dkx,dky), for kth image in the sequence) determines the vector in which n2 different low resolution shadows are redistributed within the denser pixel grid of a single high resolution image. However, unlike SPSM method where a scanning light source creates shadows that are incrementally shifted with the fixed amount of displacement along both x and y direction, SPMM method is based entirely on the inherent motion of the microorganisms. This implies that we need to accurately trace and calculate each microorganism’s position in every frame. As such, the subpixel shifts, from here on referred to as motion vector, of each cell is obtained by tracing the each cell’s rough position throughout the low resolution sequence. Details on the method in which we obtain motion vectors of the microorganisms and circumvent the reconstruction errors caused from the inadequate motion of the cells are discussed later in this paper.
We used Euglena gracilis for demonstration of SPMM imaging technique. Euglena gracilis is an ellipsoidal protozoan with the dimensions of approximately 60 × 10 × 10 μm. It is well known that its motion is propelled by a long flagellum beating around the body, and it moves in a rototranslatory motion with the speed of about 100–400 μm/s. 1, 20, 21 Its body is slightly tilted with respect to the axis of the movement.20 Considering the motion parameters of Euglena gracilis, we set the imaging frame rate at 180 fps, where we typically used 16 – 25 images to reconstruct a single high resolution image with the enhancement factor n = 4 – 5. This lengths of the sequence represent the image of the cell during approximately 0.1 seconds, which typically gives 10–40 μm displacement of the microorganisms within the sequence and makes it safe to assume that the internal sub cellular structures are static and the rotation perpendicular to the axis of translation is negligible. Due to the limitations in the data transfer rate of the camera, we used a smaller FOV of 400 × 200 pixels.
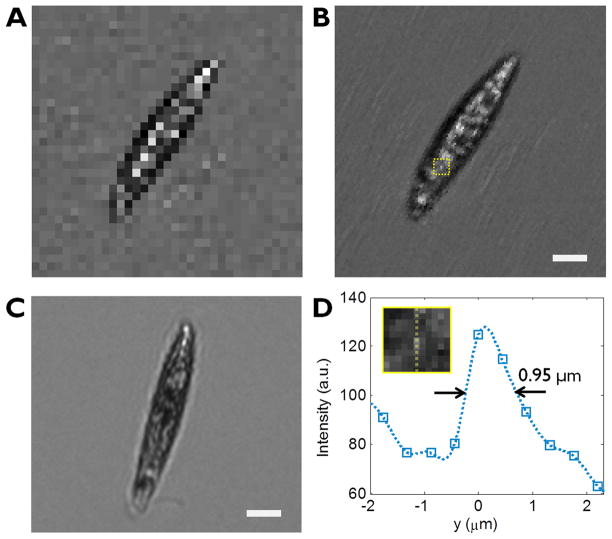
Figure 2 shows the comparison between the raw and the reconstructed high resolution image of an Euglena gracilis with n = 5. The motion vector for each Euglena gracilis cells were calculated using a simple image processing technique. In the law sequence, the centre locations of the organisms were found in each frame with the 0.5 pixel accuracy and then these values are smoothed throughout the sequence to estimate the cell location with subpixel accuracy. To reduce the amount of computation in the image reconstruction, each image is cut with a fixed window size around the target cell (17 × 17 pixels) and used the relative shifts (dkx − [dkx], dky − [dky]) for reconstruction. The raw sequence used for this reconstruction and the measured motion vector is shown in fig. S1.
Figure 2.
Raw (a) and reconstructed (b) images of Euglena gracilis using SPMM method with n=5. (c) A conventional microscope image of a Euglena gracilis taken with a 10x objective lens. The scale bar indicates 10 μm. (d) The line traces of a small bright feature in the reconstructed image Inset corresponds to the area highlighted in (b).
Since the basic principle of imaging is similar to SROFM method, the ultimate optical resolution of SPMM is similar to that of SROFM, reported as 0.66 μm at best22. The optical resolution of SPMM ePetri depends on the pixel size of the sensor, number of low resolution images used for the reconstruction and the motion of the microorganism. However, due to the erratic nature of the inherent motion of a microorganism, such as rotation, sudden change of direction and non-uniform speed, we can expect that the resolution would be poorer than the SROFM method. From the images we obtained with SPMM ePetri, we were able to observe a small bright feature with the full-width-half-maximum of 0.95 μm, which is comparable with the resolution of a 0.30 NA 10x objective lens (0.92 μm resolution) used for comparison in figure 2(c). In addition, the resolution would be poor for larger and thicker microorganisms, due to the increased distance between the imaging plane and the sensor’s surface. The lower limit to the size of microorganism that can be imaged is determined by the pixel size of the sensor; cells that are far smaller than the pixel cannot be recognized in the raw image, and thus unable to trace the motion vector. With the 2.2 μm pixel sensor, we have successfully traced and imaged 0.5 μm features (microspheres) using the pixel superresolution algorithm17, 22.
It is worth noting that there exist some criteria in the cellular motion for a proper image reconstruction. In order for the entire part of the cells to be scanned with subpixel displacement, the translation of the cells should be at a certain angle with respect to the sensor’s pixel grid so that the sample is scanned with shifts both x and y directions. Assuming the linear translation of the cells within a sequence of N frames, the motion vector should satisfy following condition.
| (1) |
When such condition is not satisfied, the sample is not entirely scanned and the reconstructed image shows empty pixels in a form of stripes (horizontal when dy, vertical when dx is not enough.) with the period of the enhancement factor n (Fig. 3a-2). In order to prevent missing information in the image, we obtain the low resolution sequence for longer amount of time than 0.1 seconds, find the sequence where the angle of motion satisfies the condition in (1) with minimum N (Fig. 3a-3 and Fig. S2), or use more frames to satisfy (1).
Figure 3.
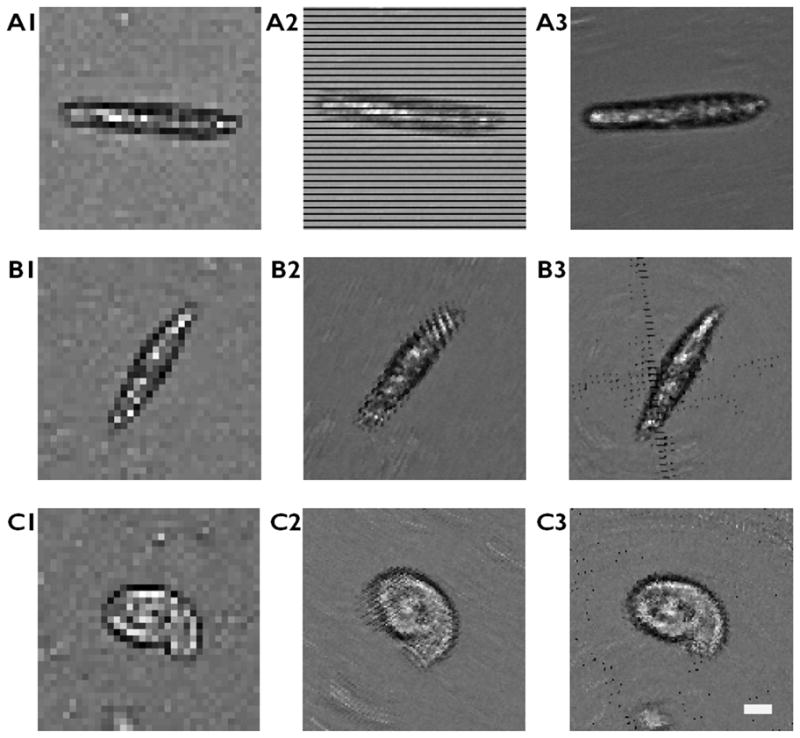
Artefacts in image reconstruction and improved images. (a) Cells moving in horizontal direction show missing information in y direction (a2) and a different sequence of the same cell with adequate motion vector showing a well-reconstructed image (a3). (b–c) Cells with large rotational movement show artefacts at the two ends of the cell (b2, c2). Reconstructed image with rotation compensation (b3, c3). The scale bar indicates 10 μm
Rotation of the cells can also cause artefacts in the reconstructed image. Although the rotation in a typical motion of a Euglena gracilis during the imaging period of 0.1 seconds is small compared to the translational component, the rotational frequency may increase depending on the condition of the cell1 and a cell may change its direction abruptly upon incidence with an obstruction. Figure 3b-2 and 3c-C show reconstructed images with periodic rotation artefacts at the tip of the microorganisms. To take the rotation of the cell into an account for the pixel superresolution reconstruction, it is required to measure the changes in the angle of orientation of the cells in each frame. We used two approaches to measure the angle of a cell; one approach calculates the angle from the shape of the cells in the low resolution images and the other approach calculates it from the displacement of cells between each subsequent frames. For the elongated microorganisms, the rotation angle can be easily measured directly from the raw images (Fig. 3b, Fig. S3). For the round cells, we can use the fact that the cells are directed towards the direction of motion and calculate the angle from the motion vector (Fig. 3c, Fig. S4). The rotational motion of the microorganisms can be compensated by re-rotating each frame by the angle θk during the reconstruction process. This rotation process can be described as below.
| (2) |
where ik represents kth low resolution image up-sampled by the factor of n and ikr represents kth low resolution image up-sampled by n, shifted and rotated for reconstruction. With the same set of low resolution sequence used for fig. 3b-2 and 3c-2, we can reconstruct rotation-compensated images (fig. 3b-3 and 3c-3) where the stripe-patterned artefacts are effectively removed.. However, it is worth noting that the image blur caused by the cell rotation perpendicular to the axis of translation cannot be computationally removed. We minimize this rotation-induced blur by maximizing the frame rate such that the cell rotation within the low resolution sequence is negligible.
Longitudinal imaging of Euglena gracilis
To demonstrate longitudinal imaging and motion analysis capabilities, we cultured Euglena gracilis protist in our ePetri system. Long term culture monitoring and image-based motion analysis with ePetri system can benefit many biological assays and scientific studies using Euglena gracilis. Due to their sensitivity to the changes in the chemical environment, Euglena gracilis is used for various microbiological assays, including vitamin B12 assay23 and aquatic toxicity assays7, 13, 24. Their phototactic and gravitactic movement has been intensively studied and utilized as sensors10, 25. Their shape also changes under different illumination conditions 6.
Euglena cells were cultured in ePetri platform and continuously imaged for 10 hours. We used two image acquisition modes; Large field of view imaging with low frame rate (16 fps) for continuous monitoring and smaller field of view scanning with higher frame rate (180 fps) for SPMM high resolution image reconstruction. From the large FOV image, statistical analysis on cell counting, tracking (speed and trajectory), size and shape distribution (aspect ratio of the cells) can be obtained for >200 cells. For a closer look into each cell, we performed SPMM imaging by dividing the entire imaging area into smaller windows (400 × 200 pixels) to obtain sequences with higher temporal resolution.
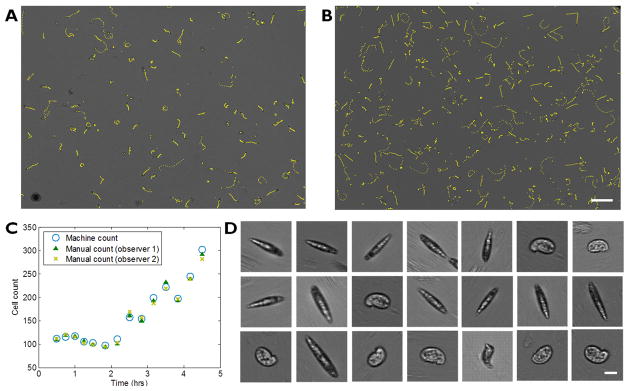
Figure 4a shows growth of euglena cells cultured in an ePetri system. 5 μL of euglena medium containing 140 cells were dispensed into an ePetri chip and cultured at room temperature with a green LED illumination (0.2 W/m2). Two snapshots of the culture at 1 hr and 5 hr show distinct increase in the cell population in the culture. High resolution images using SPMM method reveal details in the shape, size and opacity variations in each microorganisms (Fig. 4d). We observed Euglena gracilis in various stages of growth including young euglena cells with elongated shapes, old rounded cells, cells undergoing mitosis and non-motile palmella stage cells that are covered with mucilage. However since SPMM method relies on the movement of the target cells, images of immotile cells such as mitotic, palmella stage and lysed cells cannot be reconstructed with enhanced resolution.
Figure 4.
Longitudinal imaging of Euglena gracilis on ePetri dish. (a), (b) Large FOV images of Euglena gracilis at 1hr and 4.5 hrs, respectively. Yellow line shows traces of each cell for 1 second. (Scale bar 200 μm) (c) Growth in cell population counted with our cell counting software (blue) and manually counted (green, yellow). (d) High resolution images of Euglena gracilis reconstructed with SPMM method (selected). Scale bar indicates 20 μm.
Image analysis for cell counting was performed by first identifying each cell via thresholding the raw gray scale images (euglena cells or the boundary of euglena cells appear darker than the background), converting into binary image and then counting the number of areas within a predefined size range to filter out debris and noises. From the counting results, the growth of the cells showed clear increase with the doubling time of approximately 5 hours. To assure the accuracy of our cell counting software, our results were compared with manual counting results of 2 observers. The results showed the average percent difference of 3.0 % between the manual and the machine count, where percent difference between the observers is 3.1 %. (See table S1). Subsequent analysis for cell tracking and shape analysis was performed with simple image processing techniques. We traced each cells for 16 frames (1 second) to obtain the speed of the cells, which is an important parameter for the status of the culture. The mean velocity of the cells remained within 10% variance during the 5 hour culture, indicating that the culture environment in ePetri dish was adequate.
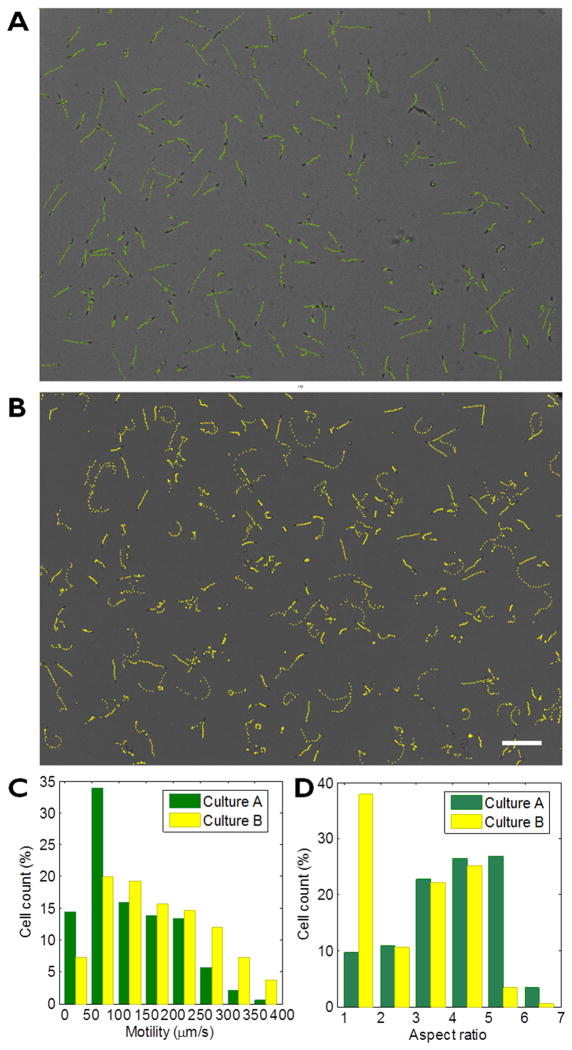
Next we performed differential experiment with two sets of euglena cultures. We used spring water as medium for culture A and the euglena culture medium for culture B. Two cultures were kept in ePetri for > 5 hrs under same temperature and illumination conditions. We used our analysis software to obtain the distribution of the motility and the cell shapes. The result shows that the cells cultured in fresh water have more population of elongated cell types with high aspect ratio and lower motility, whereas larger population of Euglena gracilis cultured in the medium showed faster motion and rounded shapes.
Conclusions
We demonstrated the imaging of motile microorganisms in an ePetri platform by using the inherent motion of the cells for the pixel superresolution reconstruction. Rototranslatory movement of Euglena gracilis allows capturing of sequence shadow images with subpixel shifts, which allows for imaging individual cells with the enhanced resolution than the pixel size of the sensors. Using SPMM method, we achieve high resolution imaging over 6 mm × 4 mm area without using any optical elements. In addition, we show long term culture of Euglena gracilis in a SPMM ePetri platform, and demonstrate image-based analysis for automatic cell counting, motion analysis and shape analysis.
This work, particularly focused on a motile microorganism, shows the versatility of our SPMM ePetri system in the choice of the sample and the type of information collectible through our system. The key advantage of our SPMM ePetri platform is that it lowers the labour and the cost of culture experiments by miniaturizing and automating the monitoring system. The user can simply dispense the specimen on an ePetri chip and monitor the growth through our software with the minimum access to the culture. It can also improve the quality of experiments a by improving the temporal resolution of the monitoring and allowing for streamlined and parallel process.
Experimental
Preparation of ePetri chip
We used MT9P031 (2.2 μm pixel, Aptina) image sensors. We removed the colour filter and the microlens layer by treating the sensor under oxygen plasma for 10 min (120W). The PDMS wall is prepared by mixing 1:10 with base and curing agent, then spin coated on a 3 in. silicon wafer followed by baking at 80 °C for 1 h. The surfaces of ePetri chips are treated with Poly-L-lysine (0.01%, Sigma-Aldrich) for 15 min and washed with distilled water for three times.
Euglena gracilis culture
Euglena gracilis (Carolina scientific) was cultured in a custom made euglena medium (spring water, 40 L−1 wheat grains, 35 L−1 rice grains and 5cm3/L dry skim milk, recipe provided by Carolina scientific) under natural sunlight illumination. All experiment was performed in room temperature where the Euglena gracilis are healthy and their reproduction is well promoted.
Supplementary Material
Figure 5.
Motion tracking and shape analysis using ePetri. (a–b) Euglenas cultured in spring water (a) and in euglena medium. Scale bar indicates 200 μm. (b) shows difference in their motion and the cell sizes. (c) Motility distribution of the cells. (d) Aspect ratio (major axis / minor axis) distribution of the cells.
Acknowledgments
We acknowledge funding support from the National Institute of Health (NIH) Agency Award R01AI096226-01.
Footnotes
Electronic Supplementary Information (ESI) available. See DOI: 10.1039/b000000x/
Notes and references
- 1.Ascoli C, Barbi M, Frediani C, Murč A. Biophysical journal. 1978;24:585. doi: 10.1016/S0006-3495(78)85406-X. [DOI] [PMC free article] [PubMed] [Google Scholar]
- 2.Höpfner T, Bluma A, Rudolph G, Lindner P, Scheper T. Bioprocess and Biosystems Engineering. 2010;33:247. doi: 10.1007/s00449-009-0319-8. [DOI] [PubMed] [Google Scholar]
- 3.Waterman-Storer CM, Desai A, Chloe Bulinski J, Salmon ED. Current Biology. 1998;8:1227. doi: 10.1016/s0960-9822(07)00515-5. [DOI] [PubMed] [Google Scholar]
- 4.Aizu Y, Asakura T. Optics & Laser Technology. 1991;23:205. [Google Scholar]
- 5.Tim M. Journal of Immunological Methods. 1983;65:55. doi: 10.1016/0022-1759(83)90303-4. [DOI] [PubMed] [Google Scholar]
- 6.Häder DP, Vogel K. Journal of Mathematical Biology. 1991;30:63. [Google Scholar]
- 7.Tahedl H, Häder DP. Ecotoxicology and Environmental Safety. 2001;48:161. doi: 10.1006/eesa.2000.2004. [DOI] [PubMed] [Google Scholar]
- 8.Levin-Reisman I, Gefen O, Fridman O, Ronin I, Shwa D, Sheftel H, Balaban NQ. Nat Meth. 2010;7:737. doi: 10.1038/nmeth.1485. [DOI] [PubMed] [Google Scholar]
- 9.Wei G, Cosman P, Berry CC, Zhaoyang F, Schafer WR. Biomedical Engineering IEEE Transactions on. 2004;51:1811. doi: 10.1109/TBME.2004.831532. [DOI] [PubMed] [Google Scholar]
- 10.Richter PR, Schuster M, Wagner H, Lebert M, Häder DP. Journal of plant physiology. 2002;159:181. doi: 10.1078/0176-1617-00605. [DOI] [PubMed] [Google Scholar]
- 11.Waggoner LE, Zhou GT, Schafer RW, Schafer WR. Neuron. 1998;21:203. doi: 10.1016/s0896-6273(00)80527-9. [DOI] [PubMed] [Google Scholar]
- 12.Su TW, Erlinger A, Tseng D, Ozcan A. Analytical Chemistry. 2010;82:8307. doi: 10.1021/ac101845q. [DOI] [PMC free article] [PubMed] [Google Scholar]
- 13.Ahmed H, Häder DP. Journal of Applied Phycology. 2010;22:785. [Google Scholar]
- 14.Breslauer DN, Maamari RN, Switz NA, Lam WA, Fletcher DA. PLoS ONE. 2009;4:e6320. doi: 10.1371/journal.pone.0006320. [DOI] [PMC free article] [PubMed] [Google Scholar]
- 15.Cui X, Lee LM, Heng X, Zhong W, Sternberg PW, Psaltis D, Yang C. Proceedings of the National Academy of Sciences. 2008;105:10670. doi: 10.1073/pnas.0804612105. [DOI] [PMC free article] [PubMed] [Google Scholar]
- 16.Zheng G, Lee SA, Yang S, Yang C. Lab on a Chip. 2010;10:3125. doi: 10.1039/c0lc00213e. [DOI] [PubMed] [Google Scholar]
- 17.Zheng G, Lee SA, Antebi Y, Elowitz MB, Yang C. Proceedings of the National Academy of Sciences. 2011;108:16889. doi: 10.1073/pnas.1110681108. [DOI] [PMC free article] [PubMed] [Google Scholar]
- 18.Farsiu S, Robinson M, Elad M, Milanfar P. IEEE Transactions on Image Processing. 2004;13:1327. doi: 10.1109/tip.2004.834669. [DOI] [PubMed] [Google Scholar]
- 19.Sung Cheol P, Min Kyu P, Moon Gi K. Signal Processing Magazine, IEEE. 2003:20, 21. [Google Scholar]
- 20.Ascoli C, Barbi M, Frediani C, Petracchi D. Biophysical journal. 1978;24:601. doi: 10.1016/S0006-3495(78)85407-1. [DOI] [PMC free article] [PubMed] [Google Scholar]
- 21.Cramer M, Myers J. Archives of Microbiology. 1952;17:384. [Google Scholar]
- 22.Lee SA, Leitao R, Zheng G, Yang S, Rodriguez A, Yang C. PLoS ONE. 2011;6:e26127. doi: 10.1371/journal.pone.0026127. [DOI] [PMC free article] [PubMed] [Google Scholar]
- 23.Ross G. Journal of clinical pathology. 1952;5:250. doi: 10.1136/jcp.5.3.250. [DOI] [PMC free article] [PubMed] [Google Scholar]
- 24.Aoyama K, Iwahori K, Miyata N. Mutation Research/Genetic Toxicology and Environmental Mutagenesis. 2003;538:155. doi: 10.1016/s1383-5718(03)00113-x. [DOI] [PubMed] [Google Scholar]
- 25.Ozasa K, Lee J, Song S, Hara M, Maeda M. Lab on a Chip. 2011;11:1933. doi: 10.1039/c0lc00719f. [DOI] [PubMed] [Google Scholar]
Associated Data
This section collects any data citations, data availability statements, or supplementary materials included in this article.


