Abstract
In the presence of magnesium, enolase catalyzes the dehydration of 2-phospho-D-glycerate (PGA) to phosphoenolpyruvate (PEP) in glycolysis and the reverse reaction in gluconeogensis at comparable rates. The structure of human neuron specific enolase (hNSE) crystals soaked in PGA showed that the enzyme is active in the crystals and produced PEP; conversely soaking in PEP produced PGA. Moreover, the hNSE dimer contains PGA bound in one subunit and PEP or a mixture of PEP and PGA in the other. Crystals soaked in a mixture of competitive inhibitors tartronate semialdehyde phosphate (TSP) and lactic acid phosphate (LAP) showed asymmetry with TSP binding in the same site as PGA and LAP in the PEP site. Kinetic studies showed that the inhibition of NSE by mixtures of TSP and LAP is stronger than predicted for independently acting inhibitors. This indicates that in some cases inhibition of homodimeric enzymes by mixtures of inhibitors (“heteroinhibition”) may offer advantages over single inhibitors.
Keywords: enolase, homodimer asymmetry, heteroinhibition, active site cooperativity
1. Introduction
Enzyme oligomerization appears to have diverse functions, of which two are well established. One is stabilization of folded structure, which was proposed for many proteins and is well documented for yeast enolase 1 [1]. Sometimes, the quaternary structure plays a role in cooperativity and/or allosteric regulation, as was first observed for oxygen binding by hemoglobin [2,3]. This function was later extensively analyzed in term of catalytic activity of several enzymes, as for instance E. coli aspartate transcarbamoylase [4]. More recently discovered is flip-flop catalysis, postulated in thiamin pyrophosphate-dependent enzymes. In this family of homodimeric enzymes two subunits alternatively catalyze half-reactions coupled so that while the first half-reaction proceeds in one subunit the second half-reaction takes place in the other subunit [5]. Yet another concept is that the subunits of oligomeric enzymes communicate so the energy of substrate binding in one subunit is transferred to the other and used to release product [6,7]. This feature should be most valuable for enzymes such as enolase that rapidly catalyze reactions in both the forward and reverse directions since such enzymes must strongly bind product. Dimers interacting in such a way must be asymmetric when substrate/product molecules are bound to them. They are likely to show negative cooperativity between subunits for binding of substrates or inhibitory substrate analogues.
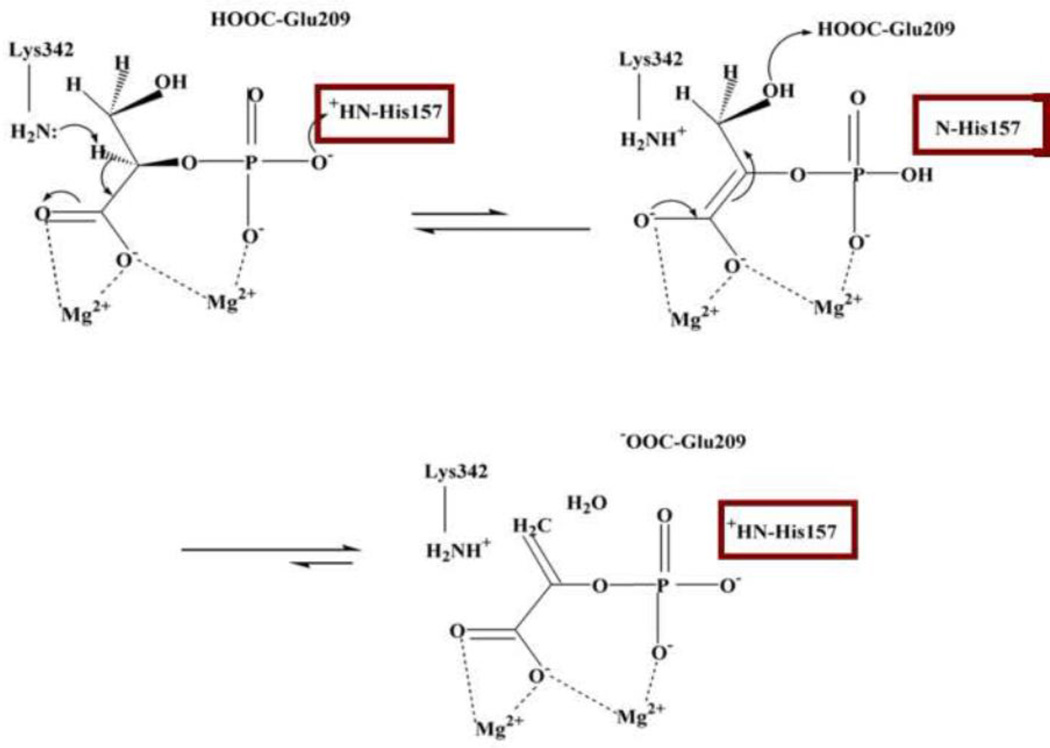
The mechanism of enolase is shown in Figure 1. It was originally proposed by Reed and coworkers and modified to include the role of His157; it is based on results from two laboratories [8,9]. The three crucial residues all function as acid/base systems. In the glycolytic direction of the enolase reaction, Lys345 abstracts a proton from C2 of PGA, Glu209, likely augmented by Glu166 and His370, protonates the hydroxyl at C3, while His157 protonates the phosphate moiety to produce electron withdrawing from C2 [9,10]. In the gluconeogenetic direction of catalysis, the roles of Lys342 and Glu209 are reversed while His157 keeps away from the phosphate. The catalytic loops positions change upon PGA binding from the “open” conformation to the “closed” conformation. In the complex with PEP, loop 155–159 is in a third conformation, referred to as “semi-closed” in which His157 does not directly contact the phosphate moiety but through a water molecule [9]. Enolase catalysis is also at least in part entatic as the PGA when bound to the enzyme is in a conformation which is different from that observed in the unbound state and which is likely of a higher energy [11].
Figure 1.
Mechanism of enolase. The hNSE amino acid numbering is used. We use “Glu209” for the Glu166, Glu209, His370 cluster surrounding the hydroxyl. In yeast enolase 1, His 157 is His159, Glu209 is Glu211, and Lys342 is Lys 345. The carboxylate carbon is C1, the phosphorylated carbon is C2 and the last one is C3.t
In vertebrate organisms three isozymes of enolase, expressed by different genes, are present. Enolase α is ubiquitous; enolase β is muscle specific, and enolase γ (NSE) is neuron specific. Sequence comparisons show 83% identity and 87% similarity for each pairing of the isozymes of human enolase. Tissue specific isozymes (β and γ) readily form mixed dimers with enolase α. Human NSE (hNSE) is a major brain protein that constitutes between 0.4 to 2.2% of the total soluble protein of brain, depending on region. In some neurons NSE accounts for 3–4% of total soluble protein, which led to common usage of NSE as a clinical marker for neuronal and neuroendocrine cells [12]. The reasons for such a high concentration of enolase in neurons are not known, though neurons depend entirely on glycolysis as the source of acetyl SCOA and hence energy [13]. In muscle cells, where the concentrations of all glycolytic enzymes are high, enolase is about 500 µM, while its substrate and product are at significantly lower concentrations: PGA 20 µM and PEP 65 µM [14].
A comparison of the sequences of the most studied enolase, yeast enolase 1, and human NSE shows that they are 62% identical, (73% similar) with two deletions which are present in all mammalian enolases. The first one is Ser142 - Pro143; the second deletion is Ser267 [15]. The structures are also very similar, the active site residues are conserved and the kinetic characteristics are very similar as well [16,17]. All known eukaryotic enolases form homodimers; some bacterial enolases are octameric. Here we present studies which focus on the role of the enolase dimer in catalysis.
2. Materials and Methods
2.1 Reagents
TSP and AEP were synthesized as described previously [18]. LAP (tricyclohexylammonium salt) was a gift from the late Finn Wold. Ultra-pure ammonium sulfate was from ICN Biomedicals, Inc. (Aurora, OH). PGA and PEP were trisodium salts and like all other chemicals were obtained from Sigma-Aldrich (St. Louis, MO).
2.2 Protein expression and purification
Recombinant His-tagged human neuron specific (γ) enolase, referred to as hNSE in this work, was expressed in E. coli, purified and crystallized as previously described [16]. In brief, the cells were grown in LB with 100 µg/ml of ampicillin at 37°C to an A600 of 0.6 followed by induction with 0.3 mM IPTG. After induction, the cells were shaken at 37°C for three hours and then harvested. Pelleted cells were lysed by sonication and clarified by centrifugation. The protein was purified by His-tag affinity chromatography using a Ni-NTA Sepharose column (Qiagen) followed by gradient elution (0.0–0.25 M NaCl) in 0.01 ionic strength Tris-HCl, pH 8.5 from a 0.5 × 5 cm MonoQ column. Peak fractions were subjected to an ammonium sulfate fractionation (50–70% saturation). After dialysis, protein was concentrated to 10 mg/ml, this was used for crystallization.
2.3 Crystal growth, soaking and structure determination
The hNSE crystals were grown from 20% (w/v %) PEG 4K solutions, 200 mM MgCl2, and 0.1 M Tris-HCl buffer at pH 8.5 as previously reported [16]. These crystals are large plates, usually 0.5 × 0.3 × 0.05 mm. They typically diffract to 1.3–1.5 Å. These crystals were soaked in artificial mother liquor containing 2 mM PGA. Crystals were subjected to four different soaking times: 5 minutes, one and half days, 10 days and 30 days. To confirm catalytic activity of enolase in crystals native hNSE crystals were soaked in artificial mother liquor containing 2mM PEP for 5 minutes. In yet another experiment we replaced the mother liquor with one in which most of the magnesium ions were replaced with sodium, but the crystal quality deteriorated to the extent that data could not be collected.
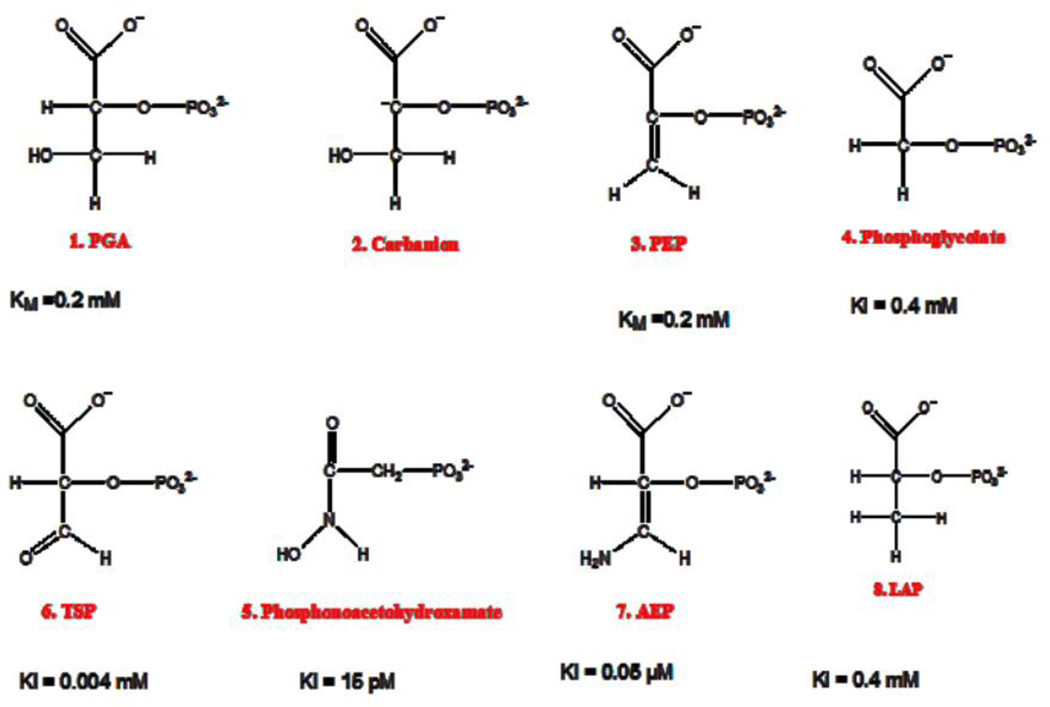
To generate the heteroinhibitory complex, hNSE was co-crystallized with 50 mM LAP from 19% (w/v %) PEG 4K solutions, 200 mM MgCl2, and 0.1 M Tris-HCl buffer at pH 8.5. A hNSE∙LAP complex crystal was transferred into a cryo-solution, which contained 0.5 µl of a solution from mother liquor with 0.06 mM TSP and 15% ethylene glycol, and the crystal was soaked for 5 min. The LAP and TSP concentrations used are derived from their published KI values, shown in Figure 4 [19].
Figure 4.
Skeletal structures of 1) 2-phospho-D-glycerate (PGA); 2) carbanion considered the transition state; 3) phosphoenolpyruvate (PEP); inhibitors: 4) 2-phosphoglycolate (PG); 5) phosphonoacetohydroxamate; 6) D-tartronic semialdehyde phosphate (TSP); 7) 3-aminoenolpyruvate (AEP); 8) lactic acid phosphate (LAP). KI values are taken from reference [19]. In the structures the top carbon atom is carbon-1.
The crystals were flash frozen in liquid nitrogen. X-ray diffraction data were collected at the 22BM beamline or 22ID beamline (SER-CAT) at the Advanced Photon Source in the Argonne National Laboratory and processed with the HKL2000 software [20]. The experiment statistics are presented in Table 1. The structural model was derived from the structure of the inhibitory complex of NSE with phosphate and fluoride [21], PDB entry 2AKZ. It was rebuilt with the Turbo-Frodo interactive graphic software [22] and refined with the CNS software [23] in an iterative fashion. Subsequently, the structures were refined using SHELXL [24]. The geometry of the final models was verified using PROCHECK [25]. The superpositions of protein models were obtained using the LSQKAB program from the CCP4 package [26]. All figures were generated using Turbo-Frodo or Pymol [27].
Table 1.
Crystallographic Data and Refinement Statistics for hNSE Complexes
| Crystal Soaking | PGA 5 min |
PGA 40 hours |
PGA 10 days |
PGA 30 days |
PEP 5 min |
TSP/LAP 5 min TSP |
|
|---|---|---|---|---|---|---|---|
| x-ray source | 22ID | 22BM | 22BM | 22BM | 22ID | 22ID | |
| Wavelength (Å) | 1.0000 | 0.99997 | 1.0000 | 1.0000 | 1.0000 | 0.97911 | |
| Space group | P21212 | P21212 | P21212 | P21212 | P21212 | P21212 | |
| Unit cell dimensions a | a (Å) | 114.88 | 105.71 | 109.60 | 110.56 | 114.45 | 114.45 |
| b (Å) | 119.86 | 118.62 | 119.73 | 119.21 | 119.82 | 119.81 | |
| c (Å) | 68.17 | 67.58 | 68.04 | 68.13 | 66.14 | 68.21 | |
| Mosaicity (degree) | 0.85 | 0.50 | 0.44 | 0.70 | 0.75 | 0.61 | |
| Resolution range (Å) (outer shell)a |
50.00-1.50 (1.55-1.50) |
50.00-1.41 (1.46-1.41) |
50.00-1.55 (1.61-1.55) |
50.00-2.10 (2.18-2.10) |
50.00-1.40 (1.45-1.40) |
50.00-1.42 (1.47-1.42) |
|
| Completeness (%) | 87.5 (41.7) | 94.3 (57.5) | 87.5 (49.5) | 89.8 (47.3) | 84.6 (51.0) | 94.7 (72.8) | |
| Total linear R-mergeb Rejections in merging |
0.084 (0.347) 0.96% |
0.067(0.554) 0.03% |
0.053(0.262) 0.90% |
0.058(0.161) 1.84% |
0.097(0.791) 0.75% |
0.063(0.777) 0.60% |
|
| Number of reflections with (|F|/σ|F|>0) in SHELX refinement |
117883 | 144834 | 106637 | 44629 | 131245 | 150984 | |
| R-valuec | {13.95} | 20.78{11.92} | 20.25{13.69} | 22.47 | {14.30} | 19.02{11.18} | |
| Rfree (5.0% of reflection)d | {20.38} | 22.29{18.06} | 22.43{20.68} | 26.90 | {22.00} | 20.57{14.43} | |
| Occupancies of two Conformations of His157 at Subunit B | |||||||
| Semi-closed | 0.26 | 0.39 | 0.61 | 0.69 | 0.50 | 1 | |
| Closed | 0.74 | 0.61 | 0.39 | 0.31 | 0.50 | 0 | |
| Dominant Ligand in the Active Site | |||||||
| Subunit A | PGA | PGA | PGA | PGA | PGA | TSP | |
| Subunit B | PEP | PEP | PGA | PEP | PEP | LAP | |
| PDB entry | 3UCC | 3UCD | 3UJE | 3UGF | 3UJR | 3UJS | |
Values in parentheses are for the outermost resolution shell, values in brackets are for the SHELX refinements with anisotropic B factors.
Rmerge = (∑h|Ih- <I>|)/(∑hIh).
R = (∑h|Fobs - Fcal|)/(∑hFobs).
Rfree = crystallographic R-factor for test set.
2.4 Kinetic studies
Enzyme activity was assayed as described by Lee and Nowak [28]. The assay mixture consisted of 50 mM Tris-HCl (pH 7.5), 2 mM PGA, 1 mM MgCl2, 50 mM KCl, and 0.01 mM EDTA in 1 ml and the reactions were measured at room temperature (22°C). The activity is defined as the change in absorbance at 230 nm (due to PEP formation) per minute. All measurements were carried out within one day using the same protein solution.
For inhibition studies with TSP and LAP, the reaction mixture consisted of 50 mM Tris-HCI (pH 7.5), 2 mM PGA, 1mM MgCl2, 50 mM KCI, 0.01 mM EDTA and varying concentrations of inhibitors. The activity measurements (ΔOD230 min−1) were performed at room temperature, each after addition of approximately 3 micrograms of enzyme. Due to small amounts of LAP available, data are limited. Four measurements were carried out: no inhibitor, with only TSP, with only LAP, and with TSP/LAP mixtures.
3. Results
3.1 Complexes with the substrate/product
hNSE crystallizes with a dimer present in the asymmetric part of the unit cell; its subunits are referred as A and B. The identity of ligands bound in the active sites of the complexes studied, soaking times and the crystallographic data are listed in Table 1. Almost all reported structures were at a high resolution, between 1.4 – 1.55 Å; the exception was the crystal soaked with PGA for 30 days, for which the data were of lower resolution, 2.1 Å, likely due to the longer soaking time. In general, the electron density was observed for the same parts of the model as reported previously for native crystals and the inhibitory complex with fluoride [16, 21].
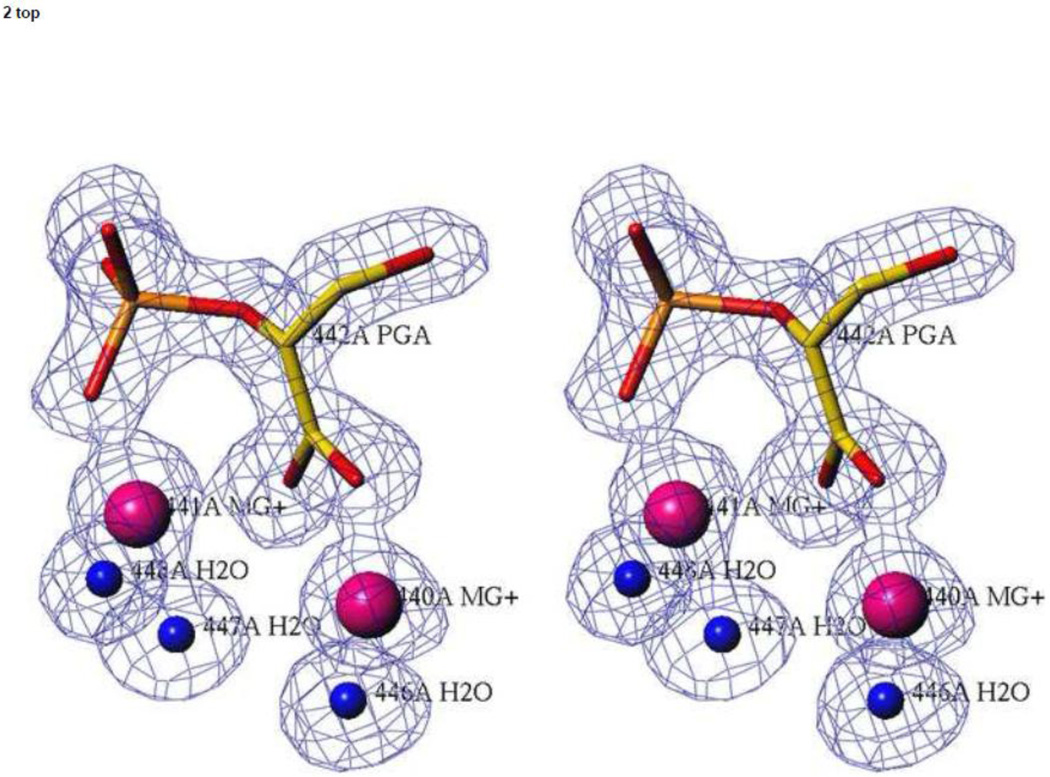
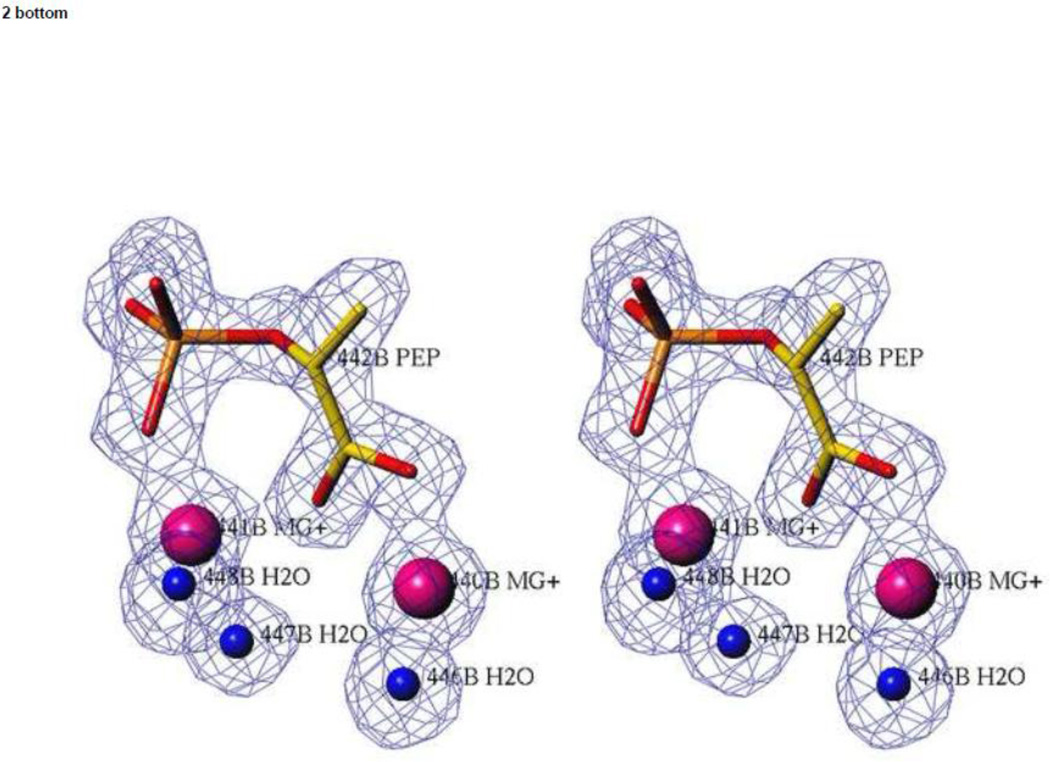
In all structures of hNSE crystals soaked with PGA or PEP, the density in the active site of subunit A corresponds very well to that expected for PGA as there is a prominent lobe for the hydroxyl moiety. In contrast, in crystals soaked for 30 days, no density corresponding to the hydroxyl moiety was observed in subunit B (Figure 2), indicating that PEP is the dominant ligand in subunit B. Also, occupancy of the closed conformation in subunit B is clearly much lower than that of the main, semi-closed conformer (Table 1). Since there is well-established correlation between the loop conformation and the bound ligand (see the Discussion) this is consistent with the dominant ligand being PEP. Thus, we refer to the crystal soaked for the longest time with 2mM PGA as the model of the heterosubstrate complex, (hNSE•2Mg2+•PGA)(hNSE•2Mg2+•PEP).
Figure 2.
The active sites in the catalytic hNSE complex. Stereoviews of electron density were calculated with Fo-Fc coefficients for a model in which the ligands shown in the picture were omitted. The contouring is at a 3.0 σ level. Data at 1.4 Å resolution were used. Upper panel: subunit A in which a PGA molecule is present. Lower panel: subunit B in which a PEP molecule is the dominant ligand.
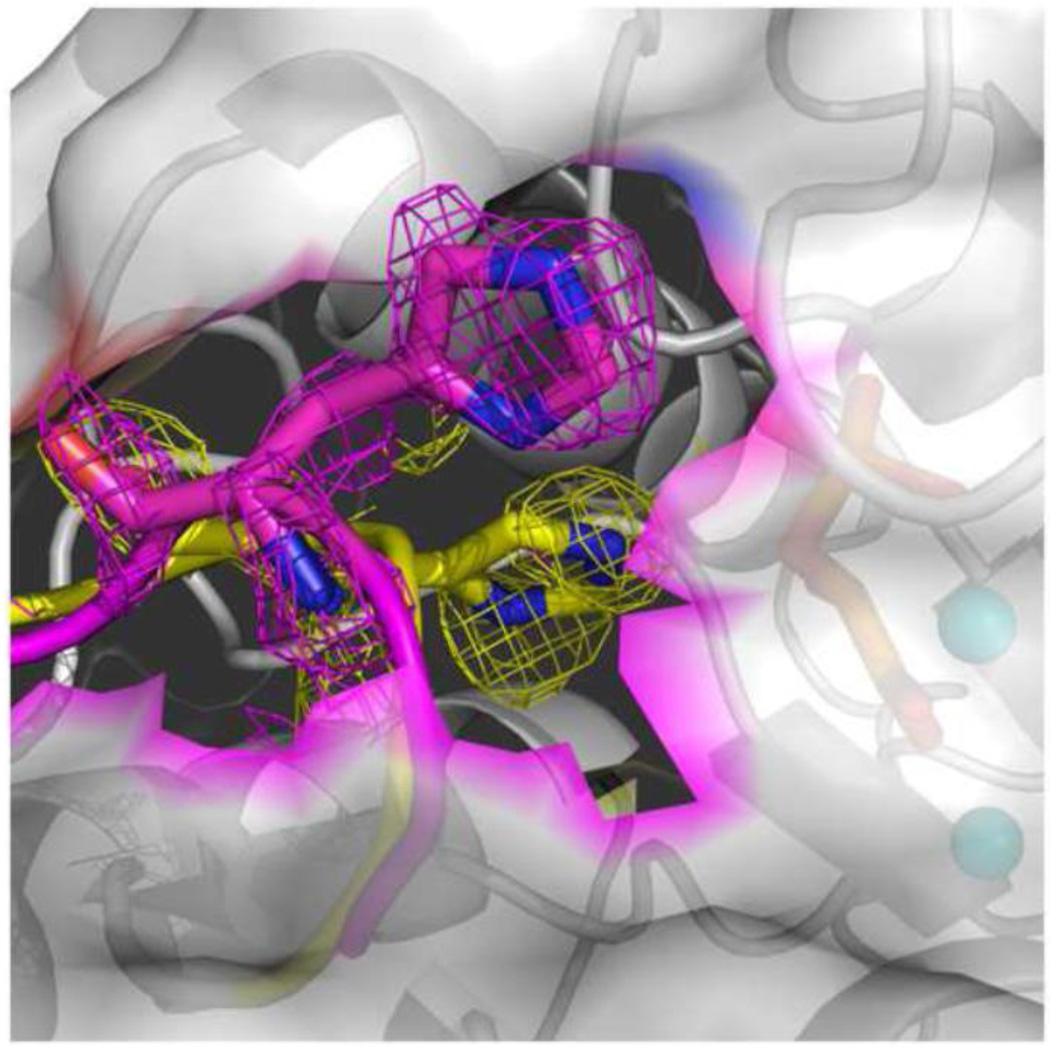
The crystal structure determined from soaking the crystal in PGA for five minutes is referred to as the (hNSE•2Mg2+•PGA)2 complex, since predominantly PGA was observed bound in both subunits (not shown). In a separate soaking experiment in which PEP rather than PGA was used, subunit A still shows a strong preference for binding PGA instead of PEP, while a mixture of PEP/PGA was observed in subunit B (not shown). In all crystals, loop 155–159 in subunit A is in the closed conformation and the ligand bound is PGA. In contrast, when a mixture of ligands is present in subunit B, loop 155–159 is disordered between the semi-closed and closed conformations as shown in Figure 3. The occupancies of the two conformations in all structures presented were refined within the SHELX software and are listed in Table 1. As the soaking time increased, the occupancies of semi-closed conformations in subunit B become higher and those of the closed conformations lower. The conformation of loop 155–159 and the position of His157 correlate with the ligand bound in the active site: PGA - closed loop (always observed in subunit A) and PEP - semi-closed loop (observed only in subunit B).
Figure 3.
Two conformations of loop 155–159 in subunit B in the hNSE complex with PGA/PEP. The yellow model and map denotes the closed conformation, pink the semi-closed conformation. The alternative positions of the side chain of His157 can easily be distinguished. Electron density is from the final omit map with Fo-Fc coefficients; the contouring level is at a 0.8 σ level.
It is also apparent from these experiments that hNSE is active in the crystals although the equilibration is slow. The hNSE crystallization conditions are inhibitory in part due to the high Mg2+ concentration [16].
3.2 Inhibition studies
Correlation between PGA and PEP binding observed in the two subunits suggested that combination of other ligands may also exhibit binding cooperativity and asymmetry resulting from interactions between otherwise identical binding sites. Several known inhibitors of enolase, together with their Ki values, are shown in Figure 4. The two major factors that differentiate the substrate and product are: the hybridization at carbon-2 (sp3 in PGA, sp2 in PEP) and the presence of oxygen, or a hydrogen bonding function in general, at carbon-3 (present in PGA, absent in PEP). The inhibitors in Fig. 4 do not match both features. AEP for instance is sp2 and has a hydrogen bond donating function; LAP is reversed: sp3 and no hydrogen bonding moiety at carbon-3.
Our initial selection of inhibitors was TSP and PG. This selection was based on the observation that in hNSE crystals soaked in TSP one of the active sites (the one that binds PGA) contained TSP while the other (that binds PEP) apparently contained PG (not shown). Extensive study of hNSE activity inhibition by mixtures of TSP and PG, however, showed no cooperativity whatsoever. In the meantime, we revisited the structure of the presumed (hNSE•2Mg2+•TSP)(hNSE•2Mg2+•PG) complex. Although TSP is not stable in solution for prolonged times, we could not propose a chemistry leading from TSP to PG. Eventually, we came up with the following explanation: TSP is a pseudo-substrate for enolase, which removes the proton from its carbon-2 [18, 29]. The second part of the reaction, hydroxyl removal, cannot follow since the oxygen at carbon-3 is connected by a double bond. Thus deprotonated TSP sits in the active site and can pick up a proton not only back from the enzyme but also from the solvent resulting in its racemization. We surmise that the PGA binding (site in subunit A) is stereospecific and binds only the original D-TSP. However the PEP binding site (subunit B) apparently binds both enantiomers of TSP with similar affinity. This leads to the disorder of the carbon-3 position and poor density which we initially misinterpreted as conversion of TSP to PG. Indeed at low contouring level the electron density supports this explanation. It was also observed previously that enolase catalyzes proton exchange with solvent at C-2 of PG [29].
A combination of TSP and AEP was tried next and activity measurements showed no cooperativity between inhibittors. However, AEP rapidly undergoes hydrolysis to TSP in diluted solutions (AEP is synthesized from TSP by condensing it with ammonia) [18]. It is possible that inhibition of enolase by AEP is actually always heteroinhibition by mixtures of TSP and AEP. TSP and AEP cannot be distinguished by protein crystallography.
Finally, a combination of D-lactic acid phosphate (LAP, in Fig. 4) and TSP was tried. Due to small amounts of LAP available (it was synthesized in the Finn Wold laboratory over fifty years ago), the data are limited, they are given in Table 2. The calculated ratio between measured velocities and those predicted by the equation 1/Vab’=1/VA+1/VB-1/V0 was used as a measure of cooperativity of the inhibitors [30]. In this equation, VAB’ is the theoretical reaction rate in the presence of two inhibitors, but no interaction or cooperativity between sites, VAB is the actual rate with both inhibitors present, V0 is the rate with no inhibitors, VA the rate observed in the presence of one inhibitor and VB the rate with the other inhibitor. Deviations of the ratio VAB/VAB’ from 1.0 indicate cooperativity. In our study, VAB/VAB’ =1.32, which indicates a catalytically significant interaction between the binding of TSP and LAP. For the TSP/PG and TSP/AEG systems the values of VAB/VAB’ were below 1.05. Although these results were only suggestive by themselves, based on them, crystals of hNSE were soaked in a mixture of TSP and LAP and structural data confirmed our hypothesis of subunit interaction.
Table 2.
Enolase activity in the presence of LAP/TSP inhibitors measured as ΔOD230 min−1
| LAP (mM) | TSP (mM) | activity |
|---|---|---|
| 0 | 0 | 0.323 |
| 0 | 0.004 | 0.176 |
| 0.4 | 0 | 0.286 |
| 0.4 | 0.004 | 0.124 |
3.3 Complex with two inhibitors TSP/LAP
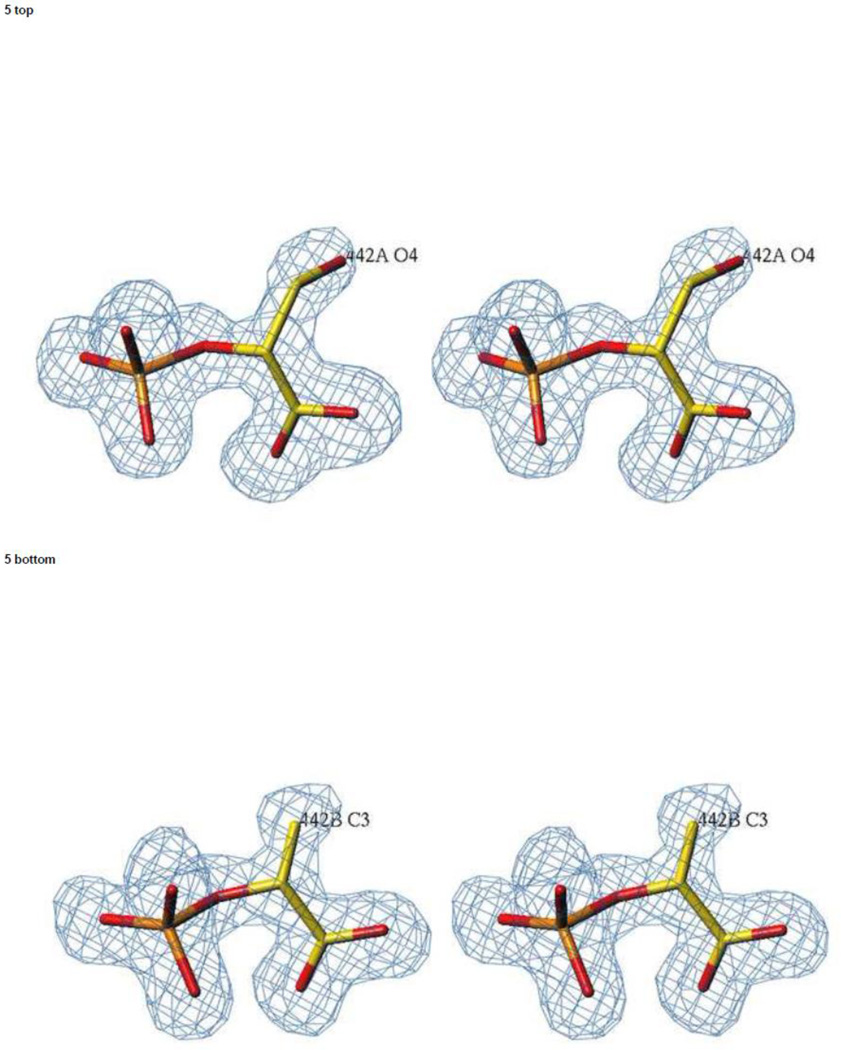
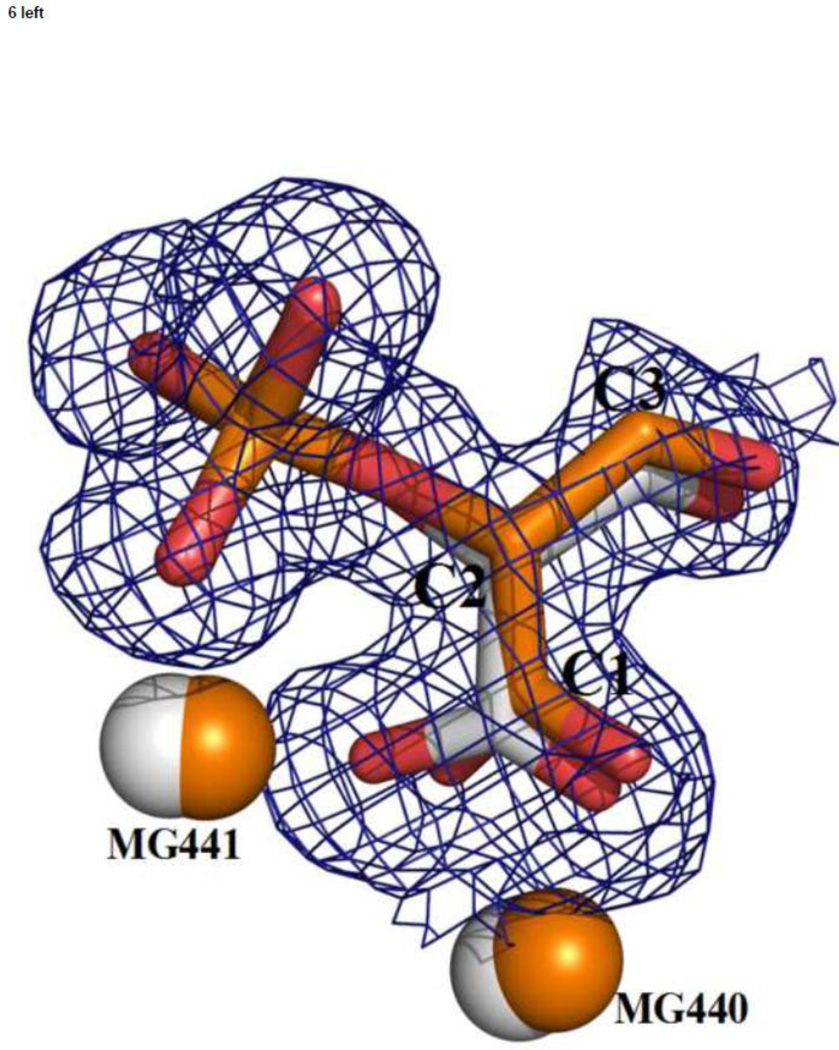
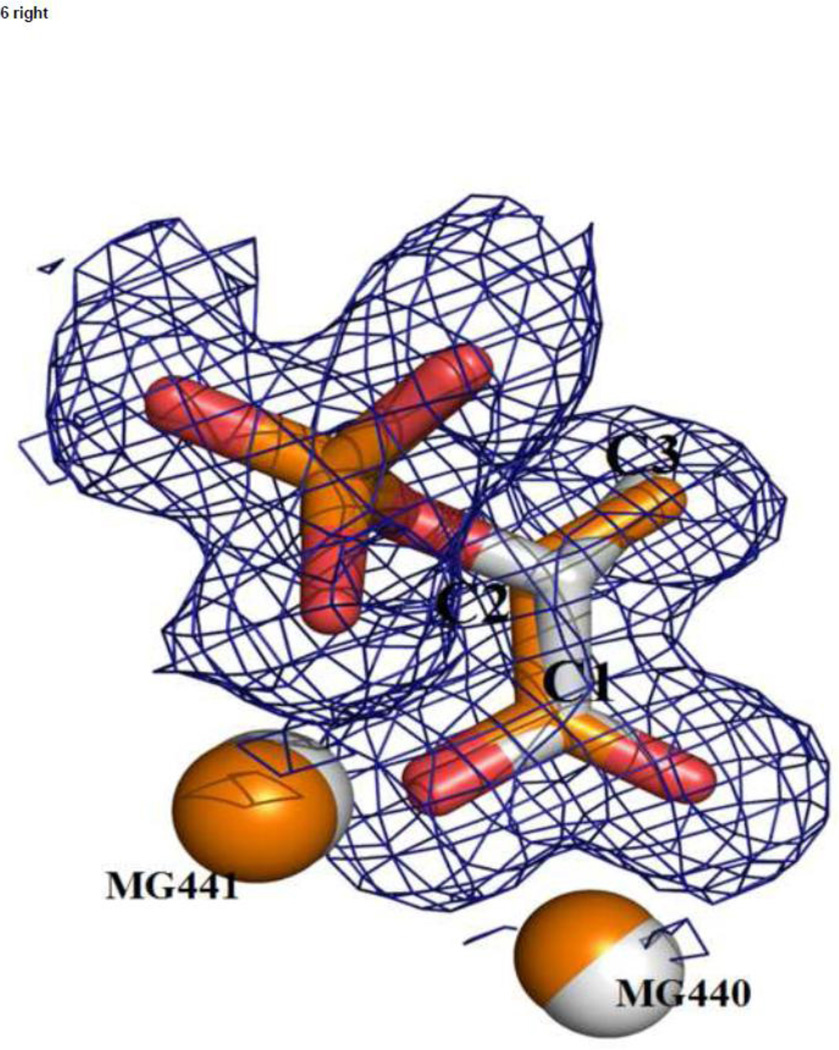
In the structure of the TSP/LAP complex, TSP was observed binding at the same site as PGA (subunit A) and LAP at the same site as PEP (subunit B) as shown in Figure 5. That structure is called the “heteroinhibitory” complex, (hNSE•2Mg2+•TSP)(hNSE•2Mg2+•LAP). To our knowledge, this is the first report of a crystal structure in which a homodimer forms an asymmetric complex with two different inhibitors. A superposition of the heterosubstrate and heteroinhibitory complexes, based on the position of the Cα atoms, shows a remarkable similarity between the binding of the inhibitors and substrate/product (Figure 6).
Figure 5.
The ligands in the heteroinhibitory hNSE complex. Stereoviews of electron density were calculated with Fo-Fc coefficients for a model in which the ligands present in the picture were omitted. The contouring is at a 3.0 σ level. Data at 1.4 Å resolution were used. Upper panel: subunit A in which a TSP molecule is present (it binds PGA in the catalytic complex). The orientation is selected to emphasize the presence of oxygen at carbon-3, the one at the top. Lower panel: subunit B in which a LAP molecule is the dominant ligand. There is no density for an oxygen atom at carbon 3 indicating the identity of LAP.
Figure 6.
A superposition of the catalytic and inhibitory complexes (based on Cα positions) shows how well the inhibitor molecules match those of the substrate/product; (left) TSP (in silver, lighter color) and PGA (in orange, darker color); (right) LAP (in silver, lighter color) and PEP (in orange, darker color). Electron density is from the heteroinhibitory complex.
It should be pointed out that the asymmetric complex was prepared by soaking the LAP complex in a solution containing LAP+TSP so ligand exchange upon soaking took place in subunit A, which has the catalytic loops in the closed position, not in subunit B in which the loops are readily movable. Thus the observed inhibitors’ separation in the dimer cannot be attributed to differences in the active sites’ accessibility.
3.4 Dimer asymmetry
The symmetry of the hNSE dimer in the three complexes was checked by least-squares superpositions of subunit A and subunit B. The calculations, based on Cα atom positions, yielded rms. values of 0.47 Å, 0.53 Å and 0.24 Å for (hNSE•2Mg2+•PGA)(hNSE•2Mg2+•PEP), (hNSE•2Mg2+•TSP)(hNSE•2Mg2+•LAP) and (hNSE•2Mg2+•PGA)2 complexes, respectively. In both mixed hNSE complexes (with PGA/PEP and TSP/LAP) two loops are in different positions. The first is region 155–159, whose center is His157 where the difference in positions reaches 3.5 Å in the PGA•PEP complex and 3.8 Å in the TSP•LAP complex. The second loop is region 259–266 where the maximum difference in Cα positions is 1.0 Å in the PGA•PEP complex and 1.8 Å in the TSP•LAP complex. When loop 155–159 was omitted from the superposition calculations, the average rms. distance decreased to 0.41 Å for the PGA/PEP complex, and to 0.46 Å for the TSP/LAP complex structure. When loop 259–266 was omitted as well, the average rms. distance decreased to 0.39 Å for the PGA/PEP complex and to 0.37 Å for the TSP/LAP complex.
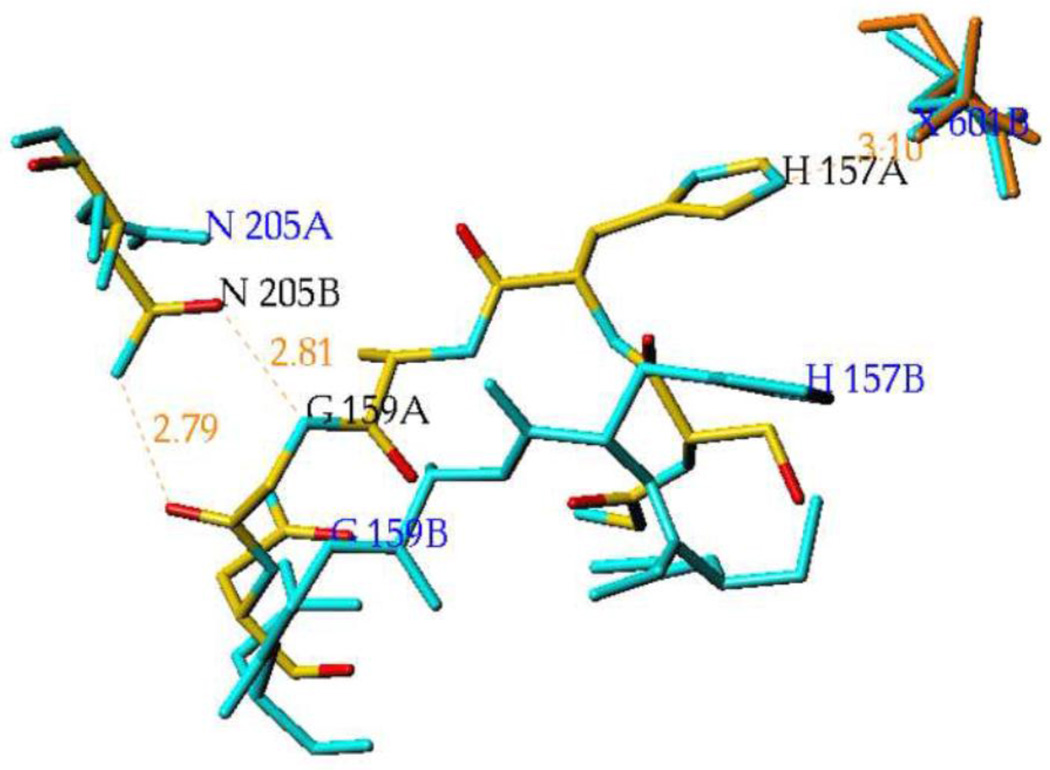
The dimer asymmetry in both mixed complexes also occurs at the subunit interface where the side chain of Asn205 in subunit B forms two hydrogen bonds with Gly159 peptide in subunit A, while there are no hydrogen bonds between Asn205 in subunit A and Gly159 peptide in subunit B. In the PGA/PEP complex, the distances are 3.0 Å and 3.1 Å between Asn205 in subunit B and Gly159 peptide in subunit A, indicating the formation of hydrogen bonds, while the analogous distances between Asn205 in subunit A and Gly159 peptide in subunit B are 4.1 Å and 3.8 Å indicating the absence of hydrogen bonding. In the TSP/LAP complex, the distances are both 2.8 Å between Asn205 in subunit B and Gly159 peptide in subunit A, and 9.3 Å and 6.3 Å between Asn205 in subunit A and Gly159 peptide in subunit B. These hydrogen bonds stabilize the closed conformation of the loop containing catalytic His157 and allow direct His157-phosphate interaction (Figure 7). In the (hNSE•2Mg2+•PGA)2 complex the subunit interface is symmetric and the side chain of Asn205 forms two hydrogen bonds with Gly159 peptide in both subunits.
Figure 7.
A superposition of the heteroinhibitory complex on itself with subunit B fitted to subunit A (based on Cα positions) displays differences at the subunits interface. In atom colors, with black labels, is shown the subunits interface with His157A hydrogen bonded to TSP (in orange) and Gly159A forming two intersubunits hydrogen bonds to Asn205B. In cyan, with blue labels, are shown the corresponding residues in the vicinity of LAP (X601B). His157B does not form a hydrogen bond to LAP and Gly159B does not interact with Asn205A. Thus the two observed positions of the intersubunit Asn205/Gly159 switch affect the position of His157 and apparently the affinity for TSP/LAP binding.
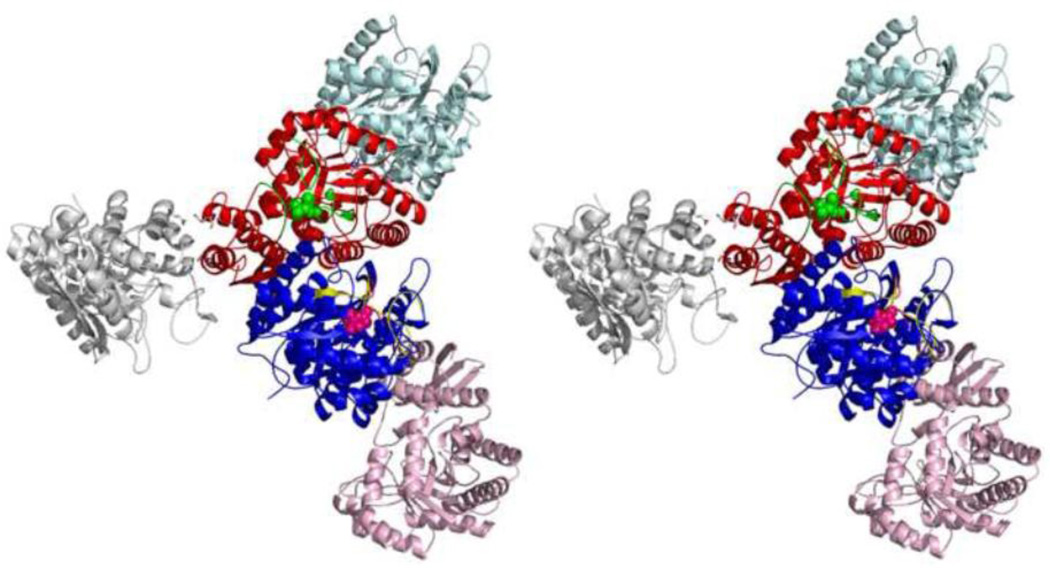
Stabilization of the asymmetric structure is connected to the asymmetric environment of the dimer. Subunit A forms contacts with its neighbors which involve its catalytic loops. In contrast the loops in subunit B face only solvent and do not form contacts with neighbors as shown in Figure 8.
Figure 8.
Stereoview of the crystal lattice environment of the hNSE molecule, composed of subunits A and B. Subunit A (in red with PGA in green) forms contacts which stabilize Gly159A-Asn205B bonding and thus preference for PGA. Subunit B (in blue with PEP in purple) forms only crystal contacts which do not involve the catalytic loops (shown in yellow, right above PEP).
Protein Data Bank accession numbers
The atomic coordinates of the complexes of enolase with PGA and PEP have been deposited with the Protein Data Bank with accession codes 3UCC, 3UCD, 3UJE, 3UJF, and 3UJR with the soaking conditions listed in Table 1 and for the mixed inhibitory complex with TSP and LAP with code 3UJS.
4. Discussion
In general, observation of an asymmetric homodimer requires correlation between the dimer environment in a crystal and the asymmetry, otherwise disorder is present. This always raises the issue whether the asymmetry is present in a single molecule and is not an artifact induced by interactions with its neighbors in the crystal. For enolase, the same phenomenon, PGA binding in one subunit and PEP in the other, was observed with yeast enolase 1 which crystallizes in a different space group and have entirely different crystal packing. Thus the simplest explanation is that the subunits interact [9]. Further discussion is supporting this conclusion.
The structures reported here are consistent with data obtained in solution. At high PGA concentrations the symmetric complex (hNSE•Mg2•PGA)2 is initially observed, which is consistent with kinetic data showing that both subunits are simultaneously active [31]. Solution studies [32, 33] have shown that upon reaching equilibrium, the ratio of PGA/PEP bound to enolase is 1:1 and this is consistent with the observation of the asymmetric dimer (hNSE•2Mg2+•PGA)(hNSE•2Mg2+•PEP) after 30 days of crystal soaking, when presumably the equilibrium was approached.
The asymmetry of the interface is also conserved between hNSE and yeast enolase. The replacement of the Asn207 in yeast enolase 1 (corresponding to hNSE Asn205) with an alanine led to a mutant which had properties, especially the dependence of activity on Mg2+ concentration, similar to enolase variants with the histidine corresponding to His157 mutated [34].
Analysis of the dimer environment in the structures reported here shows that the catalytic loops in subunit A form crystal contacts which apparently stabilize the closed conformation. In contrast, the same loops of subunit B do not form any crystal contacts (Fig. 7). Furthermore, upon diffusing in substrates or inhibitors the loops of subunit B move up to 14 Å from the open conformation observed in native crystals to the closed conformation observed in the complexes. This large conformational change does not affect the crystal mosaicity; this would likely be observed if the crystal packing was altered in the process. In addition, native hNSE crystallizes as a highly asymmetric dimer containing a sulfate ion in the active site of subunit A, which is in the closed conformation, and subunit B with no ligand in the active site and in the open conformation [16]. The preference for the closed conformation in subunit A translates into the observed preference for PGA binding.
Subunit B communicates through the dimer interface with subunit A and shows a preference for PEP binding. The refinement of the PEP/PGA ratios based on ligands only is not doable because there is essentially one atom difference between them. However, the partial occupancies of the PGA in subunit B, can be inferred from occupancies of the closed conformation, which correlate with the bound ligand (see below). The occupancies diminish as the soaking time increases (Table 1) and the PGA/PEP ratio becomes lower. Nevertheless the PGA presence suggests that the coupling between subunits is fairly weak. Indeed there is no kinetic evidence for subunit cooperativity in enolase reaction [31]. The kinetic data reported here show, however, cooperativity of inhibitors. The complexes of hNSE or yeast enolase with strong inhibitors, a mixture of fluoride and phosphate ions or phosphonoacetohydroxamate, are quite symmetric [21, 35]. Since such inhibitory complexes likely mimic the transition state it is likely that the transition state is also symmetric.
The active sites of the heterosubstrate complex correspond to Michaelis complexes for glycolytic (PGA, subunit A) and gluconeogenetic (PEP, subunit B) directions. A comparison of the active sites, shown in Figure 3, confirms the findings from the analogous yeast enolase complex: there is a major difference in interaction between His157 and the phosphate. The distance between His157 and phosphate is 2.9 Å, with a proper geometry for a hydrogen bond, in the PGA subunit, and 6.4 Å in the PEP subunit. Complexes of low activity yeast enolase mutants with PGA and/or PEP confirm this correlation. In the E211Q•PEP complex the histidine corresponding to His157 is away from the phosphate, in E168E•PGA and K354A•PGA complexes the histidine hydrogen bonds to the phosphate [31, 36]. In wt yeast enolase complexes in which the active sites contain disordered PGA/PEP the histidine is also disordered [31, 32]. This variety of structures with very different crystal environments imply that the position of the imidazole(ium) of His157 is correlated with the bound ligand. This correlation strongly suggests that a crucial event preceding the proton abstraction from carbon-2 is the transfer of a proton from the imidazolium of His157 to the phosphate moiety, which affords additional electron withdrawing from carbon-2. Evidence for phosphate protonation during enolase turnover comes from the large shift observed by Brewer and Ellis [32] in the 31P NMR spectra of substrate and product bound to yeast enolase which cannot otherwise be explained.
The observed correlation between the position of His157 and the ligand present in the active site is consistent with the mechanism shown in scheme 1. Mutants of His159 of yeast enolase (equivalent to His157 in hNSE) have activity reduced by at least 2 orders of magnitude indicating its important role in catalysis [34,35]. The protonation state of His157 probably does not change upon completion of the catalytic cycle. This is not true for the two other acid/base catalysts, Lys342 and Glu209, whose protonation state is reversed upon conclusion of each turnover event and must re-equlibrate to continue catalysis. A recent study has shown that indeed the protonation states of these catalytic residues are essentially pH independent [38].
The absence of a third Mg2+ binding site, despite 0.2 M Mg2+ concentration in the mother liquor, provides a very strong support to the postulate that the inhibition of wild type enolase produced by high Mg2+ concentrations can be explained by mass action, rather than binding of a third, inhibitory Mg2+ ion [39].
Concluding remarks
The evidence presented here and that cited are most simply and directly interpreted in terms of interaction or “communication” or “cooperativity” between the two subunits upon substrate/product binding [9]. Observation of substrate/product binding by the dimer suggested that the positive cooperativity can perhaps extend to inhibitory substrate or product analogues. This hypothesis turned out to be true as the asymmetric inhibitory complex was obtained and limited kinetic data support a synergistic effect of inhibitory mixtures, schematically shown in Figure 9. Enolase is not a target for drug development in humans and is unlikely to become so in pathogens due to its high sequence conservation. So the cooperative inhibition, or heteroinhibition, of hNSE is only a proof of principle study which perhaps may find applications for drug target enzymes which exhibit strong cooperativity between subunits.
Figure 9.
Inhibition of an enzyme with negative cooperativity. a) Unliganded symmetric dimer. b) Symmetric inhibition, where a part of binding energy is used to disrupt interaction between subunits. c) Single site asymmetric inhibition. d) Asymmetric heteroinhibition targeting both active sites.
Highlights.
>Crystal structures of enolase, a dimeric enzyme, showed binding of its substrate in one subunit, the product in the other. > The structure of an analogous complex with two different inhibitors also showed asymmetric binding. > Kinetic studies confirmed synergy between the inhibitors. > This may be a paradigm for development of drugs targeting enzymes with subunit cooperativity.
Supplementary Material
Acknowledgements
This research was supported in part by NIH grant CA 76560.
Data were collected at the Southeast Regional Collaborative Access Team (SER-CAT) 22BM or 22ID beamlines at the Advanced Photon Source, Argonne National Laboratory. Supporting institutions may be found at www.ser-cat.org/members.html. Use of the Advanced Photon source was supported by the U.S. Department of Energy, Office of Basic Energy Sciences, under Contract No. W-31-109-Eng-38.
Abbreviations
- AEP
3-aminoenolpyruvate-2-phosphate
- hNSE
human neuron specific enolase
- IPTG
isopropyl β-D-1-thiogalactopyranoside
- LAP
D(+)lactic acid-2-phosphate
- NSE
neuron specific enolase
- PDB
Protein Data Bank
- PEG
polyethylene glycol
- PEP
Phosphoenolpyruvate
- PG
Phosphoglycolate
- PGA
2-phospho-D-glycerate
- TSP
D-tartronate semialdehyde-2-phosphate
Footnotes
Publisher's Disclaimer: This is a PDF file of an unedited manuscript that has been accepted for publication. As a service to our customers we are providing this early version of the manuscript. The manuscript will undergo copyediting, typesetting, and review of the resulting proof before it is published in its final citable form. Please note that during the production process errors may be discovered which could affect the content, and all legal disclaimers that apply to the journal pertain.
References
- 1.Brewer JM, Wampler JE. Int. J. Biol. Macromol. 2001;28:213–218. doi: 10.1016/s0141-8130(00)00168-9. [DOI] [PubMed] [Google Scholar]
- 2.Monod J, Wyman J, Changeux J-P. J. Mol. Biol. 1965;12:88–118. doi: 10.1016/s0022-2836(65)80285-6. [DOI] [PubMed] [Google Scholar]
- 3.Perutz MF. Q. Rev. Biophys. 1989;22:139–236. doi: 10.1017/s0033583500003826. [DOI] [PubMed] [Google Scholar]
- 4.Sakash JB, Chan RS, Tsuruta H, Kantrowitz ER. J. Biol. Chem. 2000;275:752–758. doi: 10.1074/jbc.275.2.752. [DOI] [PubMed] [Google Scholar]
- 5.Ciszak EM, Korotchkina LG, Dominiak PM, Sidhu S, Patel MS. J. Biol. Chem. 2003;278:21240–21246. doi: 10.1074/jbc.M300339200. [DOI] [PubMed] [Google Scholar]
- 6.Lazdunski M. Curr. Top. Cell. Regul. 1972;6:267–310. [Google Scholar]
- 7.Miller SM, Massey V, Williams CH, Ballou DP, Walsh CT. Biochemistry. 1991;30:2600–2612. doi: 10.1021/bi00224a006. [DOI] [PubMed] [Google Scholar]
- 8.Larsen TM, Wedekind JE, Rayment I, Reed GH. Biochemistry. 1996;35:4349–4358. doi: 10.1021/bi952859c. [DOI] [PubMed] [Google Scholar]
- 9.Zhang E, Brewer JM, Minor W, Carreira LA, Lebioda L. Biochemistry. 1997;36:12526–12534. doi: 10.1021/bi9712450. [DOI] [PubMed] [Google Scholar]
- 10.Brewer JM, Glover CVC, Holland MJ, Lebioda L. Biochim. Biophys. Acta. 1997;1340:88–96. doi: 10.1016/s0167-4838(97)00029-0. [DOI] [PubMed] [Google Scholar]
- 11.Lis T. Acta Crystallogr. 1985;C41:1578–1580. [Google Scholar]
- 12.Marangos PJ, Schmechel DE. Ann. Rev. Neurosci. 1987;10:269–295. doi: 10.1146/annurev.ne.10.030187.001413. [DOI] [PubMed] [Google Scholar]
- 13.Berg JM, Tymoczko JL, Stryer L. In: Biochemistry. 6th Ed. Freeman WH, editor. New York: 2007. p. 767. [Google Scholar]
- 14.Srivastava DK, Bernhard SA. Ann. Rev. Biophys. Chem. 1987;16:175–204. doi: 10.1146/annurev.bb.16.060187.001135. [DOI] [PubMed] [Google Scholar]
- 15.Brewer JM, Lebioda L. Advan. Biophys. Chem. 1997;6:111–141. [Google Scholar]
- 16.Chai G, Brewer JM, Lovelace LL, Aoki T, Minor W, Lebioda L. J. Mol. Biol. 2004;341:1015–1021. doi: 10.1016/j.jmb.2004.05.068. [DOI] [PubMed] [Google Scholar]
- 17.Lebioda L, Stec B, Brewer JM. J. Biol. Chem. 1989;264:3685–3693. doi: 10.2210/pdb2enl/pdb. [DOI] [PubMed] [Google Scholar]
- 18.Spring TG, Wold F. Biochemistry. 1971;10:4649–4654. doi: 10.1021/bi00801a009. [DOI] [PubMed] [Google Scholar]
- 19.Brewer JM. Crit. Rev. Biochem. 11:209–254. doi: 10.3109/10409238109108702. [DOI] [PubMed] [Google Scholar]
- 20.Otwinowski Z, Minor W. Methods Enzymol. 1997;276:307–326. doi: 10.1016/S0076-6879(97)76066-X. [DOI] [PubMed] [Google Scholar]
- 21.Qin J, Chai G, Brewer JM, Lovelace LL, Lebioda L. Biochemistry. 2006;45:793–800. doi: 10.1021/bi051558s. [DOI] [PMC free article] [PubMed] [Google Scholar]
- 22.Roussel A, Cambillau C. Vol. 86. Mountain View, CA: Silicon Graphics; 1991. [Google Scholar]
- 23.Brunger AT, Adams PD, Clore GM, Delano WL, Gros P, Grosse-Kunstleve RW, Jiang JS, Kuszewski J, Nilges M, Pannu NS, Read RJ, Rice LM, Simonson T, Warren GL. Acta Crystallogr. 1998;D54:905–921. doi: 10.1107/s0907444998003254. [DOI] [PubMed] [Google Scholar]
- 24.Sheldrick G, Schneider T. Methods Enzymol. 1997;277:319–343. [PubMed] [Google Scholar]
- 25.Laskowski RA, MacArthur MW, Moss DS, Thornton JM. J. Appl. Crystallogr. 1993;26:283–291. [Google Scholar]
- 26.Collaborative Computational Project Number 4. Acta Crystallogr. 1994;D50:760–763. [Google Scholar]
- 27.DeLano WL. De Lano Scientific. San Carlosm, CA, USA: 2002. http://www.pymol.org/ [Google Scholar]
- 28.Lee ME, Nowak T. Biochemistry. 1992;7:2172–2180. doi: 10.1021/bi00122a039. [DOI] [PubMed] [Google Scholar]
- 29.Stubbe J, Abeles RH. Biochemistry. 1980;19:5505–5512. doi: 10.1021/bi00565a007. [DOI] [PubMed] [Google Scholar]
- 30.Chou TC, Talaly P. J. Biol. Chem. 1977;252:6438–6442. [PubMed] [Google Scholar]
- 31.Sims PA, Menefee AL, Larsen TM, Mansoorabadi SO, Reed GH. J. Mol. Biol. 2005;355:322–431. doi: 10.1016/j.jmb.2005.10.050. [DOI] [PMC free article] [PubMed] [Google Scholar]
- 32.Brewer JM, Ellis PD. J. Inorg. Biochem. 1983;18:71–81. doi: 10.1016/0162-0134(83)85041-7. [DOI] [PubMed] [Google Scholar]
- 33.Burbaum JJ, Knowles JR. Biochemistry. 1989;28:9306–9317. doi: 10.1021/bi00450a010. [DOI] [PubMed] [Google Scholar]
- 34.Brewer JM, Glover CVC, Holland MJ, Lebioda L. J. Protein Chem. 2003;22:353–361. doi: 10.1023/a:1025390123761. [DOI] [PubMed] [Google Scholar]
- 35.Wedekind JE, Poyner RR, Reed GH, Rayment I. Biochemistry. 1994;33:9333–9342. doi: 10.1021/bi00197a038. [DOI] [PubMed] [Google Scholar]
- 36.Sims PA, Larsen TM, Poyner RR, Cleland WW, Reed GH. Biochemistry. 2003;42:8298–8306. doi: 10.1021/bi0346345. [DOI] [PubMed] [Google Scholar]
- 37.Lebioda L, Stec B. Biochemistry. 1991;30:2817–2822. doi: 10.1021/bi00225a012. [DOI] [PubMed] [Google Scholar]
- 38.Vinarov DA, Nowak T. Biochemistry. 1999;38:12138–12149. doi: 10.1021/bi990760q. [DOI] [PubMed] [Google Scholar]
- 39.Poyner RR, Cleland WW, Reed GH. Biochemistry. 2001;40:8009–8017. doi: 10.1021/bi0103922. [DOI] [PubMed] [Google Scholar]
Associated Data
This section collects any data citations, data availability statements, or supplementary materials included in this article.


