Abstract
The detection of single molecules in single cells has enabled biochemical analyses to be conducted with high sensitivity and high temporal resolution. In this work, detection of apoptosis was studied by single molecule fluorescence correlation spectroscopy (FCS) in single living cells. Caspase activity was assayed using a new red fluorogenic probe that avoids the spectral overlap of green fluorescent probes and cell autofluorescence. This new probe, 2SPBO-Casp, was synthesized by coupling a water-soluble Nile Blue derivative (2SBPO) to an aspartic acid residue. Upon apoptosis induction and caspase activation, free 2SBPO dye is shown to accumulate inside the cell after probe cleavage. In previous work in our lab, single molecule fluorescence in single apoptotic cells was detected 45 minutes after induction using a rhodamine 110 based probe. However, significant statistical analysis was needed to exclude false positives. The use of 2SBPO-Casp overcomes the autofluorescence problem and offers a steady fluorescence signal. In our single molecule FCS measurements, Ramos cells were determined apoptotic on the basis of their correlation coefficient value (R2). Cells that contain an R2 ≥ 0.65 were identified as highly correlated and therefore determined to be apoptotic. Single apoptotic cells identified by this manner were identified as early as 30 minutes after induction and the number of apoptotic cells reached a peak value at the 3rd hour, which is consistent with other techniques. Using single molecule techniques and a new apoptosis probe, the temporal dynamics were elucidated with better sensitivity and resolution than in previous studies.
Keywords: Fluorescence Correlation Spectroscopy, Red fluorescent probe, Apoptosis, Caspase, Single cell-analysis, Single molecule fluorescence
Introduction
The detection of apoptosis on the single-cell level is of vital importance to a range of biomedical problems. In cancer drug testing, for example, the initiation of apoptosis—and resistance to said initiation—is a critical factor in determining a compound’s efficacy in inducing cell death. In developmental biology, the study of apoptosis on the single-cell level can lead to new discoveries of tissue development and turnover of proliferating tissue. At the other extreme, unwanted apoptosis can lead to complications in heart failure. In this case blocking apoptosis is a primary strategy. Given that apoptosis induction is desired in some cases (cancer) and is to be prevented in others (heart disease), the study of apoptosis is of fundamental importance in chemistry and biology.1–6
The study of single cells yields insights into differences in temporal dynamics of the apoptosis process. In previous work in our group7 the temporal dynamics of individual apoptotic cells was shown to vary greatly. It was possible to identify and exclude cells that were naturally apoptotic in a cell culture from those that were induced via the receptor-mediated (CD95) apoptosis pathway. In addition, individual cell response to apoptosis agonists varies greatly even within a set of otherwise identical cells. In traditional single-cell analyses, the temporal resolution and sensitivity limit the measurement of apoptosis to the timescale of several hours. However, by increasing the sensitivity and temporal resolution, stochastic behaviors of individual cells can be elucidated.
There are many techniques in the apoptosis toolbox8–10, ranging from spectroscopic to electrochemical. Most analytical methods for apoptosis detection use specific hallmarks such as mitochondrial membrane potential11, Annexin-V conjugates12–13, or caspase probes7,14–15. Spectroscopic methods, using probes to assay various points of apoptosis, are easily adapted to single cell techniques using confocal or wide-field microscopy. In our own laboratory, combining single-cell techniques with single-molecule sensitivity has produced methods capable of increasing both sensitivity and temporal resolution in apoptosis measurements. Using fluorescence correlation spectroscopy (FCS), caspase activity can be assayed in individual cells noninvasively14,16. In work conducted by Saito and co-workers16, green fluorescent protein-red fluorescent protein constructs were used to detect cleavage of a linker between the two proteins by active caspases. The drawback of their approach is that transfection of a target cell line was required, however the Förster resonance energy transfer (FRET) mechanism employed resulted in lower background signal compared with green-fluorescent probes.
Signal intensity can be used in many cases for apoptotic cell detection. However, at the earliest times of detection (<1 hr) dye fluorescence is not sufficiently large enough to detect using standard epifluorescence or confocal microscopy without single-molecule sensitivity. FCS approaches allow the discernment of the smallest signals. One can also use photon counting histograms of single molecule fluorescence, although the hardware is almost identical for FCS use.
We have adapted FCS to study single-cell apoptosis using fluorogenic caspase probes in previous work using bis(L-Aspartic acid) rhodamine 110 (D2R). In healthy cells, the rhodamine-based probe freely entered the cell but did not fluoresce. Upon caspase activation, the probe was cleaved to release rhodamine 110. We used the FCS signatures of rhodamine 110 in the cytosol as a detection event14. Using FCS, the diffusion time and molecular brightness of rhodamine 110 served as an identifying parameter. Apoptosis was detected as early as 45 minutes after induction in cancer cells. However, rhodamine-110 based probes suffer from spectral overlap with cell autofluorescence, and several statistical steps were developed to exclude the influence of autofluorescent species from the FCS data. In addition, rhodamine 110 is not strongly retained in cells and can partition back into the extracellular medium once cleaved into the fluorescent form.
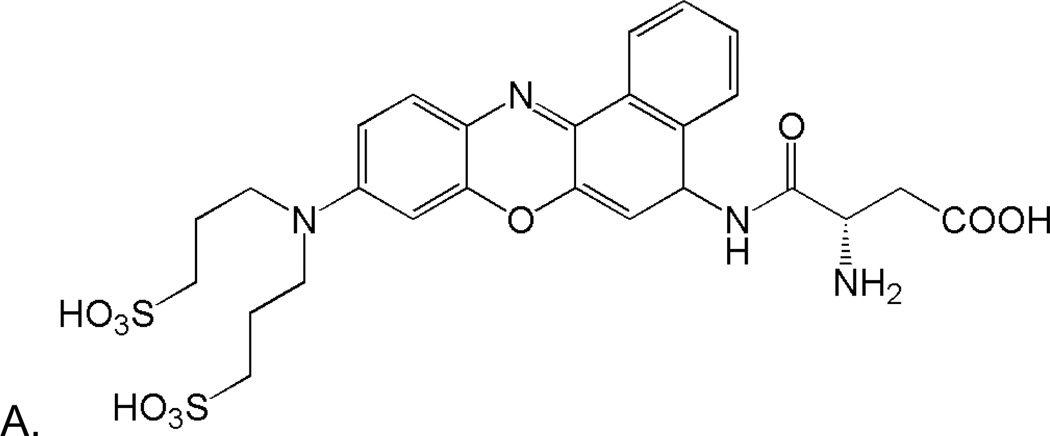
To compensate for these and other limitations of green-fluorescent caspase probes, we built upon previous work by Tung17–19 and Burgess20–22 using Nile Blue derivatives. These fluorophores have strong fluorescence in the red region of the visible spectrum and they may be derivatized for enhanced solubility and fluorogenic activity. The Nile Blue derivative, 9-di-3-sulfonyl-propyl-aminobenzo[a]phenoxazonium perchlorate (2SBPO), is water soluble and has a quantum yield that is suitable for single molecule spectroscopy. We have synthesized a 2SBPO derivative that is cleaved by caspases during apoptosis (2SBPO-Casp, Figure 1). The probe consists of a 2SBPO molecule coupled to L-aspartic acid that imparts caspase selectivity and fluorogenic activity. In this work, we discuss the use of this probe in single-molecule spectroscopy in individual cancer cells. The 2SBPO-Casp probe has been shown to be relatively immune to interference from autofluorescence. Excited by a simple diode laser, this new probe has proved to have higher sensitivity than earlier single molecule FCS studies using green-fluorescent probes. In addition, it is a single-wavelength system that does not require cell transfection or complicated sample preparation.
Figure 1.
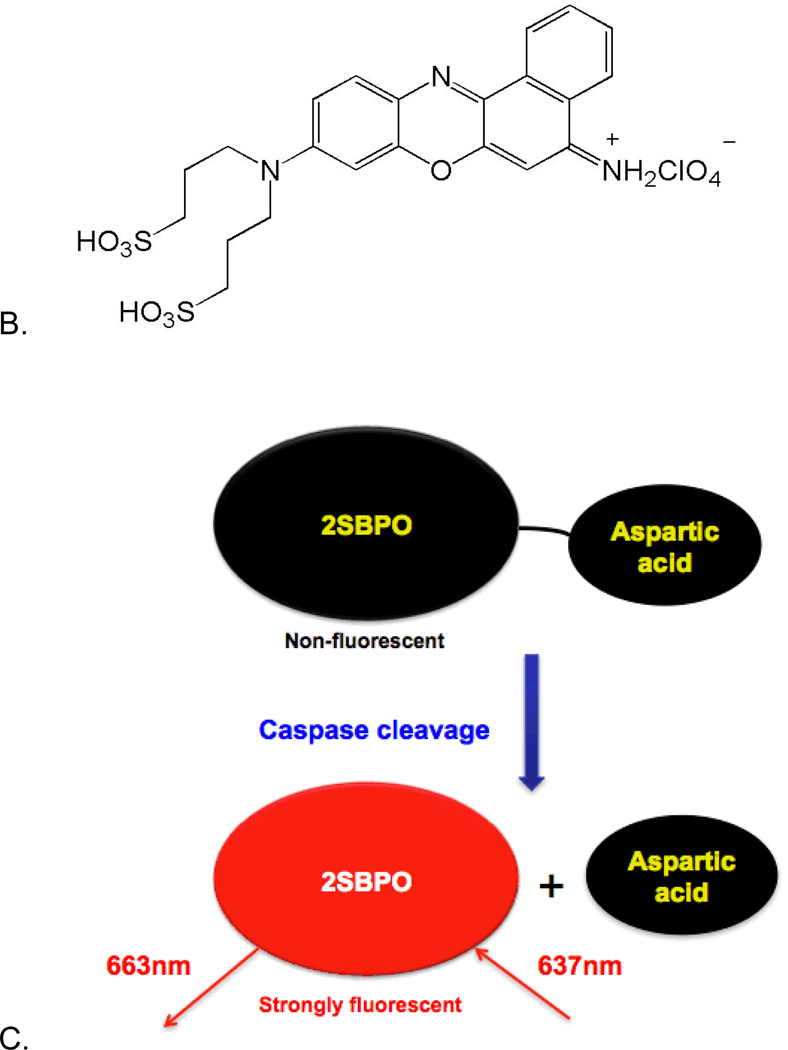
Structures of 2SBPO-Casp(A) and 2SBPO(B). The aspartic acid group renders the probe cell permeable and non-fluorescent. Upon cleavage (C), 2SBPO is retained in cells, generating a strong fluorescence signal (a synthetic scheme for (A) and (B) are found in Electronic Supplementary Information).
Methods
Fluorescence Measurements
Single molecule fluorescence correlation spectroscopy experiments were conducted on a custom confocal microscopy system. A red diode laser (635 nm, Edmund Optics) was directed into the back port of a microscope base (IX51, Olympus) via a mirror periscope. The laser beam was reflected onto the back aperture of an oil-immersion objective (100X, 1.3 NA, Olympus) using a long-pass dichroic mirror (Semrock). The beam was focused into individual cells by manipulating the sample stage and aligning the beam in the cell cytosol. Fluorescence from 2SBPO was collected by the same objective, passed through the dichroic mirror, and spatially filtered using a 100 µm pinhole (Newport). The fluorescence was then filtered using a 660 nm interference filter and detected by a single-photon avalanche photodiode. Fluorescence autocorrelation was calculated in photon arrival mode using software developed by Rieger and coworkers23 using a National Instruments counting board (PCI-6022) and software (Labview v8.0).
Fluorescence Correlation Spectroscopy Measurements
For analysis, a 30-µL drop of Ramos or HuT 78 cell suspension (105-106 cells mL−1) was placed on a 150 µm thick coverslip coupled to the microscope objective with immersion oil. A new drop of cells was used for each time frame. The red-fluorogenic probe, 2SPBO-Casp, was then added to the drop for a final probe concentration of 0.2 µM. Immediately after the addition of the probe, the cell was exposed to 150 µW of laser light and data acquisition was started. Cleavage of the probe by active caspases was rapid, allowing for fast measurements. Each cell was selected randomly, and the laser was positioned in the cytosol of the cell, away from the nucleus. The power of 150 µW was determined to be optimal to minimize photobleaching and cell damage and while maintaining a sufficient signal. Each cell was continually exposed for three sequential 10 s time frames and the data averaged. After 30 s, a new cell was located and tested. Data acquired by the Labview software was exported as text files and then imported into Origin. Autocorrelation functions were fit using a Levenberg-Marquardt algorithm. From the autocorrelation functions generated in Origin, information such as diffusion time (τD), the average number of molecules in the probe volume (N), and mean fluorescence intensity (<F(t)>) were determined.
Red Fluorescence Caspase Probe
In the synthesis of 2SBO, a benzo[a]phenoxazonium salt was synthesized by heating an arylazo-substituted aminophenol with 1-aminonaphthalene in DMF in the presence of perchloric acid (see Electronic Supplementary Information for synthetic schemes). Two sulfonic acid groups were then added in order to increase water solubility. Aspartic acid residues activated in situ by N,N,N,N-Tetramethyl-O-(7-azabenzotriazol-1-yl)uronium hexafluorophosphate (HATU) were coupled to 2SBPO using 2,4,6-collidine as a base. This 2SBPO-Casp conjugate was very soluble in water and gave minimal background signals before cleavage. Figures 1A and 1B show the structures of 2SBPO and its aspartic acid conjugate 2SBPO-Casp. The cleavage mechanism of 2SBPO-Casp is shown in Figure 1C. Non-fluorescent 2SBPO-Casp is cell permeable and enters into cells freely. Upon cleavage of the amide linker group by caspases, the fluorogenic dye, 2SBPO, is produced and is strongly fluorescent. This is a “turn on” mechanism of detection with significant changes in the fluorescence signal after cleavage, making it suitable for single molecule fluorescence.
Cell Culture, Apoptosis Induction, and Inhibition
Ramos and HuT 78 lymphocytes were cultured separately in RPMI 1640 medium supplemented with 10% fetal bovine serum and penicillin/streptomycin solution (20 mL/L) at 37°C and 5% CO2 atmosphere. The cells were sub-cultured weekly in a biosafety laminar flow hood rated for the appropriate biosafety level.24 Cells were induced to undergo apoptosis via the mitochondrial pathway mechanism. For induction, cells were incubated with 1.75 µg/mL staurosporine for the desired time (1–4 h) then washed, centrifuged, and resuspended in phosphate buffered saline (PBS, pH = 7.4). For inhibition, cells were incubated in the presence of staurosporine along with 20 µmol/L Z-VAD-FMK, a pan-caspase inhibitor. The inhibition experiments were performed for the same time intervals as the induction.
Determination of Apoptotic Cells
The fluorescence signal was calculated by the normalized fluorescence fluctuation autocorrelation function:
The signal, G(τ), corresponds to the diffusion of the probe (2SBPO molecule) inside the probe volume at time (t) and the self-similarity of the diffusion of the fluorophore after a lag time (t + τ).25
The release of freely diffusing 2SBPO, generated by activated caspases, gives rise to the autocorrelation signal. Since the background fluorescence signal of cells in the red region is low, correlation of fluorescence is the only parameter needed for characterization. Fluorescence can be characterized as correlated or uncorrelated, stable or unstable through autocorrelation functions.26 In our work, the autocorrelation curves were fit with the 3D diffusion model:
where N is the average number of molecules in the probe volume, τD is the diffusion time, and the S term defines the probe volume (the ratio of the z and xy radii, wz/wxy). The R2 value of the 3D model was obtained from the fit of the correlation curves, and was used as an indicator of how well the fluorescence was correlated. Cells that had non-correlated curves were considered to be healthy and were indicative of non-activated caspases. This definition was developed in previous work14 and verified by measuring control cells incubated with 2SBPO-Casp. Therefore, in order for a fluorescence curve to be defined as correlated, the R2 value must be significantly higher than the autocorrelation functions of blank cell samples and control cell samples.
Fluorescence Microscopy
Fluorescence imaging was performed with an inverted microscope (IX-71, Olympus). A 100 W mercury or metal halide lamp was used for fluorescence excitation using appropriate filters. All images were taken using a 10X objective and were recorded by a 12-bit CCD camera (Orca-285, Hamamatsu). The images were then processed in ImageJ (v. 1.41, National Institutes of Heath).
Results and Discussion
Single Molecule Fluorescence Properties of 2SBPO
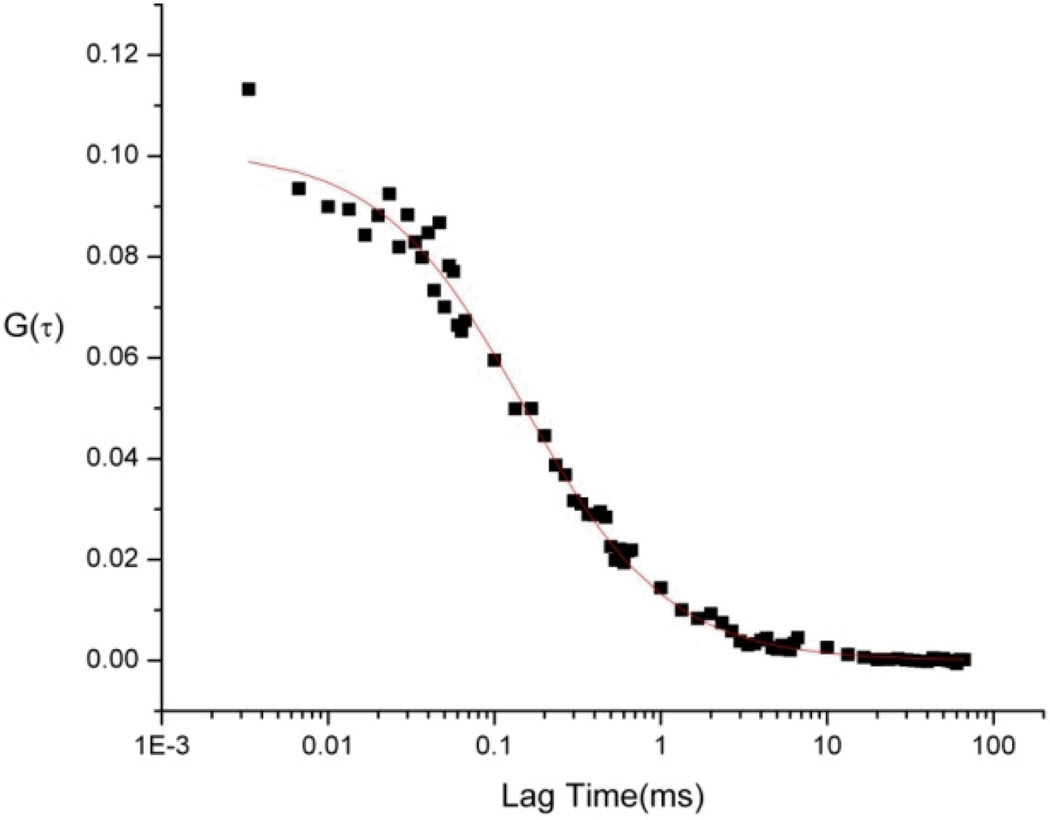
For successful use in cells, a dye system should have sufficient fluorescence at single molecule concentrations. Figure 2A shows the autocorrelation function of 1 nM 2SBPO generated by FCS. Using the three-dimensional diffusion model, the FCS curve showed high correlation with an R2 = 0.99. The average number of molecules in the probe volume is determined from the amplitude of the autocorrelation function at lag time zero (i.e. G(0) = <N>−1). At this working concentration, there are approximately 10 molecules in the probe volume at any given time. However, high background signal can give inaccurate values for <N>. In this case, the background is negligible compared to the signal, and accurate values for <N> can be obtained.
Figure 2.
Autocorrelation function of 1 nM 2SBPO. The FCS signal was readily detectable over the background and the three-dimensional diffusion model served as an adequate fit for the data (R2 = 0.99).
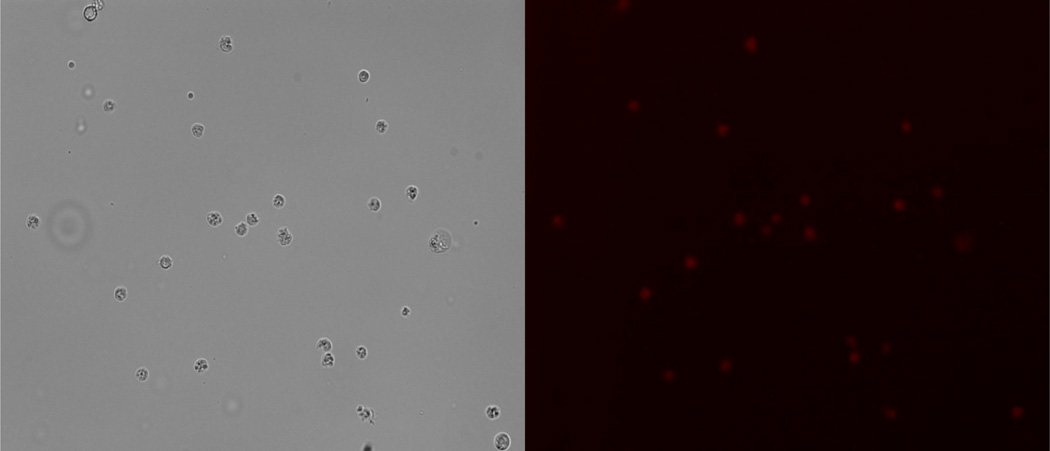
To demonstrate the apoptosis-sensing capability of 2SBPO-Casp in living cells, Ramos cells were induced with 1.75 µg/mL staurosporine and stained with 0.2 µM 2SBPO-Casp. After three hours, an increase in the fluorescence signal was observed within the cell using standard fluorescence microscopy. Figure 3A and Figure 3B show the white light and fluorescence image of apoptotic cells three hours after induction. Apoptotic cells are readily identified by red fluorescence, while healthy cells have no signal at these wavelengths. In experiments of the excitation and emission maxima of 2SBPO and 2SBPO-Casp, the intact probe showed no fluorescence signal (data not shown). Since autofluorescence at 660 nm is negligible, the fluorescence signal in the apoptotic cells originated from 2SBPO cleaved via caspase activity.
Figure 3.
White light (A) and red fluorescence(B) images of Ramos cells induced by 1.75 µg/mL staurosporine for 3 h and stained by 0.2 µM 2SBPO-Casp. Apoptotic cells are easily distinguished from healthy cells by a strong, background-free fluorescence.
Cell Membrane Permeability of 2SBPO
In our previous work, the rhodamine 110-based probe (D2R) was cell permeable. However, upon cleavage, the free rhodamine 110 was a zwitterion and it was not strongly retained in cells, unlike other rhodamine analogs. The rate of dye production (via cleavage) is countered on some level by the rate of dye loss due to photobleaching or leakage from the cell. Photobleaching is typically minimized by using short exposures of low duty cycle. Dye leakage is difficult to minimize, and presents a fundamental limit to an assay’s sensitivity. In the case of rhodamine 110 probes, this leakage leads to reduced sensitivity. Therefore, it was important to study the permeability of our new dye. The intact probe (2SBPO-Casp) must be cell permeant, but the cleaved dye (2SBPO) should not be able to cross the cell membrane. There would be an enhancement of sensitivity for FCS measurements if the free dye, 2SBPO, was retained in the cell cytosol instead of passing through the cell membrane and back to the extracellular medium.
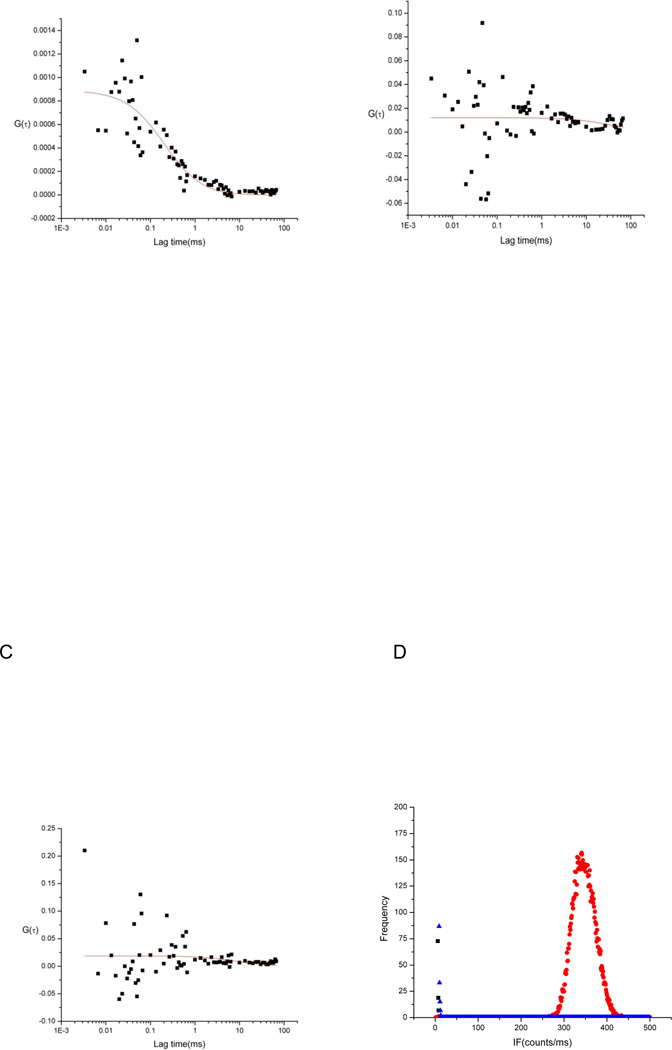
In order to test the 2SBPO dye permeability, the free 2SBPO dye was incubated with HuT 78 cells and FCS measurements were performed in the cells and in the extracellular medium. Figures 4A–4D are autocorrelation curves and photon counting histogram (PCH) data that show that stained cells had low signal intensity and no autocorrelation within the cytosol (R2 = 0.01), and were comparable to blank cells (R2 = 0.11). However, high intensity and high correlation (R2 = 0.82) were observed outside of the cell, proving that cleaved 2SBPO dye was not found within the cell. The impermeant nature of cleaved 2SBPO indicates that the dye would not leak back to the extracellular medium. Thus 2SBPO cleaved from 2SBPO-Casp by activated caspases would stay and accumulate in the cell cytosol. Fluorescence signal loss is minimized, leading to an improvement of sensitivity. Since apoptotic cells can be detected earlier due to the enhanced sensitivity, temporal resolution is also expected to increase.
Figure 4.
Representative autocorrelation functions of 1 µM 2SBPO in solution outside of a cell (A), a blank HuT 78 cell (B), and a HuT 78 cell stained with 1 µM 2SBPO (C). The free dye gives an autocorrelated signal (with low amplitude given the large number of molecules present. The blank cell and cell incubated with the free dye both show no autocorrelated fluorescence signal, indicating 2SBPO is not inside the cell. Photon counting histograms (D) of 1 µM 2SBPO in solution outside of cell (red), blank-Hut 78 cell (black), and Hut-78 cell stained by 1 µM 2SBPO (blue) show the fluorescence intensity of the cytosol does not increase with incubation with the free dye. This lack of fluorescence increase indicates 2SBPO cannot cross the cell membrane.
Induction and Detection of Apoptosis in Single Cells by Fluorescence Correlation Spectroscopy
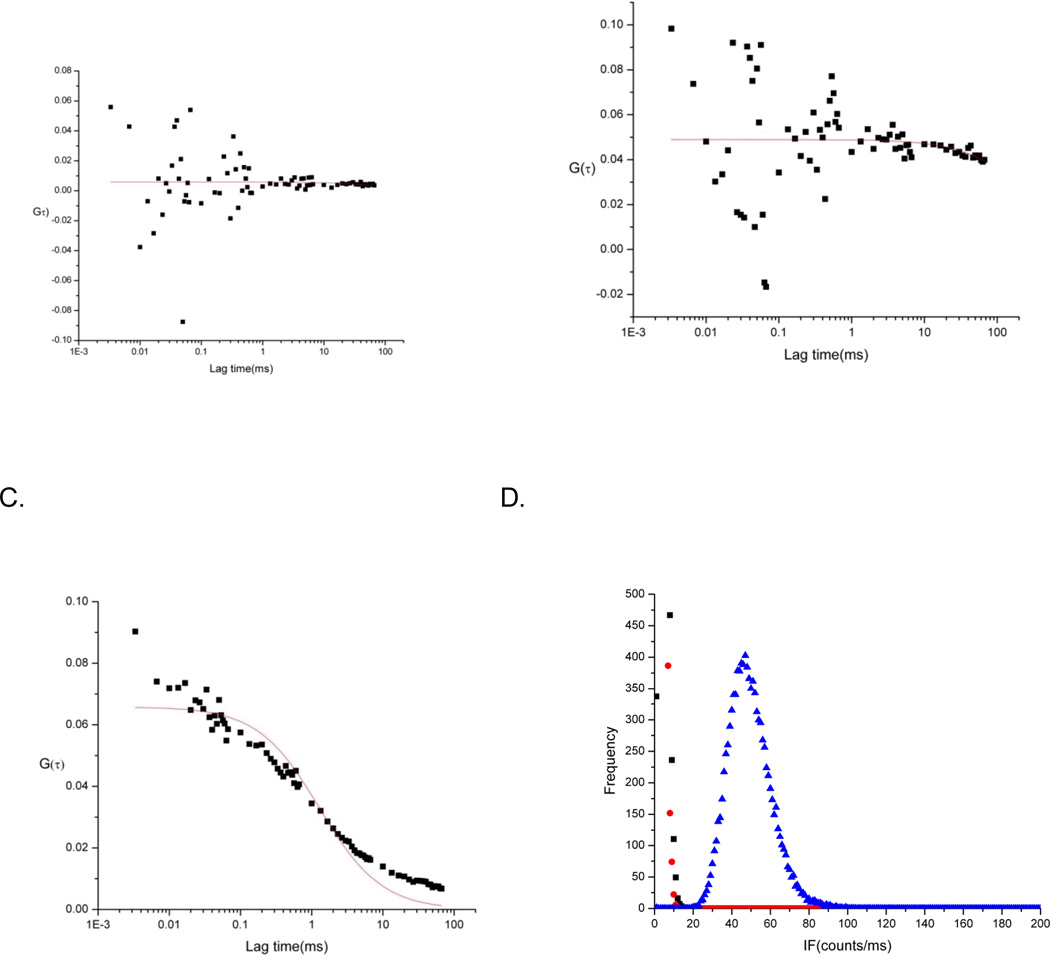
To demonstrate the capability of our new probe to detect apoptosis, we assayed Ramos cells using 2SBPO-Casp, and compared results with our previous work with rhodamine-derived probes. Thirty blank Ramos cells were measured and had FCS fit correlation coefficients (R2) ranging from 0–0.43. Figure 5A shows a representative autocorrelation function of blank Ramos cells. In the case of control cell experiments, 0.2 µM of 2SBPO-Casp was added to blank Ramos cells without any apoptosis-inducing agent. Correlation coefficients (R2) ranged from 0–0.28 (Figure 5B). The low correlation coefficient (R2) indicates that no fluorescence correlation was observed in blank cells and control cells and that the autofluorescence of cells in the red region was minimal. For apoptosis induction experiments, FCS measurements were taken every 15 minutes for the first hour and then every hour (4 hours total) with a sample of 30 cells for each time frame. An increase in the correlation coefficient (R2) was observed after 30 minutes of induction (mean R2 = 0.78). The autocorrelation continued to increase and resulted in a maximum number of correlated cells after 3 hours of induction (Figure 5C). This increase of autocorrelated fluorescence is indicative of an increase in the production of 2SBPO dye via caspase cleavage. Thus higher correlation coefficients (R2) were observed as the number of 2SBPO molecules inside cells increased. In addition, from the PCH data, it is clear that the number of fluorescent molecules present within the probe volume was significantly different between the three cell types (Figure 5D). In the case of the blank and control cells, the intensity averaged around zero counts per millisecond. In the induced sample, a distinct shift was observed and further verified the production of fluorescent species (median signal = 45 counts per millisecond). While it is possible to use the intensity alone to distinguish single-molecule fluorescence in this case, the use of FCS data alongside photon counting histograms ensures that, in the case of the occasional bright blank cell, accurate apoptosis measurements can still be conducted.
Figure 5.
Autocorrelation functions of representative blank Ramos cell (A), control Ramos cell stained with 0.2 µM 2SBPO-Casp(B), and a Ramos cell induced with 1.75 µg/ml staurosporine and incubated for 3 h (C). The fluorescence signal is uncorrelated in both the blank and control cells, while apoptotic cells show a correlated fluorescence. Photon counting histograms (D) of blank Ramos cell (black), control Ramos cell stained with 0.2 µM 2SBPO-Casp(red), and a Ramos cell induced with 1.75 µg/mL staurosporine and incubated for 3 h (blue) show the intensity differences can also be used to distinguish apoptotic cells.
The difference of correlation coefficients (R2) between blank cells, control cells and induced cells was significant, with induced cells having an average R2 value above 0.65. Therefore, cells were determined apoptotic if the autocorrelation fit R2 coefficient was ≥ 0.65. Because the correlation coefficients (R2) of blank and control cells were so low, the presence of a correlated signal was the only parameter needed to signify an apoptotic cell. In this way, identification of apoptotic cells is simplified compared with our previous work as no more statistical steps are needed to exclude the effect of cell autofluorescence.
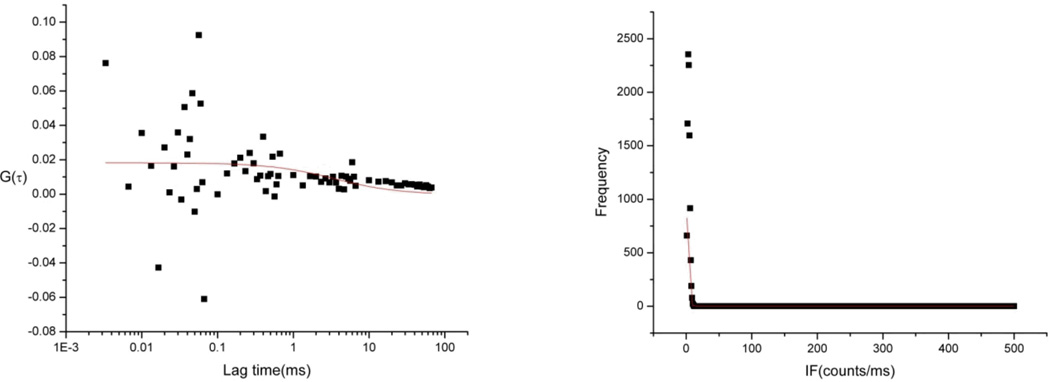
Apoptosis inhibition was also studied using 2SBPO-Casp. The experiment performed was similar to staurosporine induction experiments with the exception of the addition of 20 µmol L−1 of the inhibitor Z-VAD-FMK. The inhibitor was added to Ramos cell samples and incubated. FCS measurements were taken every hour (4 hours total), and 30 cells were measured each hour. Figures 6A and 6B show most of the correlation curves generated from the inhibited cells samples were uncorrelated and did not meet the aforementioned criteria for identifying apoptotic cells. However, a fraction of inhibited Ramos cells showed caspase activity at 3 and 4 hours. The number of apoptotic cells at three hours in the inhibited sample (10%) is smaller than in the sample without inhibitor (53%). We have seen this effect at longer time periods with our lower-sensitivity approaches.7 In mitochondrial-driven apoptosis, cytochrome c and apaf-1 form the apoptosome, a caspase-cleaving supermolecular complex. The inhibitor used, Z-VAD-FMK, is a pan-caspase inhibitor. The apoptosome is not inhibited in the presence of Z-VAD-FMK, and continues to produce activated caspase 9. Z-VAD-FMK is a fluoromethyl ketone inhibitor and irreversibly binds to the active site of caspases. Eventually, the Z-VAD-FMK in the cell is consumed completely and the continued production of caspase 9 results in the cleavage of downstream caspases such as caspase 3. Once the inhibitor is exhausted, any caspase sensitive probe will register a signal. Since our single molecule approach has high sensitivity, we can observe the consumption of the inhibitor earlier than in previous work.
Figure 6.
Representative autocorrelation function and photon counting histogram of a Ramos cell induced with STSP and 20 µmol/L Z-VAD-FMK for 3h and stained with 0.2 µM 2SBPO-Casp (A,B). As apoptosis continues, the inhibitor is eventually consumed and caspase activity is observed.
Temporal Dynamics and Early Detection of Caspase Activity in Apoptotic Cells
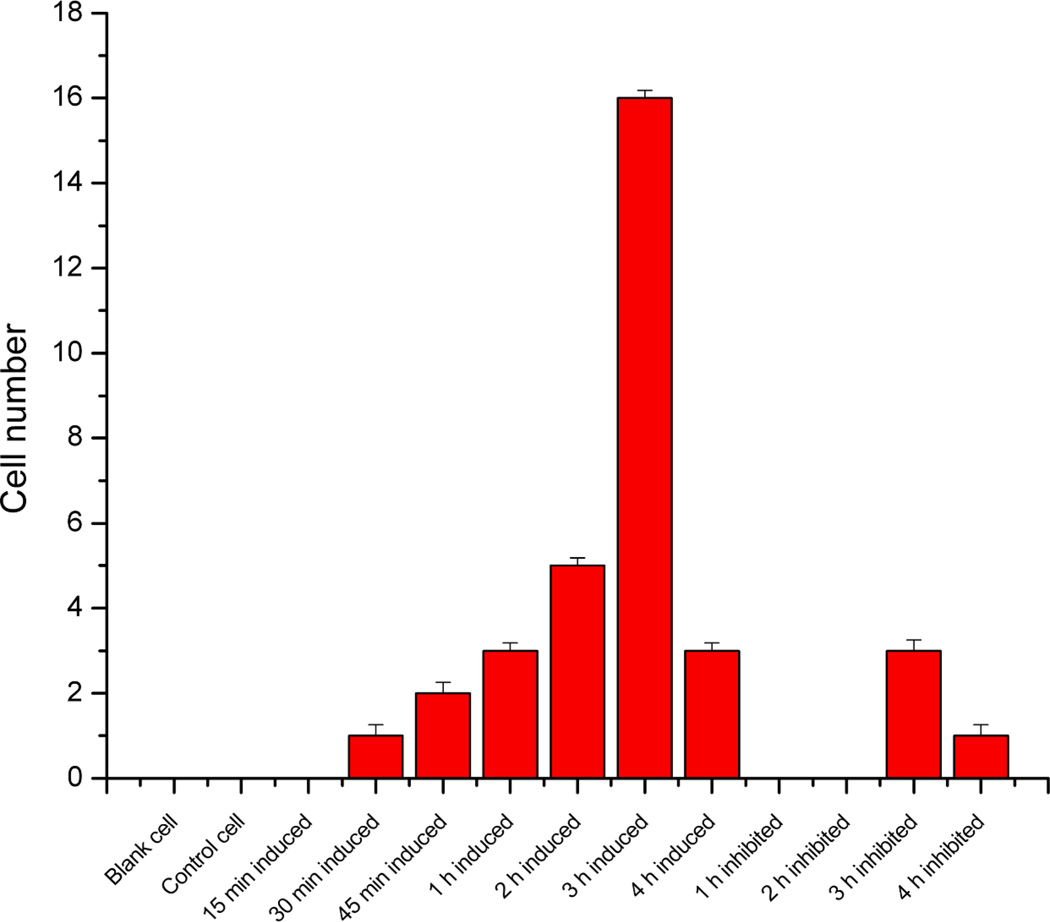
The temporal effect of staurosporine on apoptosis induction is shown in Figure 7 (n = 30 cells for each time point, control, and inhibited sample). No blank cells or control cells were determined apoptotic. In the induction experiments, apoptotic cells started to be observed after 30 minutes of induction, and the number of apoptotic cells continued to increase for the first three hours. At the third hour of induction, a large increase in the number of apoptotic cells was observed. This increase at three hours is consistent with previous work conducted in our laboratory.14 Caspases are also auto-proteolytic, and a decrease in caspase activity is observed at the fourth hour of apoptosis. This decrease in caspase activity has been seen using rhodamine 110-based probes.7 Since the 2SBPO-Casp probe was added to each cell sample just before measurement, the fluorescence signal is indicative of the instantaneous caspase activity, rather than of an accumulation of 2SBPO over the entire time period. Our approach therefore can track not only apoptotic cells, but can also identify the decrease in caspase activity due to auto-proteolysis. In the inhibited experiments, no apoptotic cells were seen in the one or two hour time frames. However, three apoptotic cells were identified after 3 hours, and this result is attributed to an excess of caspases relative to the concentration of inhibitor used.
Figure 7.
Temporal dynamics of apoptosis induction via the mitochondrial pathway. Errors bars represent the counting error (n = 30 cells per time frame). The number of apoptotic cells is seen to increase as early as 30 minutes after induction. Caspase activity in the cells reaches a maximum at three hours and reduces at the fourth hour due to autoproteolysis.7 No blank or control cells were observed to be apoptotic, although in inhibited samples, there was sufficient activated caspases to consume all of the inhibitor so that excess caspases could cleave 2SBPO-Casp.
The first identification of apoptosis was detected as early as 30 minutes after induction, which was earlier than previous work. This result meets our aforementioned expectations, since 2SBPO is cell membrane impermeable, minimizing signal loss. This early detection capability, combined with the high sensitivity from single molecule measurements, will enable new apoptosis assays to be developed.
Conclusions
In this work, we use single molecule FCS to identify apoptosis in single, viable cancer cells using a new red fluorescent caspase probe. This work builds upon previous studies in our group using FCS but offers high sensitivity and temporal resolution. The limitations of methods using shorter wavelength probes were that the cell autofluorescence overlapped with the cleaved dye. In addition, rhodamine 110 was cell membrane permeable after cleavage and would slowly escape the cell causing a lower signal. Our newly developed probe, 2SBPO-Casp, generates higher signal and less background, simplifying analysis and improving the sensitivity of the method. Since cell autofluorescence is minimal in the red region, determination of apoptosis was based on the autocorrelation of fluorescence and fit correlation coefficient value (R2) as a parameter. Although the background is small in the red region of the visible spectrum, the signal at the earliest stages of apoptosis (<1hr after induction) is too small to be detected by conventional epifluorescence or confocal microscopy. The use of single molecule techniques such as FCS allows the minimal signal to be indentified as coming from 2SBPO.
Apoptotic cells, induced via the mitochondrial-driven pathway, were identified as early as 30 minutes after induction. Other methods, with similar early detection capabilities, do not leave the cell intact and viable. In future work, we will identify apoptotic cells and follow single cells through the entire caspase activity period as well as later apoptosis steps. Although more work still needs to be done in order to improve the throughput of this method, we have demonstrated the capability of single molecule FCS as a powerful tool in single cell analysis.
Supplementary Material
Acknowledgements
This work was supported by grants from the National Institutes of Health (Grant RR025782) and the Robert A. Welch Foundation (Grant D-1667).
References
- 1.French CJ, Spees JL, Zaman AKMT, Taatjes DJ, Sobel BE. FASEB Journal. 2009;23:1177. doi: 10.1096/fj.08-116509. [DOI] [PMC free article] [PubMed] [Google Scholar]
- 2.Machado NG, Alves MG, Carvalho RA, Oliveira PJ. Cardiovascular Toxicology. 2009;9:211. doi: 10.1007/s12012-009-9055-1. [DOI] [PubMed] [Google Scholar]
- 3.Gill C, Mestril R, Samali A. FASEB Journal. 2002;16:135. doi: 10.1096/fj.01-0629com. [DOI] [PubMed] [Google Scholar]
- 4.Wlodkowic D, Faley S, Zagnoni M, Wikswo JP, Cooper JM. Analytical Chemistry. 2009;81:5517. doi: 10.1021/ac9008463. [DOI] [PMC free article] [PubMed] [Google Scholar]
- 5.Wlodkowic D, Skommer J, McGuinness D, Faley S, Kolch W, Darzynkiewicz Z, Cooper JM. Analytical Chemistry. 2009;81:6952. doi: 10.1021/ac9010217. [DOI] [PMC free article] [PubMed] [Google Scholar]
- 6.Kasibhatla S, Tseng B. Molecular Cancer Therapy. 2003;2:573. [PubMed] [Google Scholar]
- 7.Reif RD, Martinez MM, Pappas D. Analytical and Bioanalytical Chemistry. 2010;397:3387. doi: 10.1007/s00216-010-3567-1. [DOI] [PubMed] [Google Scholar]
- 8.Martinez MM, Reif RD, Pappas D. Analytical Methods. 2010;2:996. [Google Scholar]
- 9.Wlodkowic D, Khoshmanesh K, Sharpe JC, Darzynkiewicz Z, Cooper JM. Analytical Chemistry. 2011;83:6439. doi: 10.1021/ac200588g. [DOI] [PMC free article] [PubMed] [Google Scholar]
- 10.Chen Z, Li Q, Wang X, Wang Z, Zhang R, Yin M, Yin L, Xu K, Tang B. Analytical Chemistry. 2010;82:2006. doi: 10.1021/ac902741r. [DOI] [PubMed] [Google Scholar]
- 11.Khanal G, Chung K, Solis-Wever X, Johnson B, Pappas D. The Analyst. 2011;136:3519. doi: 10.1039/c0an00845a. [DOI] [PMC free article] [PubMed] [Google Scholar]
- 12.Zhang J-J, Zheng T-T, Cheng F-F, Zhang J-R, Zhu J-J. Analytical Chemistry. 2011;83:7902. doi: 10.1021/ac201804b. [DOI] [PubMed] [Google Scholar]
- 13.Reif RD, Martinez MM, Wang K, Pappas D. Analytical and Bioanalytical Chemistry. 2009;395:787. doi: 10.1007/s00216-009-3024-1. [DOI] [PubMed] [Google Scholar]
- 14.Martinez MM, Reif RD, Pappas D. Analytical and Bioanalytical Chemistry. 2010;396:1177. doi: 10.1007/s00216-009-3298-3. [DOI] [PubMed] [Google Scholar]
- 15.Hug H, Los M, Werner H, Debatin K. Biochemistry. 1999;38:13906. doi: 10.1021/bi9913395. [DOI] [PubMed] [Google Scholar]
- 16.Saito K, Wada I, Tamura M, Kinjo M. Biochem. Biophys. Res. Commun. 2004;324:849. doi: 10.1016/j.bbrc.2004.09.126. [DOI] [PubMed] [Google Scholar]
- 17.Ho N-H, Weissleder R, Tung C-H. Bioorganic and Medicinal Chemistry Letters. 2006;16:2599. doi: 10.1016/j.bmcl.2006.02.045. [DOI] [PubMed] [Google Scholar]
- 18.Lai KS, Ho N-H, Cheng JD, Tung C-H. Bioconjugate Chemistry. 2007;18:1246. doi: 10.1021/bc0603586. [DOI] [PMC free article] [PubMed] [Google Scholar]
- 19.Ho N-H, Weissleder R, Tung C-H. Tetrahedron. 2006;62:578. [Google Scholar]
- 20.Jose J, Ueno Y, Burgess K. Chemistry a European Journal. 2009;15:418. doi: 10.1002/chem.200801104. [DOI] [PubMed] [Google Scholar]
- 21.Jose J, Burgess K. Journal or Organic Chemistry. 2006;71:7835. doi: 10.1021/jo061369v. [DOI] [PubMed] [Google Scholar]
- 22.Jose J, Burgess K. Tetrahedron. 2006;62:11021. [Google Scholar]
- 23.Rieger R, Rocker C, Nienhaus GU. Am. J. Phys. 2005;73:1129. [Google Scholar]
- 24.Pappas D. Practical Cell Analysis. John Wiley & Sons; 2010. [Google Scholar]
- 25.Schwille P, Korlach J, Webb WW. Cytometry. 1999;36:176. doi: 10.1002/(sici)1097-0320(19990701)36:3<176::aid-cyto5>3.0.co;2-f. [DOI] [PubMed] [Google Scholar]
- 26.Kim SA, Heinze KG, Schwille P. Nat Methods. 2007;4:963. doi: 10.1038/nmeth1104. [DOI] [PubMed] [Google Scholar]
Associated Data
This section collects any data citations, data availability statements, or supplementary materials included in this article.


