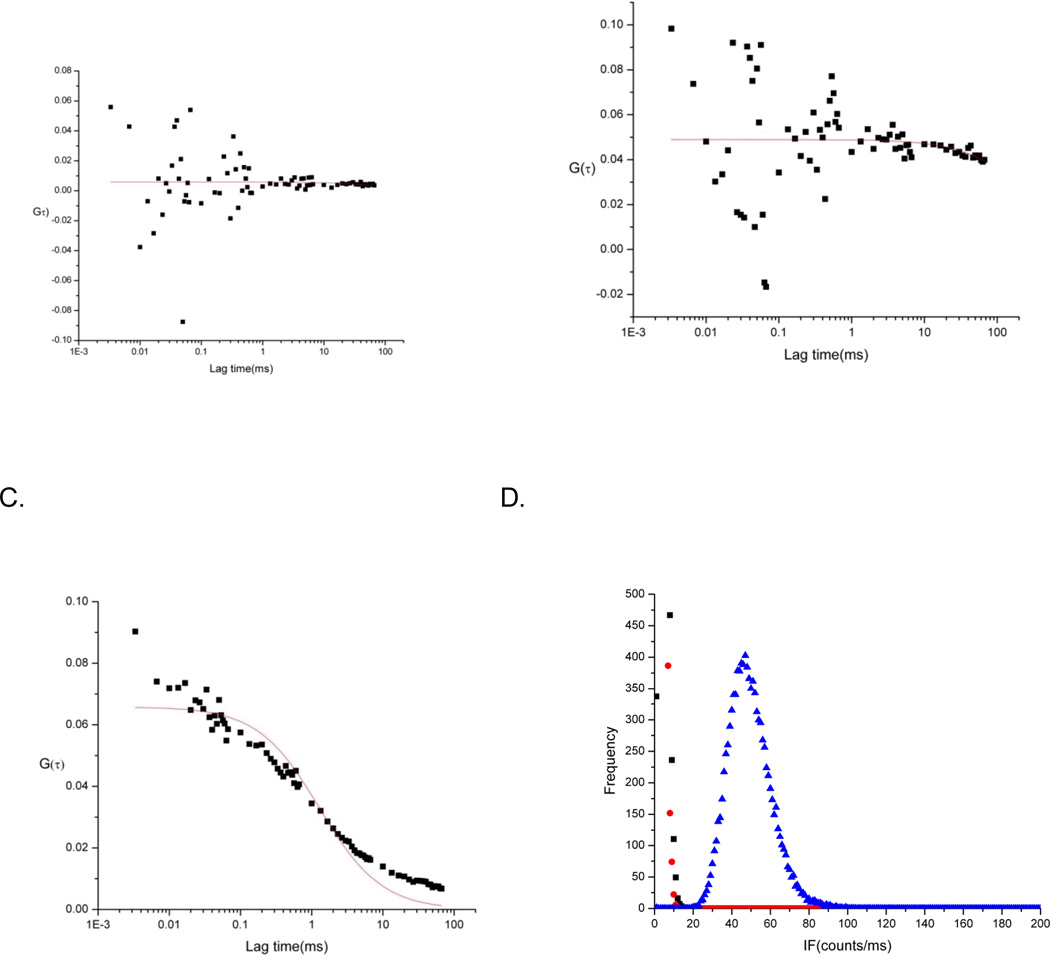
Figure 5.
Autocorrelation functions of representative blank Ramos cell (A), control Ramos cell stained with 0.2 µM 2SBPO-Casp(B), and a Ramos cell induced with 1.75 µg/ml staurosporine and incubated for 3 h (C). The fluorescence signal is uncorrelated in both the blank and control cells, while apoptotic cells show a correlated fluorescence. Photon counting histograms (D) of blank Ramos cell (black), control Ramos cell stained with 0.2 µM 2SBPO-Casp(red), and a Ramos cell induced with 1.75 µg/mL staurosporine and incubated for 3 h (blue) show the intensity differences can also be used to distinguish apoptotic cells.

