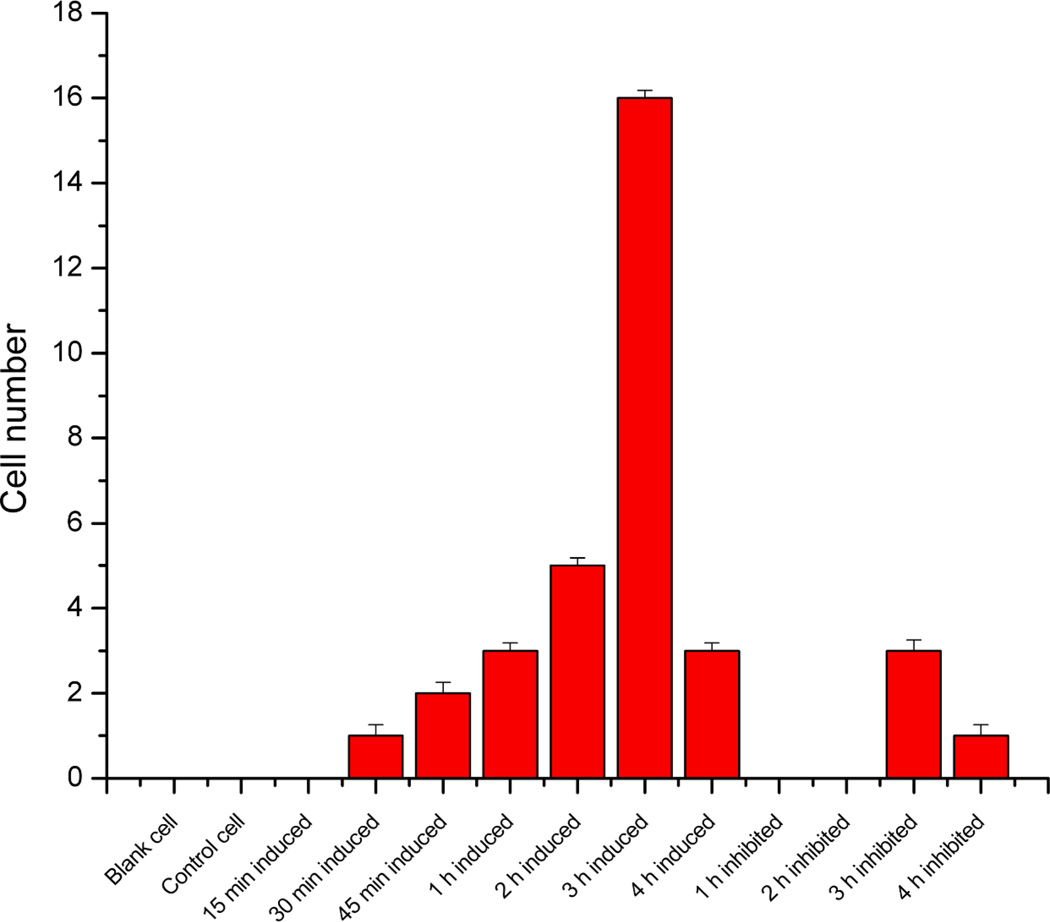
Figure 7.
Temporal dynamics of apoptosis induction via the mitochondrial pathway. Errors bars represent the counting error (n = 30 cells per time frame). The number of apoptotic cells is seen to increase as early as 30 minutes after induction. Caspase activity in the cells reaches a maximum at three hours and reduces at the fourth hour due to autoproteolysis.7 No blank or control cells were observed to be apoptotic, although in inhibited samples, there was sufficient activated caspases to consume all of the inhibitor so that excess caspases could cleave 2SBPO-Casp.

