

Abstract
The number and size of resorption cavities in cancellous bone are believed to influence rates of bone loss, local tissue stress and strain and potentially whole bone strength. Traditional two-dimensional approaches to measuring resorption cavities in cancellous bone report the percent of the bone surface covered by cavities or osteoclasts, but cannot measure cavity number or size. Here we use three-dimensional imaging (voxel size 0.7 × 0.7 × 5.0 μm) to characterize resorption cavity location, number and size in human vertebral cancellous bone from nine elderly donors (7 male, 2 female, ages 47–80 years). Cavities were 30.10 ± 8.56 μm in maximum depth, 80.60 ± 22.23 *103 μm2 in surface area and 614.16 ± 311.93 *103 μm3 in volume (mean ± SD). The average number of cavities per unit tissue volume (N.Cv/TV) was 1.25 ± 0.77 mm−3. The ratio of maximum cavity depth to local trabecular thickness was 30.46 ± 7.03 % and maximum cavity depth was greater on thicker trabeculae (p < 0.05, r2 = 0.14). Half of the resorption cavities were located entirely on nodes (the intersection of two or more trabeculae) within the trabecular structure. Cavities that were not entirely on nodes were predominately on plate-like trabeculae oriented in the cranial-caudal (longitudinal) direction. Cavities on plate-like trabeculae were larger in maximum cavity depth, cavity surface area and cavity volume than cavities on rod-like trabeculae (p < 0.05). We conclude from these findings that cavity size and location are related to local trabecular microarchitecture.
Keywords: bone remodeling, trabecular bone, histomorphometry, imaging, biomechanics
1.0 INTRODUCTION
The amount of bone remodeling in the body has been associated with fracture risk independent of bone mineral density [1, 2]. The association between bone remodeling and fracture risk is believed to be due to the biomechanical effects of cavities formed during the remodeling process [3, 4]. Cavities formed during remodeling, referred to here as resorption cavities, may act as stress risers and promote microscope tissue damage and whole bone failure. However, like any stress riser, the mechanical effects of a cavity depend on cavity size and location within the microarchitecture.
Techniques for measuring resorption cavity depth, surface area and location in human cancellous bone are limited. The percent of bone surface area covered by cavities in cancellous bone can be measured in two-dimensional histology sections as percent eroded surface (ES/BS) or osteoclast surface (Oc.S/BS). However, two-dimensional histology sections cannot be used to identify individual cavities due to the complex shapes of cavities and trabecular bone (Figure 1) [5, 6]. Measures of average maximum resorption cavity depth within a specimen (erosion depth, E.De) can be performed in two-dimensional sections by counting lamellae [7, 8] or by estimating the pre-resorbed surface in a two-dimensional section [9, 10]. However, the techniques do not account for cavity morphology out-of-plane, are limited to only a few surfaces in each section (potentially generating a sampling bias) and/or require extensive training to achieve repeatable results [11]. Scanning electron microscopy (SEM) has been used to visualize individual resorption cavities in human cancellous bone [12–14] (Figure 2), but the method provides only rough estimates of cavity size because images collected in this manner cannot measure out-of-plane depth on the curved surfaces of cancellous bone (SEM can be used to measure cavity depth on flat surfaces in vitro [15, 16]).
Figure 1.
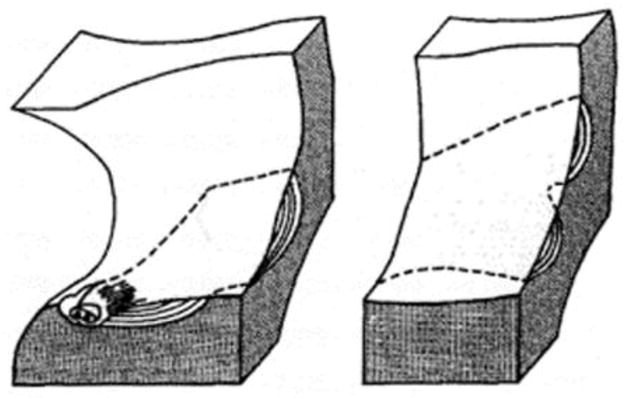
Traditional bone histomorphometry cannot be used to measure the number or size of remodeling events or resorption cavities [6]. Although only a single remodeling event is present, it may appear as one or two profiles. Reprinted from [5], with permission from Elsevier.
Figure 2.

Scanning electron microscopy (SEM) can visualize individual resorption cavities in cancellous bone but only provides estimates of cavity size because out-of-plane depth cannot be determined. Reprinted from [13], with permission from Elsevier.
Due to the technical limitations mentioned above, it is not known how the breadth and depth of individual resorption cavities vary within human cancellous bone. Additionally, to our knowledge, measures of resorption cavities (eroded surface and erosion depth) in human cancellous bone have been limited to iliac crest biopsies [17] and have not been applied to regions of the skeleton that are prone to age-related fracture such as the vertebrae. It is not known if resorption cavities occur preferentially on rod-like or plate-like trabeculae or on nodes in the trabecular microarchitecture (the intersection of two or more trabeculae). Nor is it known if resorption cavities are located preferentially on trabeculae of a certain orientation (longitudinal, oblique or transverse to the primary structural orientation). Stress distributions in cancellous bone have been shown to differ between rod-like and plate-like trabeculae and on trabeculae oriented in longitudinal, oblique and transverse directions [18, 19], suggesting that the biomechanical importance of cavities may depend on their location within the trabecular microarchitecture as well as their size and shape. For example, it has been argued that resorption cavities may not have an important biomechanical effect unless they are located on vertical trabeculae with long spans (so called “unsupported trabeculae”) [3, 4]. It is also not known how cavity depth is related to the thickness of the trabeculae upon which they form. Theoretical models suggest that the ratio of cavity depth to thickness can greatly influence stress concentrations associated with resorption cavities [20].
The long term goal of the current work is to understand how bone remodeling influences bone strength and fracture risk independent of bone mineral density and bone mass. In this study, we provide the first, three-dimensional characterization of the number, size and shape of resorption cavities in human vertebral cancellous bone. Specifically, we determine: 1) The depth, surface area and volume of individual resorption cavities; and 2) the relationship between maximum resorption cavity depth, surface area, local trabecular thickness, trabecular type (rod-like, plate-like, node) and trabecular orientation (longitudinal, oblique, transverse).
2.0 MATERIAL and METHODS
2.1 Image Acquisition and Processing
Cylinders of human vertebral cancellous bone (8 mm diameter, 15 mm in height) oriented in the cranial-caudal direction were collected from vertebral bodies from nine individuals (L4, 7 male, 2 female, 47–80 years of age, 70 ± 10, mean ± SD). The donors had no history of metabolic bone disease and displayed no obvious vertebral deformities. The specimens were part of a larger biomechanical study and had previously been submitted to uniaxial compression to apparent yield followed by unloading. The central 5 mm of each specimen length was embedded undecalcified in methyl-methacrylate. Subsequently, three-dimensional images of each specimen were acquired using serial milling [21]. Serial milling is an automated imaging approach in which five micrometers are milled away from the top of the specimen and images of the newly exposed block face are collected. The approach has been described in detail in prior publications [22, 23]. In our implementation of serial milling, fluorescent light images of bone were acquired using UV excitation/emission and achieved voxel sizes of 0.7 × 0.7 × 5.0 μm [23]. Raw images collected using this resolution consist of 800 transverse cross-sections, each consisting of a 6 × 6 mosaic of images (86,400 images total per specimen, occupying 691 GB of memory). We have previously demonstrated that an in-plane voxel size of 1.4 μm or smaller is required to reliably detect individual resorption cavities [24]. Image processing and analysis were performed using custom software written for use with Matlab (Mathworks, Natick, MA, USA) and scripts written for use with Amira (version 5.3 Visage Imaging, San Diego, CA, USA).
2.2 Identification of Resorption Cavities in Three-Dimensional Images
As there are no fluorescent markers of resorption cavities compatible with the serial milling approach, resorption cavities were detected and traced manually by a trained observer. To reduce labor requirements associated with manual tracing, only a subset of the specimen was examined using the following sampling approach: Three transverse cross-sections, each 1.5 mm from one another were selected in a systemic random manner (Figure 3A). The eroded surface (ES/BS) of the whole specimen was determined using line intersection counting with a grid spacing of 200 μm (Figure 3B). Eroded surfaces were identified as scalloped defects or crenated surfaces on the trabecular surface in the two-dimensional images.
Figure 3.

Resorption cavities were sampled in the following manner: (A) Three transverse cross-sections were collected from each specimen. (B) Two-dimensional measures of eroded surface (ES/BS) were determined using the line intersection method with a grid size of 200 μm. Three-dimensional measures of cavities were then determined by first (C) Identifying all eroded surfaces within each cross-section (squares). (D) The eroded surface observed is illustrated (arrows). (E) A three-dimensional image surrounding each eroded surface profile was then generated for the observer. (F) The observer then traces the cavity in the three-dimensional image. (G) Cavities identified in each cross-section were then measured in three-dimensions using automated software.
To obtain three-dimensional measures of individual cavities, the observer first noted the location of each eroded surface profile within the cross-section (shown as squares on Figure 3C and at a higher magnification in Figure 3D). A three-dimensional rendering of the region of bone surrounding each of the eroded surface profiles was generated to allow the observer to visualize the entire resorption cavity in three-dimensions (Figure 3E). The observer then traced the entire surface of each cavity in the three-dimensional image using the lasso tool in Amira (version 5.3 Visage Imaging, San Diego, CA, USA (Figure 3F) [24]. The boundaries of the eroded surface were confirmed by visualization of the scalloped or crenated surface in cross section (Figure 3D). A total of 206 cavities (15–34 cavities per specimen) were manually identified and submitted to automated three dimensional measurement.
2.3 Automated Measures of Cavity Size in Three-Dimensional Images
Custom software written for Amira and Matlab was used to automatically measure surface area, maximum cavity depth and cavity volume. The eroded surface traced manually (see above) was used to measure the surface area of each cavity. To measure maximum cavity depth a three-dimensional thin plate smoothing spline was fit across the surface of each cavity to estimate the ‘pre-resorbed’ bone surface. A thin plate smoothing spline is a three-dimensional version of a cubic spline that is commonly used in image processing to cover voids on surface renderings [25, 26]. The bone surface within 50 μm surrounding the edge of each resorption cavity was used to generate the curve fit (Figure 4A–C). A three-dimensional curve fit spanning the cavity was generated (the ‘tpaps’ function in Matlab). The spline fit used Langrangian end conditions such that the slope of the spline matched the slope of the three-dimensional bone surface surrounding each cavity (Figure 4D). Cavity depth was determined at every point on the eroded surface as the minimum distance between the eroded surface and the pre-resorbed surface (Figure 4E). The maximum cavity depth was then determined for each cavity. Benchmarking studies suggest that the approach provides cavity depth measures within 12% of the actual values in test shapes (Appendix). Volume per cavity was determined as the volume enclosed by the ‘pre-resorbed’ bone surface and the eroded surface (black region in Figure 4E) [27]. Additionally, estimates of the average number of cavities per unit bone surface (N.Cv/BS) and total volume occupied by cavities (Tt.Cv.V/BV) were estimated using the following relationships:
| (1) |
| (2) |
where BS/Cv is the average bone surface per cavity and Cv.V is the mean volume per cavity. The abbreviation BS is the bone surface and BV is the bone volume in the specimen, both of which were measured directly in the three-dimensional image by coarsening to a voxel size of 10.6 × 10.6 × 10.0 μm and importing into BoneJ (bonej.org) [28]. Additionally, traditional three-dimensional measures of trabecular microarchitecture were measured (bone volume fraction, Bone Surface to Bone Volume Ratio, trabecular thickness, trabecular separation, degree of anisotropy, structure model index, connectivity density).
Figure 4.

(A) A cavity on the trabecular bone surface detected as described in Figure 3 is shown. (B) The cavity was manually traced in the three-dimensional image using Amira. (C) The automated measurement software then identified the bone surface within 50 μm from the edge of the cavity. (D) A thin plate smoothing spline was fit to the surface area surrounding the cavity (shown in C) and used to estimate the “pre-resorbed” surface. (E) The maximum cavity depth was measured as the maximum distance between the spline fit and the eroded surface of the cavity. The cavity shown has a maximum cavity depth of 94 μm (mean maximum cavity depth is reported in Table 1). All scale bars represent 100 μm.
2.4 Determination of Cavity Location
Each resorption cavity traced by the observer was reviewed to assess local trabecular morphology. The observer manually measured the local thickness of the trabecula (referred to here as sTb.Th, μm) as the maximum distance between the ‘pre-resorbed’ bone surface and the opposing side of the trabecula (performed with the 3D length measurement tool in Amira). Additionally, each cavity was characterized as being on a rod-like trabecula, plate-like trabecula and/or a node (where two or more trabeculae meet). When appropriate, a cavity was characterized as being both on a node and on a rod-like trabecula or both on a node and on a plate-like trabecula. The angle of each trabecula relative to the primary trabecular orientation (i.e. cranial-caudal direction), φ, was determined (using the 3D angle measurement tool in Amira). Trabeculae were characterized as longitudinal (0° < φ ≤ 30°), oblique (30° < φ ≤ 60°) or transverse (60° < φ ≤ 90°) [29].
2.5 Statistical Analyses
The average and median cavity sizes across all nine specimens were determined. Additionally, analyses of the distribution of cavity size were performed. Since measures of cavity size were not normally distributed, the median, 25th and 75th quartiles are used to characterize the results. A Kruskal-Wallis non-parametric ANOVA and a Wilcoxon post-hoc test were used to identify differences in microarchitecture or cavity size relative to location (rod-like, plate-like, node, trabecular orientation). Correlation analysis was used to determine the relationships among measures of cavities and trabecular microarchitecture. Statistical analyses were implemented using JMP (version 9.0, ImageMagick Studio LLC, Cary, NC, USA).
3.0 RESULTS
Resorption cavities were much broader than they were deep (Figure 5A–F). Resorption cavities were observed on plate-like trabeculae (Figure 5A,B), rod-like trabeculae (Figure 5C,D) and nodes within the trabecular microarchitecture (Figure 5E,F). Resorption cavities that fenestrated plate-like trabeculae were also observed (Figure 5G,H).
Figure 5.

Resorption cavities were observed on plate-like trabeculae (A–B), rod-like trabeculae (C–D), nodes (E–F) and fenestrations (G–H).
The average number and size of the resorption cavities in the nine specimens are summarized in Table 1. Cavities from all nine specimens were pooled to characterize the range of cavity shape. Maximum cavity depth ranged from 4.90 to 116.73 μm (Figure 6). The ratio of maximum cavity depth to local trabecular thickness ranged from 4.61 to 90.34% (Figure 6). Cavities on plate-like trabeculae displayed greater maximum cavity depth and surface area than those on rod-like trabeculae (p < 0.05, Table 2). No differences in maximum cavity depth or surface area were observed among cavities located on longitudinal, oblique or transverse trabeculae. The maximum cavity depth was positively correlated with local trabecular thickness and with cavity surface area but the relationships were not predictive (p < 0.05, r2 =0.14 for local trabecular thickness, r2=0.27 for cavity surface area, Table 3, Figure S1). Measures of cavity size were not correlated with traditional measures of trabecular microarchitecture (Table 3).
Table 1.
Characteristics of trabecular microarchitecture and resorption cavities in human lumbar vertebral trabecular bone are shown (n=9 specimens).
| Measure | Mean ± SD |
|---|---|
| Percent Eroded Surface* (ES/BS, %) | 5.10 ± 1.75 |
| Bone Volume Fraction (BV/TV, %) | 6.75 ± 2.45 |
| Bone Surface to Bone Volume Ratio (BS/BV, mm2/mm3) | 27.08 ± 4.41 |
| Trabecular Thickness (Tb.Th, μm) | 132.58 ± 22.15 |
| Trabecular Separation (Tb.Sp, μm) | 1,015.50 ± 216.52 |
| Degree of Anisotropy (DA) | 1.48 ± 0.12 |
| Structure Model Index (SMI) | 1.70 ± 0.60 |
| Connectivity Density (Conn.D, mm−3) | 4.84 ± 2.26 |
| Average Maximum Cavity Depth (Cv.De, μm) | 30.10 ± 8.56 |
| Average Surface Area per Cavity (BS/Cv, 103 μm2) | 80.60 ± 22.23 |
| Average Volume per Cavity (Cv.V, 103 μm3) | 614.16 ± 311.93 |
| Average Maximum Cavity Depth/Average Cavity Surface Area (Cv.De/BS/Cv, 10−5 μm−1) | 55.92 ± 12.00 |
| Median Maximum Cavity Depth (Cv.De, μm) | 26.31 ± 6.57 |
| Median Surface Area per Cavity (BS/Cv, 103 μm2) | 66.86 ± 25.76 |
| Median Volume per Cavity (Cv.V, 103 μm3) | 343.62 ± 195.73 |
| Average Maximum Cavity Depth/Average Local Trabecular Thickness (Cv.De/sTb.Th, %) | 30.46 ± 7.04 |
| Number of Cavities (N.Cv/BS, 1/mm2)# | 0.66 ± 0.28 |
| Number of Cavities per Unit Tissue Volume (N.Cv/TV 1/mm3)# | 1.25 ± 0.77 |
| Total Volume Occupied by Cavities (Tt.Cv.V/BV, %)# | 1.03 ± 0.53 |
measured using a grid and line intersection counts
derived from specimen averages
Figure 6.

The distribution of cavity size across the entire study is shown (cavities from all specimens pooled) for (A) Maximum cavity depth/local trabecular thickness, (B) maximum cavity depth, (C) cavity surface area and (D) cavity volume.
Table 2.
Measures of resorption cavities on rod-like trabeculae, plate-like trabeculae and nodes are shown (cavities from all specimens were pooled, median (25th percentile, 75th percentile)).
| Measure | Cavities on Rod-Like Trabeculae (n=25) | Cavities on Plate-Like Trabeculae (n=82) | Cavities on Nodes (n=99) |
|---|---|---|---|
| Maximum Cavity Depth/Local Trabecular Thickness (Cv.De/sTb.Th, %) | 21.72 (14.57, 30.55) | 31.02 (20.50, 45.73)* | |
| Maximum Cavity Depth (Cv.De, μm) | 18.74 (14.67, 26.02) | 25.04 (18.85, 35.42)* | 25.49 (17.40, 35.50)* |
| Surface Area per Cavity (BS/Cv, 103 μm2) | 46.39 (23.56, 71.67) | 71.80 (36.53, 136.45)* | 53.064 (32.09, 100.26) |
| Volume per Cavity (Cv.V, 103 μm3) | 122.69 (70.86, 372.88) | 297.40 (140.00, 891.64)* | 248.10 (99.32, 742.18) |
| Maximum Cavity Depth/Cavity Surface Area (Cv.De/BS/Cv, 10−3 μm−1) | 0.48 (0.33, 0.91) | 0.45 (0.24, 0.63) | 0.47 (0.31, 0.78) |
p < 0.05 as compared to cavities on rod-like trabeculae
Table 3.
Correlations among measures of individual cavities are shown (n=206 cavities). The upper triangle presents Spearman’s rho while the lower triangle presents the 95% confidence interval in Spearman’s rho (confidence intervals that do not include zero are considered significant).
| Max Cavity Depth/Local Trabecular Thickness (Cv.De/sTb.Th, %) | Cavity Surface Area (BS/Cv, μm2) | Cavity Volume (Cv.V, μm3) | Max Cavity Depth (Cv.De, μm) | Local Trabecular Thickness (sTb.Th, μm) | |
|---|---|---|---|---|---|
| Max Cavity Depth/Local Trabecular Thickness (Cv.De/sTb.Th, %) | 0.55* | 0.63* | 0.74* | −0.52* | |
| Cavity Surface Area (BS/Cv, μm2) | (0.38, 0.65) | 0.86* | 0.62* | 0.02 | |
| Cavity Volume (Cv.V, μm3) | (0.33, 0.62) | (0.63, 0.77) | 0.81* | 0.01 | |
| Max Cavity Depth (Cv.De, μm) | (0.46, 0.71) | (0.42, 0.62) | (0.53, 0.70) | 0.10 | |
| Local Trabecular Thickness (sTb.Th, μm) | (−0.54, −0.22) | (−0.19, 0.19) | (−0.16, 0.23) | (0.20, 0.53) |
p<0.05
A total of 72.9% of all resorption cavities measured in the study were in contact with nodes within the trabecular structure (Figure 7A). Cavities that were not entirely on nodes were more commonly located on plate-like trabeculae than on rod-like trabeculae (Figure 7A) and were most often on longitudinal trabeculae (trabeculae aligned with the primary direction of the trabecular microarchitecture) (Figure 7B).
Figure 7.

(A) Cavities were located on nodes more often than either plate-like or rodlike trabeculae. (B) The subset of cavities that were not entirely on nodes (n=105) were located on longitudinal trabeculae more often than oblique or transverse trabeculae.
4.0 DISCUSSION
The current study provides the first quantitative measures of individual resorption cavities in human cancellous bone using three-dimensional imaging. The study demonstrates that maximum cavity depth, surface area and volume are related to local trabecular microarchitecture and that cavities are located primarily on nodes within the trabecular microarchitecture.
There are a number of strengths to the current study that support our conclusions. First, measures of resorption cavities were generated by identifying the scalloped or crenated surface (a classic method of identifying eroded surfaces) as well as by observing the cavity as an indentation on the bone surface in three-dimensional images. Second, the current study provides the first measures of maximum depth of each cavity using a three-dimensional approach. The three-dimensional approach can be applied to any cavity observed in the specimen (i.e. it is not limited to certain shapes, etc.). Prior work using lamellar counting was limited to only a few cavity profiles in a two-dimensional cross-section, potentially generating a sampling bias (i.e. too few cavity profiles per specimen) [30]. Additionally, the lamellar counting approach requires assumptions regarding uniform thickness of individual lamellae. Lastly, the three-dimensional approach can provide information regarding the number of cavities and the depth of each individual cavity. As it is not possible to enumerate cavities using a two-dimensional approach (Figure 1), two-dimensional measures of resorption cavities cannot describe the breadth or volume of resorption cavities or their location in the trabecular microarchitecture (rod-like trabeculae, plate-like trabeculae etc.).
There are some limitations that must be considered in interpreting our results. First, the current method detects resorption cavities using eroded surfaces and does not identify the presence of osteoclasts or other cells when measuring maximum cavity depth and surface area. Hence the current approach should be interpreted as a measure of morphology and not a direct measure of bone resorption. When using two-dimensional approaches, it is necessary to identify pre-osteoblasts on an eroded surface to ensure that bone resorption is complete at the cross-section where cavity depth is measured [30]. However, the three dimensional approach examines the entire cavity not just a two-dimensional cross-section. The entire cavity consists of all of the eroded surface in a basic multicellular unit (BMU), including eroded surface with active resorption as well as eroded surface where the resorption is complete (presumably covered with pre-osteoblasts) [31]. When viewed in three-dimensions a resorption cavity will include eroded surface where resorption is complete except when a BMU is so new that it has not yet completed a single resorption cycle. Using existing histomorphometry data it is possible to estimate the proportion of BMUs that have not completed a resorption cycle: The active erosion period of a BMU in humans has been reported to be 42 days with an entire erosion period of 51 days [7]. Parfitt has estimated that a BMU progresses for 6–12 months [32] (the parameter has never been measured in human cancellous bone). Summing the erosion period and the period of BMU progression suggests that each BMU will display eroded surface for ~8 to 14 months). The active resorption period (42 days) corresponds to only 12–18% of the total time period that a BMU displays eroded surface. Hence, only 12–18% of all resorption cavities viewed in three-dimensions will not display eroded surface with complete resorption, and it is unlikely such a small percentage would bias our findings.
Second, the raw images had anisotropic voxels (0.7 × 0.7 × 5.0 μm). As a result, observation of resorption cavities was limited to eroded surface profiles in transverse cross-sections (with a pixel size of 0.7 × 0.7 μm). Eroded surface (ES/BS) measured in transverse cross-sections slightly differs from unbiased sampling methodology for cancellous bone, which requires longitudinal sections [6, 33]. As a result, there is the possibility that our approach under-reports cavities on transverse trabeculae because transverse trabeculae are less likely to be captured in transverse cross-sections. However, existing data suggests measurement bias from specimen orientation does not greatly influence conclusions regarding the location of cavities relative to trabecular orientation. Using morphological decomposition, Liu and colleagues have determined the average thickness and volume of bone occupied by rod- and plate-like trabeculae as well as the percentage of rod- and plate-like trabeculae with transverse orientations [29]. Using the averages reported by Liu et al., we estimate that the bone surface of transverse trabeculae constitutes only 16% of the surface in vertebral cancellous bone. If cavities were distributed uniformly across trabecular bone surfaces, we would expect ~16% of resorption cavities to be located on transverse trabeculae, a value that is similar to our observation of 11% in the current study. We therefore consider any potential measurement bias to be minor (Figure 7B).
It is useful to compare measures of resorption cavity surface area and depth made with the current three-dimensional approach with those achieved previously using two-dimensional approaches (Table 5). First, resorption cavity surface area measured in the current study (mean 0.09 mm2) is similar to the “typical” cavity size estimated from scanning electron microscopy (0.10 mm2) [13], but much larger than that measured in two-dimensional cross-sections from the iliac crest (0.003–0.004 mm2) [9, 34] (Table 5). We do not consider prior work estimating cavity surface area in two-dimensional sections to be comparable to the current study because the work did not use stereology methods capable of enumerating individual cavities and was likely biased (Figure 1) [35]. With regard to maximum cavity depth, measures of average maximum cavity depth observed in the current study are 40% smaller than the median values of erosion depth achieved using lamellar counting techniques in two-dimensional sections from the iliac crest (Table 5). Although it is possible that differences between bone remodeling in the iliac crest and vertebral body may contribute to the discrepancy, the mean and median values in our study are below the 10th percentile of that reported using lamellar counting, suggesting that the difference is likely due to measurement methods. Assumptions made using lamellar counting methods (uniform thickness of lamellae, orientation of lamellae relative to the bone surface) may explain why measures using the lamellar counting technique are greater than those determined here [10]. Two-dimensional techniques that do not use lamellar counting achieve similar measures of maximum cavity depth as the current study (Table 5) [9, 34].
Table 5.
Measures of resorption cavities made in the current study using three-dimensional approaches are shown along with those reported in prior studies using two-dimensional techniques.
| Source | Average Cavity Surface Area (mm2) | Measurement Approach | Average Maximum Cavity Depth (μm) | Measurement Approach |
|---|---|---|---|---|
| Current Study | 80.60 ± 22.23 | Serial Milling | 30.10 ± 8.56 | Three-dimensional Spline Fit (mean±SD) |
| Mosekilde 1990 [13] | 0.1 (0.001–1.00) | SEM (Estimated size and range) | NR | |
| Eriksen et al. (1990) [8] | NR | 49.1 (38.3–61.7) | Lamellar Counting (median, 10th and 90th percentiles) | |
| Garrahan et al. (1990) [9] | NR | 28.9 (23.4–39.3) | Spline fit on two-dimensional cross-section (mean with range) | |
| Croucher et al. (1991) [34] | Males: 0.004 (0.002–0.007) Females: 0.003 (0.002–0.006) |
Geometric mean and 95% range estimated from lengths of individual profiles* | Males: 35.6 (23.2–54.7) Females: 33.7 (24.4–46.6) |
Spline fit on two-dimensional cross-sections Geometric mean and 95% range estimated from lengths of individual profiles* |
| Cohen-Solal et al. (1991) [10] | NR | Control: 40.8 ± 2.0 | Manual estimation of ‘pre-resorbed surface’ | |
| Cohen-Solal et al. (1991) [10] | NR | Osteoporosis: 41.4 ± 2.0 |
In the current study we found 50% of cavities on nodes in the trabecular microarchitecture and 79% of the remaining cavities on longitudinally oriented trabeculae, primarily plate-like trabeculae. In surveys of cancellous bone from the femoral neck, Gentzsch and colleagues report a much larger percentage of cavities on rod-like trabeculae (37–38%) [36, 37]. It is unclear if the differences between our results and Gentzsch and colleagues are due to differences in skeletal region, visualization method, or sampling approach (the current study uses cross-sections to detect cavities while Gentzsch and colleagues use small specimens submitted to scanning electron microscopy).
The aspects of osteoclast biology that determine maximum cavity depth are currently unclear. It has been proposed that alterations in osteoclast lifespan through regulation of osteoclast apoptosis may modify the surface area and/or maximum depth of individual resorption cavities and remodeling sites [38–40], but as there have been few three-dimensional studies of resorption cavities the relationship between rates of osteoclast apoptosis and resorption cavity morphology are unclear. Recent studies suggest that anti-catabolic agents such as cathepsin K inhibitors may cause resorption cavities to be more shallow and smaller in surface area [41] and that glucocorticoid treatment may modify resorption cavity shape [42], suggesting that drug treatments and disease states can alter cavity shape as well as number, potentially influencing cancellous bone biomechanics and rates of bone loss. Our laboratory recently found that established estrogen depletion in rats was not associated with changes in resorption cavity surface area or maximum cavity depth [27].
Although the current study did not examine biomechanical properties, it is useful to consider the potential biomechanical implications of our observations. A simple mechanical analysis suggests that the depth and surface area of resorption cavities influence stress concentration factors and potentially cancellous bone biomechanics [20] (Figure 8). The current study found that typically maximum cavity depth is, on average, 30% of local trabecular thickness, suggesting that a typical resorption cavity may increase local tissue stresses by 2–3 times (Figure 8). However, cavities that were 40–50% of the local trabecular thickness were not unusual. Prior work using high-resolution finite element models suggests that tissue yielding occurs preferentially in longitudinally oriented plate-like trabeculae, where we observed cavities to be more common (Figure 7B) [18, 19]. A more thorough finite element analysis would be required to determine if cavity location is related to habitual stresses in cancellous bone specimens. In conclusion, we have demonstrated a method of visualizing individual resorption cavities that provides the first, three-dimensional measures of resorption cavity location, maximum depth and volume in human vertebral cancellous bone. The technique may be applied to any resorption cavity displaying an eroded surface profile in cancellous bone and can also be combined with other techniques to assess local trabecular thickness.
Figure 8.

Simple linear elastic finite element models generated with idealized cavities on (left) rod-like trabeculae and (right) plate-like trabeculae are shown [20]. The gross stress concentration factor (Ktg, maximum stress with the cavity/maximum stress without the cavity) is shown to increase as the ratio of maximum cavity depth to local trabecular thickness (referred to as d/T) increases. In rod-like trabeculae the ratio of cavity breadth to local trabecular thickness (referred to as b/T) is also shown to influence the gross stress concentration factor.
Supplementary Material
Table 4.
Correlations among measures of cavities and trabecular microarchitecture are shown (n=9 specimens). The upper triangle presents Spearman’s rho while the lower triangle presents the 95% confidence interval in rho.
| Bone Volume Fraction (BV/TV, %) | Bone Surface to Bone Volume Ratio (BS/BV, 1/mm) | Trabecular Thickness (Tb.Th, μm) | Trabecular Separation (Tb.Sp, μm) | Degree of Anisotropy (DA) | Structure Model Index (SMI) | Connectivity Density (Conn.D, mm−3) | Average Max Cavity Depth/Local Trabecular Thickness (Cv.De/sTb.Th, %) | Average Cavity Surface Area (BS/Cv, μm2) | Average Cavity Volume (Cv.V, μm3) | Average Max Cavity Depth (Cv.De, μm) | |
|---|---|---|---|---|---|---|---|---|---|---|---|
| Bone Volume Fraction (BV/TV, %) | −0.61 | 0.58 | −0.58 | −0.35 | −0.80* | 0.19 | −0.79* | 0.10 | −0.10 | −0.14 | |
| Bone Surface to Bone Volume Ratio (BS/BV, 1/mm) | (−0.91, 0.10) | −0.66 | −0.17 | 0.42 | 0.34 | 0.32 | 0.70* | −0.41 | −0.29 | −0.19 | |
| Trabecular Thickness (Tb.Th, μm) | (−0.14, 0.90) | (−.92, 0.01) | −0.17 | 0.13 | −0.27 | −0.13 | −0.73* | 0.28 | −0.12 | −0.10 | |
| Trabecular Separation (Tb.Sp, μm) | (−0.90, 0.13) | (−0.75, 0.55) | (−0.75, 0.56) | 0.21 | 0.33 | −0.30 | 0.26 | 0.29 | 0.62 | 0.49 | |
| Degree of Anisotropy (DA) | (−0.82, 0.41) | (−0.34, 0.85) | (−0.58, 0.73) | (−0.53, 0.77) | −0.01 | 0.17 | 0.13 | 0.09 | 0.11 | 0.23 | |
| Structure Model Index (SMI) | (−0.96, −0.28) | (−0.42, 0.82) | (−0.79, 0.48) | (−0.43, 0.81) | (−0.67, 0.66) | −0.44 | 0.64 | −0.08 | −0.19 | −0.12 | |
| Connectivity Density (Conn.D, mm−3) | (−0.54, 0.76) | (−0.44, 0.81) | (−0.73, 0.58) | (−0.80, 0.46) | (−0.56, 0.75) | (−0.86, 0.31) | 0.00 | −0.25 | −0.14 | −0.42 | |
| Average Max Cavity Depth/Local Trabecular Thickness (Cv.De/sTb.Th, %) | (−.95, −0.27) | (0.06, 0.93) | (−0.94, −0.13) | (−0.49, 0.79) | (−0.58, 0.73) | (−0.05, 0.91) | (−0.66, 0.67) | 0.09 | 0.18 | 0.17 | |
| Average Cavity Surface Area (BS/Cv, μm2) | (−0.61, 0.71) | (−0.84, 0.35) | (−0.47, 0.80) | (−0.46, 0.80) | (−0.61, 0.71) | (−0.71, 0.62) | (−0.78, 0.50) | (−0.61, 0.71) | 0.80* | 0.76* | |
| Average Cavity Volume (Cv.V, μm3) | (−0.72, 0.60) | (−0.80, 0.46) | (−0.73, 0.59) | (−0.07, 0.91) | (−0.60, 0.72) | (−0.76, 0.54) | (−0.74, 058) | (−0.55, 0.75) | (0.29, 0.96) | 0.89* | |
| Average Max Cavity Depth (Cv.De, μm) | (−0.73, 0.58) | (−0.76, 0.54) | (−0.72, 0.61) | (−0.25, 0.87) | (−0.51, 0.78) | (−0.73, 0.59) | (−0.85, 0.34) | (−0.56, 0.75) | (0.20, 0.95) | (0.57, 0.98) |
p<0.05
Highlights.
The first 3D measures of resorption cavities in human cancellous bone are presented.
Resorption cavities have an average maximum depth of 30 micrometers.
Resorption cavities are located primarily at intersections of trabeculae (nodes).
Resorption cavities are larger on plate-like trabeculae than rod-like trabeculae.
Resorption cavity size is related to location in the trabecular microstructure.
Acknowledgments
Supported by NIH/NIAMS R01 AR057362 (PI Hernandez).
Authors’ roles: Study design: MGG, CRS, SRK, and CJH. Specimen Acquisition: IHY, MGJ, and TMK. Image collection and analysis: CRS, EVT, SEF and CJH Statistical Analysis: MGG and CJH. Drafting manuscript: MGG, CRS and CJH. Revising manuscript content: MGG, CRS and CJH. Approving final version of manuscript: CRS, EVT, SEF, IHY, MGJ, TMK, and CJH. MGG and CJH take responsibility for the integrity of the data analysis.
7.0 APPENDIX
Cavity depth is determined by estimating the pre-resorbed surface using a thin plate smoothing spline [27]. A curve fit using a thin plate smoothing spline provides a smooth, continuous curve spanning a void on a three-dimensional surface. The technique is commonly used in image processing [25, 26]. In the current study, the thin plate smoothing spline curve fit is created through interpolation from the bone surface surrounding the cavity. In our implementation, we use the Lagrangian boundary conditions, which constrain the position and angle of the thin plate smoothing spline fit to match the bone surface surrounding the cavity.
To test the accuracy of the approach we devised test shapes of controlled geometry spanning a range of surface curvatures. The three test shapes were a hyperboloid, a cylinder and a hemispherical cap (Figure A1). These three test shapes represent a range of Gaussian curvature: the hyperboloid has a negative Gaussian curvature, the cylinder has a zero Gaussian curvature and the spherical cap has a positive Gaussian curvature [43]. Spherical cavities were added digitally to each test shape (Figure A1). Three different cavity sizes were examined, ranging in size from 25% to 75% of the convex radius of the original shape. The depth of the cavity was then determined using the thin plate smoothing spline technique (Figure A1). The measurement error was calculated using the following equation:
where Measured Depth is the distance measured using the automated cavity depth program and Actual Depth is the actual depth of the cavity generated on the test image. We observed a measurement error of less than 12% (Figure A2). For cavities on cylindrical and spherical cap surfaces, the measurement error was an overestimation except for the 75% cavity size case. For cavities on the hyperboloid, the measurement error was an underestimation.
Figure A1.

Three dimensional test shapes used to benchmark cavity depth measurements included (A) a hyperboloid, (B) a cylinder, and (C) a spherical cap. Spherical cavities were added to the shape (right). The thin plate smoothing spline fit over the cavity estimated the surface of the test shape that was removed by the cavity.
Figure A2.

The measurement error for cavities added to the test shapes is shown. Three different cavity sizes were simulated, ranging in size from 25% to 75% of the convex radius of each test shape.
Footnotes
Publisher's Disclaimer: This is a PDF file of an unedited manuscript that has been accepted for publication. As a service to our customers we are providing this early version of the manuscript. The manuscript will undergo copyediting, typesetting, and review of the resulting proof before it is published in its final citable form. Please note that during the production process errors may be discovered which could affect the content, and all legal disclaimers that apply to the journal pertain.
References
- 1.Garnero P, Hausherr E, Chapuy MC, Marcelli C, Grandjean H, Muller C, Cormier C, Breart G, Meunier PJ, Delmas PD. Markers of bone resorption predict hip fracture in elderly women: the EPIDOS Prospective Study. J Bone Miner Res. 1996;11:1531–8. doi: 10.1002/jbmr.5650111021. [DOI] [PubMed] [Google Scholar]
- 2.Garnero P. Markers of bone turnover for the prediction of fracture risk. Osteo Int. 2000;11 (Suppl 6):S55–65. doi: 10.1007/s001980070006. [DOI] [PubMed] [Google Scholar]
- 3.Dempster DW. The contribution of trabecular architecture to cancellous bone quality. J Bone Miner Res. 2000;15:20–3. doi: 10.1359/jbmr.2000.15.1.20. [DOI] [PubMed] [Google Scholar]
- 4.Parfitt AM. High bone turnover is intrinsically harmful: two paths to a similar conclusion. The Parfitt view J Bone Miner Res. 2002;17:1558–9. doi: 10.1359/jbmr.2002.17.8.1558. [DOI] [PubMed] [Google Scholar]
- 5.Kragstrup J, Gundersen HJ, Melsen F, Mosekilde L. Estimation of the three-dimensional wall thickness of completed remodeling sites in iliac trabecular bone. Metab Bone Dis Relat. 1982;4:113–9. doi: 10.1016/0221-8747(82)90024-8. [DOI] [PubMed] [Google Scholar]
- 6.Parfitt AM, Drezner MK, Glorieux FH, Kanis JA, Malluche H, Meunier PJ, Ott SM, Recker RR. Bone histomorphometry: standardization of nomenclature, symbols, and units. Report of the ASBMR Histomorphometry Nomenclature Committee. J Bone Miner Res. 1987;2:595–610. doi: 10.1002/jbmr.5650020617. [DOI] [PubMed] [Google Scholar]
- 7.Eriksen EF, Melsen F, Mosekilde L. Reconstruction of the resorptive site in iliac trabecular bone: a kinetic model for bone resorption in 20 normal individuals. Metab Bone Dis Relat. 1984;5:235–42. doi: 10.1016/0221-8747(84)90065-1. [DOI] [PubMed] [Google Scholar]
- 8.Eriksen EF, Hodgson SF, Eastell R, Cedel SL, O’Fallon WM, Riggs BL. Cancellous bone remodeling in type I (postmenopausal) osteoporosis: quantitative assessment of rates of formation, resorption, and bone loss at tissue and cellular levels. J Bone Miner Res. 1990;5:311–9. doi: 10.1002/jbmr.5650050402. [DOI] [PubMed] [Google Scholar]
- 9.Garrahan NJ, Croucher PI, Compston JE. A computerised technique for the quantitative assessment of resorption cavities in trabecular bone. Bone. 1990;11:241–5. doi: 10.1016/8756-3282(90)90076-b. [DOI] [PubMed] [Google Scholar]
- 10.Cohen-Solal ME, Shih MS, Lundy MW, Parfitt AM. A new method for measuring cancellous bone erosion depth: application to the cellular mechanisms of bone loss in postmenopausal osteoporosis [see comments] J Bone and Miner Res. 1991;6:1331–1338. doi: 10.1002/jbmr.5650061210. [DOI] [PubMed] [Google Scholar]
- 11.Recker RR, Kimmel DB, Dempster D, Weinstein RS, Wronski TJ, Burr DB. Issues in modern bone histomorphometry. Bone. 2011;49:955–64. doi: 10.1016/j.bone.2011.07.017. [DOI] [PMC free article] [PubMed] [Google Scholar]
- 12.Dempster DW, Shane E, Horbert W, Lindsay R. A simple method for correlative light and scanning electron microscopy of human iliac crest bone biopsies: qualitative observations in normal and osteoporotic subjects. J Bone Miner Res. 1986;1:15–21. doi: 10.1002/jbmr.5650010105. [DOI] [PubMed] [Google Scholar]
- 13.Mosekilde L. Consequences of the remodelling process for vertebral trabecular bone structure: a scanning electron microscopy study (uncoupling of unloaded structures) Bone Miner. 1990;10:13–35. doi: 10.1016/0169-6009(90)90046-i. [DOI] [PubMed] [Google Scholar]
- 14.Gentzsch C, Junge M, Pueschel K, Delling G, Kaiser E. A scanning electron microscopy-based approach to quantify resorption lacunae applied to the trabecular bone of the femoral head. J Bone Miner Metab. 2005;23:205–11. doi: 10.1007/s00774-004-0585-0. [DOI] [PubMed] [Google Scholar]
- 15.Boyde A, Dillon CE, Jones SJ. Measurement of osteoclastic resorption pits with a tandem scanning microscope. J Microsc. 1990;158 (Pt 2):261–5. doi: 10.1111/j.1365-2818.1990.tb02999.x. [DOI] [PubMed] [Google Scholar]
- 16.Boyde A, Jones SJ. Pitfalls in pit measurement. Calcif Tissue Int. 1991;49:65–70. doi: 10.1007/BF02565123. [DOI] [PubMed] [Google Scholar]
- 17.Parfitt AM. The physiologic and clinical significance of bone histomorphometric data. In: Recker RR, editor. Bone histomorphometry: techniques and interpretation. Boca Raton, FL: CRC Press; 1983. pp. 143–223. [Google Scholar]
- 18.Liu XS, Bevill G, Keaveny TM, Sajda P, Guo XE. Micromechanical analyses of vertebral trabecular bone based on individual trabeculae segmentation of plates and rods. J Biomech. 2009;42:249–56. doi: 10.1016/j.jbiomech.2008.10.035. [DOI] [PMC free article] [PubMed] [Google Scholar]
- 19.Shi X, Liu XS, Wang X, Guo XE, Niebur GL. Effects of trabecular type and orientation on microdamage susceptibility in trabecular bone. Bone. 2010;46:1260–6. doi: 10.1016/j.bone.2010.02.005. [DOI] [PMC free article] [PubMed] [Google Scholar]
- 20.Kummari SR, Coan TA, Hernandez CJ. Trans. Orthopaedic Research Society; Long Beach, CA, USA: 2011. Stress concentration factors of Remodeling Cavities on Rod-like and Plate-like Trabeculae; p. 2200. [Google Scholar]
- 21.Bigley RF, Singh M, Hernandez CJ, Kazakia GJ, Martin RB, Keaveny TM. Validity of serial milling-based imaging system for microdamage quantification. Bone. 2008;42:212–5. doi: 10.1016/j.bone.2007.09.043. [DOI] [PubMed] [Google Scholar]
- 22.Kazakia GJ, Lee JJ, Singh M, Bigley RF, Martin RB, Keaveny TM. Automated high-resolution three-dimensional fluorescence imaging of large biological specimens. J Microsc. 2007;225:109–17. doi: 10.1111/j.1365-2818.2007.01721.x. [DOI] [PubMed] [Google Scholar]
- 23.Slyfield CR, Jr, Niemeyer KE, Tkachenko EV, Tomlinson RE, Steyer GG, Patthanacharoenphon CG, Kazakia GJ, Wilson DL, Hernandez CJ. Three-dimensional surface texture visualization of bone tissue through epifluorescence-based serial block face imaging. J Microsc. 2009;236:52–9. doi: 10.1111/j.1365-2818.2009.03204.x. [DOI] [PMC free article] [PubMed] [Google Scholar]
- 24.Tkachenko EV, Slyfield CR, Tomlinson RE, Daggett JR, Wilson DL, Hernandez CJ. Voxel size and measures of individual resorption cavities in three-dimensional images of cancellous bone. Bone. 2009;45:487–492. doi: 10.1016/j.bone.2009.05.019. [DOI] [PMC free article] [PubMed] [Google Scholar]
- 25.Carr JC, Fright WR, Beatson RK. Surface interpolation with radial basis functions for medical imaging. IEEE T Med Imaging. 1997;16:96–107. doi: 10.1109/42.552059. [DOI] [PubMed] [Google Scholar]
- 26.Buckley MJ. Fast Computation of a Discretized Thin-Plate Smoothing Spline for Image Data. Biometrika. 1994;81:247–258. [Google Scholar]
- 27.Slyfield CR, Tkachenko EV, Wilson DL, Hernandez CJ. Three-dimensional dynamic bone histomorphometry. J Bone Miner Res. 2011 doi: 10.1002/jbmr.553. [DOI] [PMC free article] [PubMed] [Google Scholar]
- 28.Doube M, Klosowski MM, Arganda-Carreras I, Cordelieres FP, Dougherty RP, Jackson JS, Schmid B, Hutchinson JR, Shefelbine SJ. BoneJ Free and extensible bone image analysis in ImageJ. Bone. 2010;47:1076–1079. doi: 10.1016/j.bone.2010.08.023. [DOI] [PMC free article] [PubMed] [Google Scholar]
- 29.Liu XS, Sajda P, Saha PK, Wehrli FW, Bevill G, Keaveny TM, Guo XE. Complete volumetric decomposition of individual trabecular plates and rods and its morphological correlations with anisotropic elastic moduli in human trabecular bone. J Bone Miner Res. 2008;23:223–35. doi: 10.1359/JBMR.071009. [DOI] [PMC free article] [PubMed] [Google Scholar]
- 30.Compston JE, Croucher PI. Histomorphometric assessment of trabecular bone remodelling in osteoporosis. Bone Miner. 1991;14:91–102. doi: 10.1016/0169-6009(91)90086-f. [DOI] [PubMed] [Google Scholar]
- 31.Parfitt AM. Osteonal and hemi-osteonal remodeling: the spatial and temporal framework for signal traffic in adult human bone. J Cell Biochem. 1994;55:273–86. doi: 10.1002/jcb.240550303. [DOI] [PubMed] [Google Scholar]
- 32.Parfitt AM. Osteonal and Hemi-Osteonal Remodeling - the Spatial and Temporal Framework for Signal Traffic in Adult Human Bone. J Cell Biochem. 1994;55:273–286. doi: 10.1002/jcb.240550303. [DOI] [PubMed] [Google Scholar]
- 33.Vesterby A, Kragstrup J, Gundersen HJ, Melsen F. Unbiased stereologic estimation of surface density in bone using vertical sections. Bone. 1987;8:13–7. doi: 10.1016/8756-3282(87)90126-8. [DOI] [PubMed] [Google Scholar]
- 34.Croucher PI, Garrahan NJ, Mellish RW, Compston JE. Age-related changes in resorption cavity characteristics in human trabecular bone. Osteoporosis Int. 1991;1:257–61. doi: 10.1007/BF03187471. [DOI] [PubMed] [Google Scholar]
- 35.Hauge EM, Mosekilde L, Melsen F. Stereological considerations concerning the measurement of individual osteoid seams and resorption cavities. Bone Miner. 1994;26:89–90. doi: 10.1016/s0169-6009(08)80165-1. [DOI] [PubMed] [Google Scholar]
- 36.Gentzsch C, Delling G, Kaiser E. Microstructural classification of resorption lacunae and perforations in human proximal femora. Calcif Tissue Int. 2003;72:698–709. doi: 10.1007/s00223-002-2020-7. [DOI] [PubMed] [Google Scholar]
- 37.Gentzsch C, Pueschel K, Deuretzbacher G, Delling G, Kaiser E. First inventory of resorption lacunae on rods and plates of trabecular bone as observed by scanning electron microscopy. Calcified Tissue Int. 2005;76:154–62. doi: 10.1007/s00223-004-0212-z. [DOI] [PubMed] [Google Scholar]
- 38.Parfitt AM, Mundy GR, Roodman GD, Hughes DE, Boyce BF. A new model for the regulation of bone resorption, with particular reference to the effects of bisphosphonates. J Bone Miner Res. 1996;11:150–9. doi: 10.1002/jbmr.5650110203. [DOI] [PubMed] [Google Scholar]
- 39.Riggs BL, Parfitt AM. Drugs used to treat osteoporosis: the critical need for a uniform nomenclature based on their action on bone remodeling. J Bone Miner Res. 2005;20:177–84. doi: 10.1359/JBMR.041114. [DOI] [PubMed] [Google Scholar]
- 40.Parfitt AM. Skeletal heterogeneity and the purposes of bone remodeling. In: Marcus R, Feldman D, Nelson DA, Rosen CJ, editors. Osteoporosis. 3. San Diego, CA, USA: Elsevier Academic Press; 2008. pp. 71–92. [Google Scholar]
- 41.Leung P, Pickarski M, Zhuo Y, Masarachia PJ, Duong LT. The effects of the cathepsin K inhibitor odanacatib on osteoclastic bone resorption and vesicular trafficking. Bone. 2011;49:623–35. doi: 10.1016/j.bone.2011.06.014. [DOI] [PubMed] [Google Scholar]
- 42.Soe K, Delaisse JM. Glucocorticoids Maintain Human Osteoclasts in the Active Mode of Their Resorption Cycle. J Bone Min Res. 2010;25:2184–2192. doi: 10.1002/jbmr.113. [DOI] [PubMed] [Google Scholar]
- 43.Jinnai H, Watashiba H, Kajihara T, Nishikawa Y, Takahashi M, Ito M. Surface curvatures of trabecular bone microarchitecture. Bone. 2002;30:191–194. doi: 10.1016/s8756-3282(01)00672-x. [DOI] [PubMed] [Google Scholar]
Associated Data
This section collects any data citations, data availability statements, or supplementary materials included in this article.