Abstract
Arachidonic acid (20:4Δ5,8,11,14, AA)-derived eicosanoids regulate inflammation and promote cancer development. Previous studies have targeted prostaglandin enzymes in an attempt to modulate AA metabolism. However, due to safety concerns surrounding the use of pharmaceutical agents designed to target Ptgs2 (cyclooxygenase 2) and its downstream targets, it is important to identify new targets upstream of Ptgs2. Therefore, we determined the utility of antagonizing tissue AA levels as a novel approach to suppressing AA-derived eicosanoids. Systemic disruption of the Fads1 (Δ5 desaturase) gene reciprocally altered the levels of dihomo-γ-linolenic acid (20:3Δ8,11,14, DGLA) and AA in mouse tissues, resulting in a profound increase in 1-series-derived and a concurrent decrease in 2-series-derived prostaglandins. The lack of AA-derived eicosanoids, e.g., PGE2, was associated with perturbed intestinal crypt proliferation, immune cell homeostasis, and a heightened sensitivity to acute inflammatory challenge. In addition, null mice failed to thrive, dying off by 12 weeks of age. Dietary supplementation with AA extended the longevity of null mice to levels comparable to wild-type mice. We propose that this new mouse model will expand our understanding of how AA and its metabolites mediate inflammation and promote malignant transformation, with the eventual goal of identifying new drug targets upstream of Ptgs2.
Keywords: dihomo-γ-linolenic acid, eicosanoids, fatty acid desaturase 1, prostaglandin, colon, cell proliferation, T cells
Prostaglandins of the 2-series (e.g., PGE2) found in high abundance in colorectal tissue, are downstream products of cyclooxygenase-2 (Ptgs2). A significant increase in Ptgs2 gene expression has been shown to promote PGE2-dependent colon cancer development, in part by enhancing cell proliferation and repressing protective proapoptotic signaling pathways (1, 2). Recent controversies associated with the role of aspirin and other Ptgs2 inhibitors indicate that more work is needed to elucidate the effects of PGE2 in cancer initiation, progression, and metastasis (3). The preferred substrate for cyclooxygenase catalysis of either Ptgs1 or Ptgs2 is arachidonic acid (20:4Δ5,8,11,14, AA) (4). AA is derived metabolically from linoleic acid (18:2Δ9,12, LA), the major polyunsaturated fatty acid (PUFA) in the diet. Dietary LA is the major source of tissue dihomo-γ-linolenic acid (20:3Δ8,11,14, DGLA) and AA, and its metabolism is regulated by the complementary action of fatty acid desaturases (Fads1 and Fads2) (5) (see supplementary Fig. I). In addition to LA, dietary AA can contribute to tissue AA levels. However, compared with the dietary intake of LA (10–20 g/day), AA intake (100–500 mg/day) is a very minor contributor (6).
AA-derived eicosanoids, including PGE2, function as mediators of immune inflammation. Despite the traditional belief that PGE2 acts as an immunosuppressant based on its inhibition of T-cell activation and cytokine [tumor necrosis factor (TNF)α, interleukin (IL)-12] production in vitro (7), PGE2 has now emerged as an immunoactivator, which facilitates Th1 differentiation and Th17 cell expansion, two T-cell subsets involved in adaptively mediated inflammation (8). Therefore, PGE2 has the ability to influence the cytokine microenvironment, thereby skewing naïve T-cell differentiation, and ultimately function, toward inflammatory T-cell subsets. For example, it has been reported that PGE2 propagates inflammatory bowel disease (IBD) by enhancing the development and function of IL-17-producing Th17 cells (9). In addition to its role in cytokine regulation, AA is a major constituent of phosphatidylinositol 4,5-bisphosphate (PI(4,5)P2), and via the action of phospholipase C, results in the accumulation of inositol trisphosphate (IP3) and 1-stearoyl-2-AA-diacylglycerol to elicit intracellular Ca2+ mobilization (10). The hydrolysis of PI(4,5)P2 plays an important role in membrane rapid cytoskeletal remodeling (11) and Ras/Erk, as well as Ca2+ signaling in lymphocytes (12).
Most studies have targeted prostaglandin biosynthetic and degradation enzymes in an attempt to suppress AA-derived eicosanoid-mediated inflammation and tumor-promoting action (13). Surprisingly, no investigators to date have attempted to target AA (substrate levels) as a way of modulating prostaglandin biosynthesis and tumor development. The controversies associated with the role of aspirin and Ptgs inhibitors indicate that more work is needed to elucidate the effects of eicosanoids in colon cancer and inflammatory diseases (3). Therefore, we generated a novel genetic model, i.e., the Fads1 (Δ5 desaturase) knockout mouse, to determine the role of AA-derived 2-series eicosanoids in mucosal physiology and inflammation. This model allows for the specific investigation of AA deficiency without the underlying complications of essential fatty acid (LA and DGLA) deficiency.
MATERIALS AND METHODS
Generation of Fads1 null mice
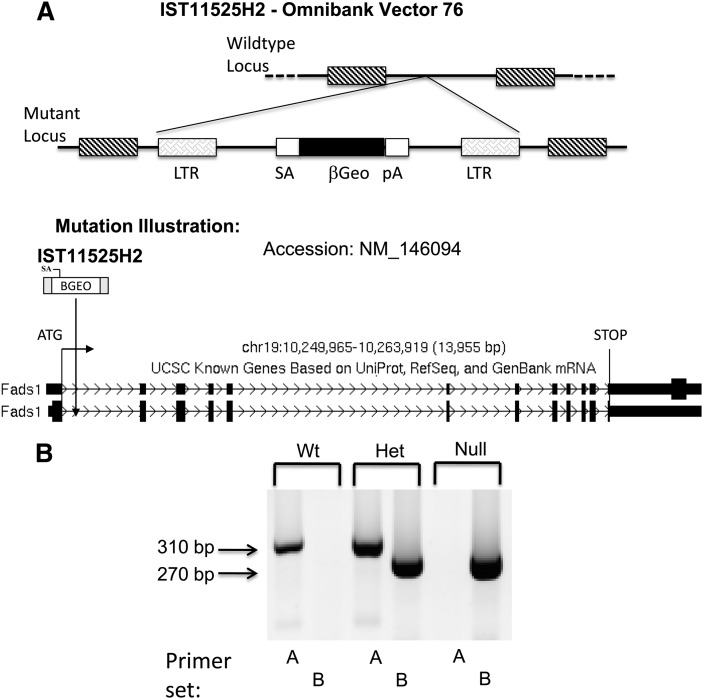
Mutant Fads1 mice were generated using a gene-trapping technique (14). Mice (strain C57BL/6) were cloned from an ES cell line (IST11525H2; Texas Institute for Genomic Medicine, TIGM). The ES cell clone contained a retroviral insertion in the Fads1 gene identified from the TIGM gene trap database, and was microinjected into C57BL/6 host blastocysts to generate germline chimeras using standard procedures. The retroviral OmniBank Vector 76 (Fig. 1) contained a splice acceptor sequence (SA) followed by a 5′ selectable marker β-geo, a functional fusion between the β-galactosidase and neomycin resistance genes, for identification of successful gene trap events followed by a polyadenylation signal (pA). Insertion of the retroviral vector into the Fads1 gene led to the splicing of the endogenous upstream exons into this cassette to produce a fusion transcript that was used to generate a sequence tag (OST) of the trapped gene by 3′ RACE (15). Chimeric males were bred to C57BL/6 females for germline transmission of the mutant Fads1 allele.
Fig. 1.
Genotyping of Fads1 knockout mice. (A) Mice were cloned from an embryonic stem cell line (IST11525H2) carrying the Fads1 allele disrupted by the insertion of a gene trap vector (Omnibank Vector 76) in the first intron. The insertion disrupts transcription of the gene. (B) DNA isolated from mouse tail was genotyped by PCR. Fads1 gene product (310 bp) was found only in Wt and Het mice; V76 (Omnibank Gene Trap Vector 76) gene product (270 bp) was found only in Het and Null mice. Refer to Materials and Methods for primer sets and details describing the gene trapping technique.
Animals and diets
Three genotypes [wild-type (Wt), heterozygous (Het) and null (Null)] of Fads1 mice were derived from heterozygous males and females. All procedures followed the guidelines approved by Public Health Service and the Institutional Animal Care and Use Committee at Texas A&M University. All animals were fed commercial 10% safflower oil diet (D03092902R; Research Diets), free of AA. In a separate experiment, the basal 10% safflower oil diet was supplemented with ARASCO oil (containing 42% AA, w/w) to determine the effect of dietary AA on the life span of Null mice.
Genotype/phenotype
Mice were screened after weaning at the age of 3–4 weeks. For genotyping, tail snip DNA was extracted using a Qiagen DNeasy blood and tissue kit (cat# 69506). PCR was performed to determine the presence of the gene trap using Hot Start Taq Mastermix (#CB4030-3; Denville Scientific) (16). Primers (Fads1 band, 310 bp product, 5′-CGTGCTTTGCCTCTGGAGTCTCA-3′, 5′-CGACTCCAACTGCAAGCTGTC T-3′ Gene Trap Vector 76, 270 bp product, 5′-CTTGCAAAATGGCGTTACTTAAGC-3′, 5′-CCAATAAACCCTCTTCGAGTTGC-3′). For phenotyping, total lipids were extracted from 0.5 cm mouse tail using the method of Folch et al. (17) and transesterified in 6% methanolic HCl. Fatty acid methyl esters were subsequently analyzed by capillary gas chromatography as previously described (18).
Real-time PCR
Fads1 and Fads2 mRNA expression levels in colon mucosa and liver were determined by real-time PCR on an ABI 7900 instrument. cDNA was synthesized from 2 μg total RNA using random hexamers and oligo(dT) primers with Superscript II RT (Invitrogen). PCR was performed (primer sequences available online) using predeveloped Taqman assays (Applied Biosystems). Expression levels were normalized to ribosomal 18S expression using assay kits from Applied Biosystems (cat# Mm00507605 for Fads1, Mm00517221 for Fads2, and Mm03928990 for 18S).
Measurement of total phospholipid fatty acid composition
Total lipids in colon mucosa, liver, splenocytes, and serum were extracted by the method of Folch (17). Total phospholipids were separated by one-dimensional thin-layer chromatography on silica gel 60 G plates using chloroform/methanol/acetic acid/water (90:8:1:0.8, v/v/v/v) as the developing solvent. Isolated total phospholipids were transesterified in 6% methanolic HCl overnight, followed by GC analysis as previously described (18).
Eicosanoid analysis
Eicosanoids were extracted from colonic mucosa, small intestine mucosa, and lung using a previously described method (19, 20). Briefly, snap-frozen tissues were ground to a fine powder and homogenized with an Ultrasonic Processor (Misonix). An aliquot of homogenate was subjected to extraction with hexane/ethyl acetate (1:1). The upper organic layer was collected, and the organic phases from three extractions were pooled and then evaporated to dryness under a stream of nitrogen. All extraction procedures were performed at minimum light levels at 4°C. Samples were then reconstituted in 100 μl of methanol/10 mmol/l ammonium acetate buffer, pH 8.5 (50:50, v/v), before liquid chromatography/tandem mass spectroscopic analysis. Protein concentration was determined by the method of Bradford according to the manufacturer's instructions (Pierce). Liquid chromatography/tandem mass spectroscopic analyses were performed using a QuattroUltima mass spectrometer (Waters) equipped with an Agilent 1100 binary pump high-performance liquid chromatography system (Agilent) using a modified version of the method of Yang et al. (19). Eicosanoids of interest were chromatographically separated using a Luna 3 μm phenyl-hexyl 4.6 × 100 mm analytic column (Phenomenex). The mobile phase consisted of 10 mmol/l ammonium acetate (pH 8.5) and methanol using a linear methanol gradient consisting of 50% to 60% in 10 min, and then from 60% to 80% in 4 min. This was then increased to 100% methanol concentration over the next 6 min and kept at this condition for an additional 2 min to achieve chromatographic baseline resolution. The flow rate was 0.5 ml/min with a column temperature of 60°C. The mass spectrometer was operated in negative electrospray ionization mode with a cone voltage of 40 V. Source temperatures were 125°C with a desolvation gas temperature at 350°C. Collision-induced dissociation of the eicosanoids was performed using argon gas at a cell pressure of 1.6 × 10⁻³ Torr. Eicosanoids were detected and quantified by multiple reaction mode monitoring of the transitions m/z 351→271 for AA-derived PGE2 and m/z 353→317 for DGLA-derived PGE1 (21).
Analysis of colonic cell proliferation
In vivo colonic cell proliferation was determined by immunohistochemical detection. Mice were intraperitoneally injected with 5-ethynyl-2´-deoxyuridine (EdU, 30 mg/kg body weight) 2 h prior to termination. One centimeter of distal colon was removed, fixed in 4% paraformaldehyde, followed by a series of ethanol washes, and embedded in paraffin. The incorporation of EdU into DNA of actively dividing cells was determined using a commercially available kit (Click-iT EdU Alexa Fluor 647 Imaging Kit; Invitrogen). Briefly, after deparaffinization, samples were washed in 3% BSA in PBS, treated with 0.5% Triton in PBS for 20 min, washed again with 3% BSA in PBS, then incubated with Click-It reaction cocktail for 30 min. Coupling of EdU to the Alexa fluor substrate was then observed using fluorescence microscopy (22).
Polyphosphoinositide (PI(4,5)P2) analysis
Spleens were removed aseptically, and CD4+ T cells were isolated by positive selection using magnetic CD4 (L3T4) microbeads according to the manufacturer's protocol (Miltenyi Biotec). Cells (5 × 10⁵) were washed with cold 1× PBS, and then pelleted at 4,000 g for 5 min at 4°C. Supernatant was removed, and the pellet was resuspended in 800 μl of 1:1 methanol:CHCl3. The mixture was vortexed for 1 min, and then centrifuged at 7,500 g for 5 min at 4°C. The supernatant was discarded, and pellets resuspended in 400 μl of 80:40:0.3 methanol:CHCl3:HCl. The mixture was vortexed for 5 min and subsequently centrifuged at 3,000 g for 1 min at 4°C. An additional 80 μl of 1 N HCl was added to the extract and vortexed for 15 s prior to centrifugation at 18,000 g for 15 s at 4°C. The organic layer was collected and dried under a stream of N2. The lipid film was dissolved in 1× PBS supplemented with 0.0025% of protein stabilizer (Echelone Biosciences) and used for detection of PI(4,5)P2. PI(4,5)P2 dissolved in 1× PBS supplemented with 0.0025% protein stabilizer was added in duplicate into 96-well flat-bottom plates and incubated at room temperature for 2 h. The wells were then washed with 1× PBS three times, and then blocked in 5% BSA in PBS overnight at 4°C. The wells were again washed with 1× PBS three times, and then incubated with primary mouse anti-PI(4,5)P2 (Abcam) in blocking solution at a dilution of 1:2500 for 1.5 h at room temperature. The wells were washed with 1× PBS and incubated with secondary goat anti-mouse IgG labeled with horseradish peroxidase (KPL, Gaithersburg, MD) in blocking solution at a dilution of 1:5,000 for 1 h at room temperature and protected from light. This was followed by incubation in TMB high-sensitivity substrate solution (BioLegend) for 5 min at room temperature and protected from light. The reaction was stopped by the addition of 1 N H2SO4, and the absorbance was read at 450 nm. A standard curve was generated with known concentrations of PI(4,5)P2 (Echelon Biosciences). To test the cross-reactivity of the primary antibody, 50 pmol of PI(4)P and PI(3,4,5)P3 (Avanti) were dissolved in 1× PBS supplemented with 0.0025% protein stabilizer, added into separate wells, and subjected to the same ELISA protocol as described. No detectable signals were observed (data not shown). In addition, ELISA data were validated by mass spectrometry (23).
Characterization of immune cell populations
A single-cell suspension was produced by combining spleen and mesenteric and inguinal lymph nodes, which were pushed through a sterile stainless-steel wire screen (100 mesh) and resuspended in RPMI 1640 medium with 25 mmol/l HEPES (Irvine Scientific), supplemented with 10% fetal bovine serum (FBS, Irvine Scientific), 2 mmol/l GlutaMAX (Gibco), penicillin 100 U/ml, and streptomycin 0.1 mg/ml (Gibco); henceforth, “complete medium.” Subsequently, a mononuclear cell suspension was produced by density gradient centrifugation using Lympholyte-M (Cedarlane Laboratories). Cell numbers were determined using a hemocytometer, and viability assessed by trypan blue exclusion always exceeded 96% in each genotype. The T-cell compartment was identified by surface expression of CD3, and the antigen-presenting cell (APC) compartment was identified by surface expression of major histocompatibility complex (MHC) class II (i.e., I-A[b]). For this purpose, 106 viable mononuclear cells were incubated for 10 min with a FcγR-blocking monoclonal antibody (1 μg/ml) (2.4G2; BD Pharmingen) on ice and were subsequently stained with either 1 μg/ml of PE-anti-mouse I-A[b] (clone AF6-1201; BD Bioscience) or 1 μg/ml of APC-anti-mouse CD3α (clone 145-2C11; eBioscience) antibodies for 30 min. Flow cytometric analysis was conducted using an Accuri C6 flow cytometer (Accuri Cytometers).
In vitro stimulation of mononuclear cells and measurement of cytokine production
Using 96-well Falcon plates (#3072; Becton-Dickinson), 5 × 10⁵ viable mononuclear cells were added to each well in a final volume of 200 μl of complete RPMI. Cell cultures were either unstimulated (complete RPMI alone) or stimulated under various conditions, namely, 5 μg/ml of plate-bound anti-CD3 (clone 145-2C11; BD Bioscience) plus 20 μg/ml of soluble anti-CD28 (clone 37.51; eBioscience), 10 μg/ml LPS (E. coli 055:B5; Sigma Aldrich) or 10 μg/ml anti-CD40 (clone 1C10; eBioscience). All cultures were incubated at 37°C for 24 h, and then supernatants from similarly treated culture wells were pooled together and subsequently aliquoted for storage at −80°C. Under each stimulation condition, in vitro cytokine production of IL-1β, IL-4, IL-6, IL-10, IL-12p70, IL-17A, gamma-interferon (IFNγ), and TNFα were simultaneously measured utilizing the Bio-Plex Pro Mouse Cytokine Group I multiplex kit (Bio-Rad) and the Bio-Plex 200 System and accompanying software package, Bio-Plex Manager 6.0 (Bio-Rad).
Colitis induction
Animals were exposed to dextran sodium sulfate (DSS, molecular weight, 36,000–50,000; MP Biomedicals) treatment as previously described (24, 25). To induce intestinal inflammation, 2.5% DSS was administered in the drinking water for 5 days, followed by 14 days of tap water.
Histological scoring
Various tissues (brain, heart, lung, liver, kidney, stomach, colon, and small intestine) were removed, fixed in 10% neutral buffered formalin and paraffin embedded. Sections were stained with hematoxylin and eosin. Histological examination was performed in a blinded manner by a board-certified pathologist (B. Weeks), and the degree of inflammation (score, 0–3) and epithelial injury (score, 0–3) in microscopic cross-sections of the tissues was graded as described previously (20).
Statistical analysis
Data were analyzed using two-way ANOVA. Differences of P < 0.05 were considered significant.
RESULTS
Targeted deletion of Fads1 in mice
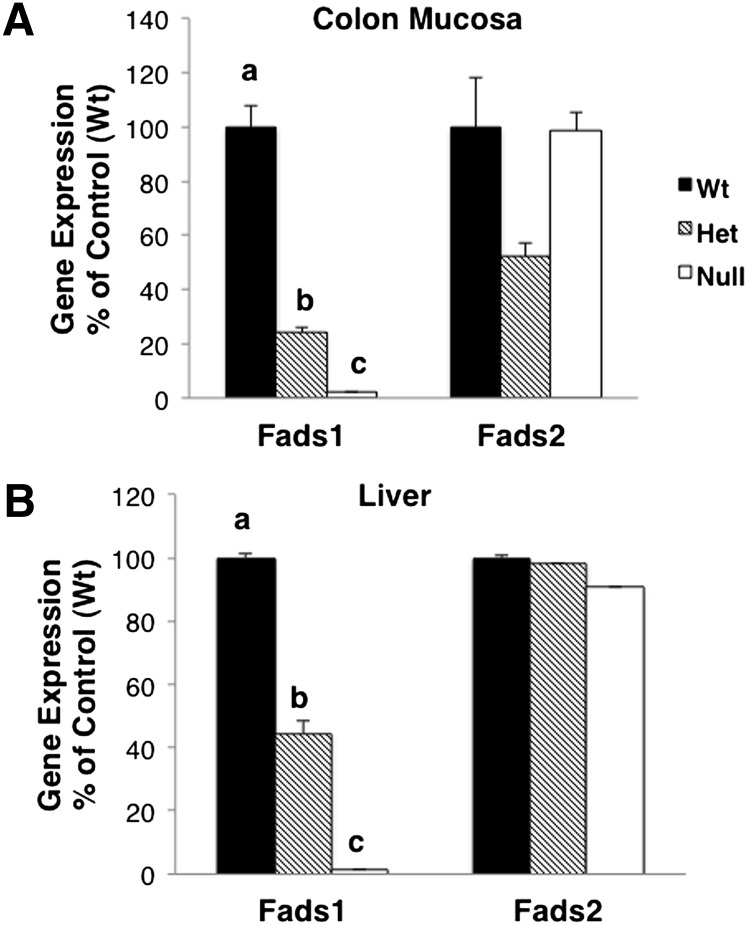
Fads1 knockout mice were generated by a gene-trapping technique described in Materials and Methods. Tail DNA was genotyped by PCR. As shown in Fig. 1, Fads1 gene product (310 bp) was only detected in Wt and Het animals, whereas the gene trap product (270 bp) was amplified in both Null and Het animals. To confirm that targeted deletion resulted in the anticipated reduction in Δ5 desaturase expression, Fads1 and Fads2 mRNA expression levels in mouse colon mucosa and liver were measured by RT-qPCR. As shown in Fig. 2, Fads1 expression levels were altered as expected in haploinsufficient Het and Null mice compared with Wt siblings. In comparison, Fads2 expression levels were not different (P > 0.05) among the three genotypes.
Fig. 2.
Fads1 and Fads2 gene expression in knockout mice. (A) Colonic mucosa and (B) liver RNA were extracted, and RT-qPCR was performed to measure gene expression levels. Data were normalized by 18S expression, mean ± SEM, n = 3. Values not sharing the same letter indicate significance within respective groups (P < 0.05).
Deletion of Fads1 reduces viability
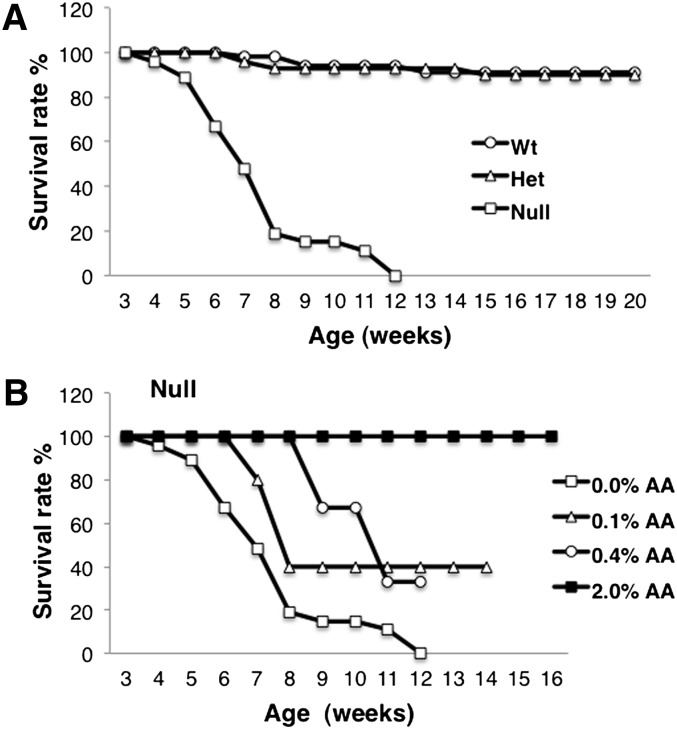
To limit the exogenous source of AA for the Fads1 mice, animals were fed an LA-enriched 10% safflower oil-based commercial diet (cat# D03092902R; Research Diets) devoid of AA. There was no significant effect of genotype on animal body weights (P > 0.05) (supplementary Fig. II). With respect to longevity, Null mice began to die gradually starting at 5–6 weeks of age, with no survivors past 12 weeks of age (Fig. 3). The average age at death of male Nulls was 7.6 weeks and of female Nulls, 7.5 weeks. From a gross anatomical perspective, no overt physical differences between Wt/Het and Null mice were observed. Occasionally, Null mice exhibited hip dysplasia at ∼5 weeks of age, but this did not occur in all mice (∼20% of the time). Often, there were no visible signs of any illness or infirmity as close as 12 h prior to death of the Null mice. Null mice did not exhibit lethargy, lack of grooming, skin conditions, or infirmity of any kind. No visible internal differences appeared during dissection. Histologically, tissues showed no differences between Wt/Het and Null mice (e.g., colon, duodenum, stomach, liver, kidney, lung, brain, and heart) (supplementary Fig. III). Clinical blood biochemistry parameters were also normal (data not shown). Mice were not evaluated reproductively. In an attempt to rescue the Null mice, graded levels of AA (0.1, 0.4, or 2% w/w) were added to the diet. The highest level of supplementation (2%) extended the longevity of Null mice to levels comparable with Wt and Het mice (Fig. 3). To further characterize the phenotype, mice were exposed to DSS to induce acute intestinal inflammation (24, 25). All Wt and Het mice survived the DSS challenge. In contrast, Null mice exhibited a significant (P < 0.05) reduction in viability during the 5-day DSS treatment period (supplementary Fig. IV). These data indicate that Fads1 Null mice are unable to tolerate an acute intestinal inflammatory challenge.
Fig. 3.
Kaplan-Meier survival curves of Fads1 mice. (A) Fads1 null mice exhibited low viability when fed a standard AA-free diet; n = 37 for Wt, n = 44 for Het, n = 11 for Null. (B) Dietary supplementation with AA (0.1 and 0.4%, w/w) partially reversed the Fads1 null mouse phenotype; n = 5 for Null + 0.1% AA, n = 3 for Null + 0.4% AA. Supplementation with 2.0% AA completely rescued the Null phenotype; n = 4 for Null ± 2% AA.
Deletion of Fads1 reciprocally alters the levels of AA and DGLA in mouse tissues
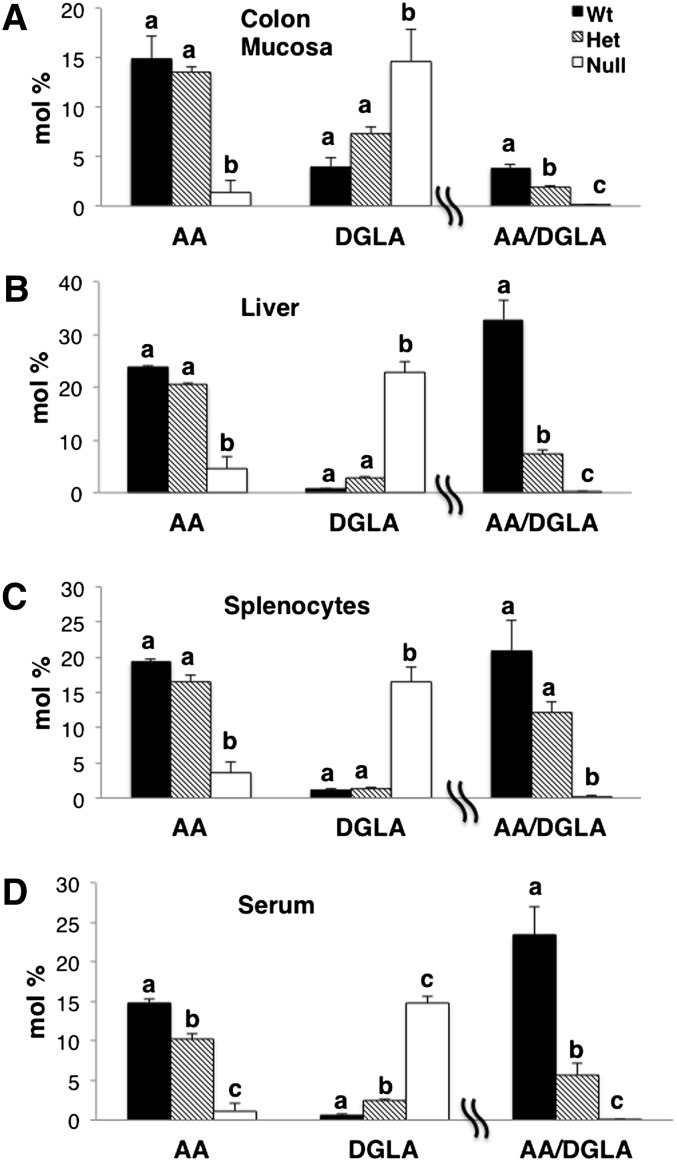
Membrane total phospholipid fatty acid profiles were measured in Fads1 mouse colonic mucosa, liver, splenocytes, and serum (Fig. 4). Differences were primarily observed in the levels of DGLA and AA (P < 0.05) in Null mice compared with Wt and Het siblings, with AA decreased to nearly undetectable levels in multiple organ sites in Null animals (supplementary Tables I–IV). Although the levels of AA and DGLA in Het mice were comparable with Wt mice, the ratio of AA/DGLA in Het mice was significantly (P < 0.05) different from that in both Wt and Null mice (Fig. 4).
Fig. 4.
Tissue levels of AA and DGLA. Total phospholipids were isolated from mouse (A) colon mucosa, (B) liver, (C) splenocytes, and (D) serum, and fatty acid profiles were measured by GC-MS; mean ± SEM, n = 3. Values not sharing the same letter indicate a significant difference within respective fatty acids (P < 0.05).
Deletion of Fads1 alters 1- and 2-series eicosanoid levels
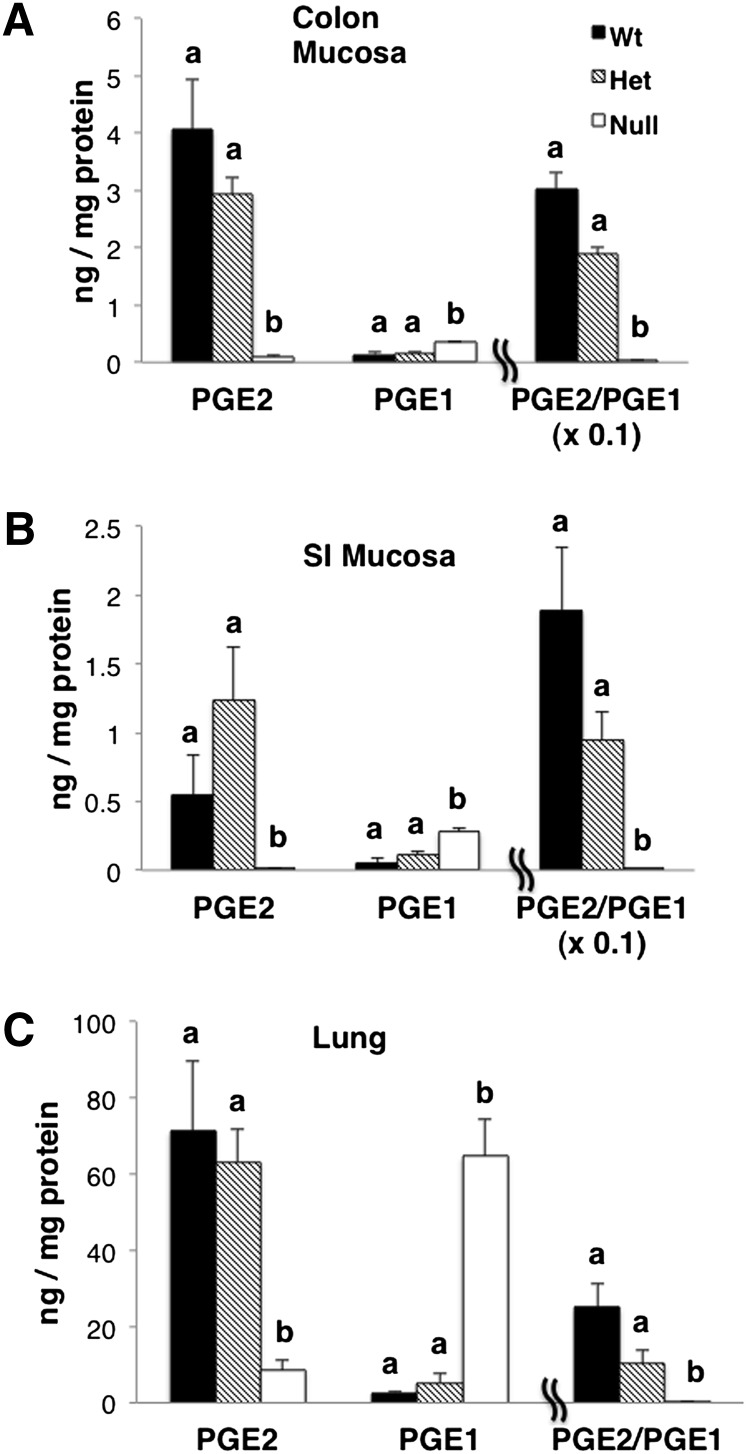
DGLA and AA are precursors to 1- and 2-series prostanglandins (PGE1 and PGE2), respectively. Therefore, we further probed the effect of gene deletion-induced alterations in DGLA and AA levels with respect to the biosynthesis of 1- and 2-series prostaglandins. Prostaglandins were extracted from colonic mucosa, small intestine mucosa, and lung and measured by mass spectrometry (Fig. 5). As expected, PGE2 levels were significantly lower, whereas PGE1 levels were higher in Null versus Wt mice (P < 0.05). Het mice exhibited an intermediate PGE2/PGE1 phenotype.
Fig. 5.
Levels of DGLA and AA-derived prostaglandins. Prostaglandins (PGE1 and PGE2) extracted from (A) colon mucosa, (B) small intestine mucosa, and (C) lung were measured by LC-MS; mean ± SEM, n = 3. Values not sharing the same letter indicate a significant difference within respective prostaglandins (P < 0.05).
Fads1 deletion decreases colonic cell proliferation
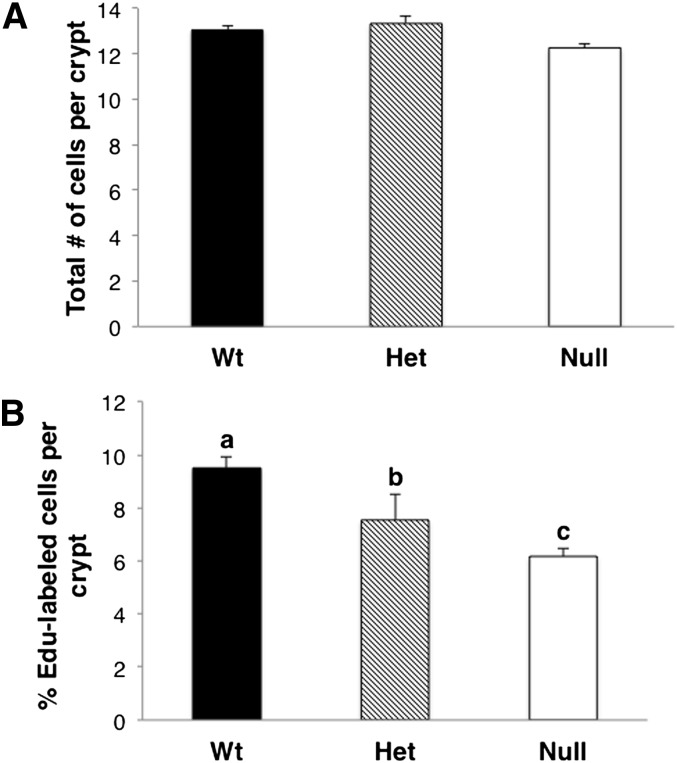
It has been reported that AA-derived prostaglandins enhance cell proliferation in colon cancer cells (26). Because intestinal PGE2 was decreased in Fads1 null mice (described above), we examined the level of cell proliferation in mouse colon crypts. As shown in Fig. 6, deletion of the Fads1 gene did not alter the number of cells in colonic crypts, although the percentage of EdU-labeled cells was significantly (P < 0.05) decreased in Null compared with Wt and Het mice. Het mice exhibited an intermediate proliferative phenotype between Wt and Null mice, consistent with the levels of AA and PGE2 (Figs. 4 and 5).
Fig. 6.
Effect of Fads1 deletion on colonic cell proliferation. Levels of cell proliferation in mouse colonic crypts were measured by the EdU Click-It assay. Data are expressed as (A) total number of cells per crypt and (B) percentage of EdU-labeled cells relative to the total number of cells per crypt; mean ± SEM, n = 3. Values not sharing the same letter indicate significant differences (P < 0.05).
CD4+ T cell PI(4,5)P2 levels are reduced in Fads1 null mice
As membrane phospholipid PI(4,5)P2 is a key node of second messenger metabolism in T cells (12) and its acyl backbone is predominantly composed of 1-stearoyl-2-arachidonoyl species, we examined whether the absence of AA associated with the deletion of the Fads1 gene altered the PI(4,5)P2 concentration in CD4+ T cells.
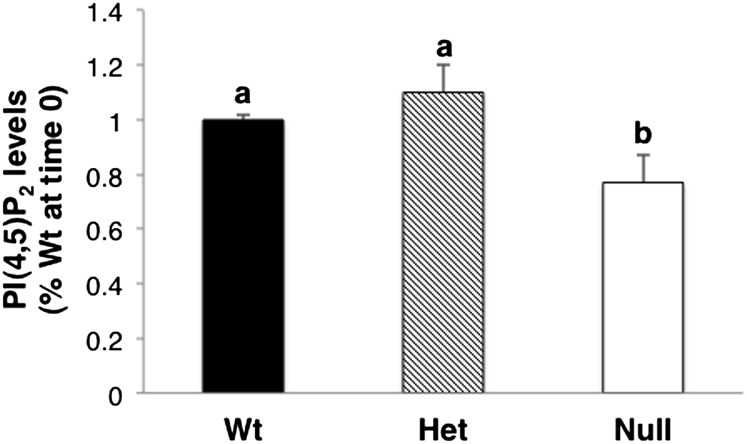
The basal level of PI(4,5)P2 was significantly (P < 0.05) decreased by approximately 24% in Fads1 Null CD4+ T cells compared with Het and Wt siblings (Fig. 7).
Fig. 7.
Levels of PI(4,5)P2 in Fads1 knockout mouse T cells. Splenic CD4+ T cells were isolated, and the levels of PI(4,5)P2 were quantified by indirect anti-PIP2 ELISA. Data were normalized to wild-type (Wt) at time 0; mean ± SEM, n = 3. Values not sharing the same letter indicate significant differences (P < 0.05).
Immune cell populations are altered by Fads1 deletion
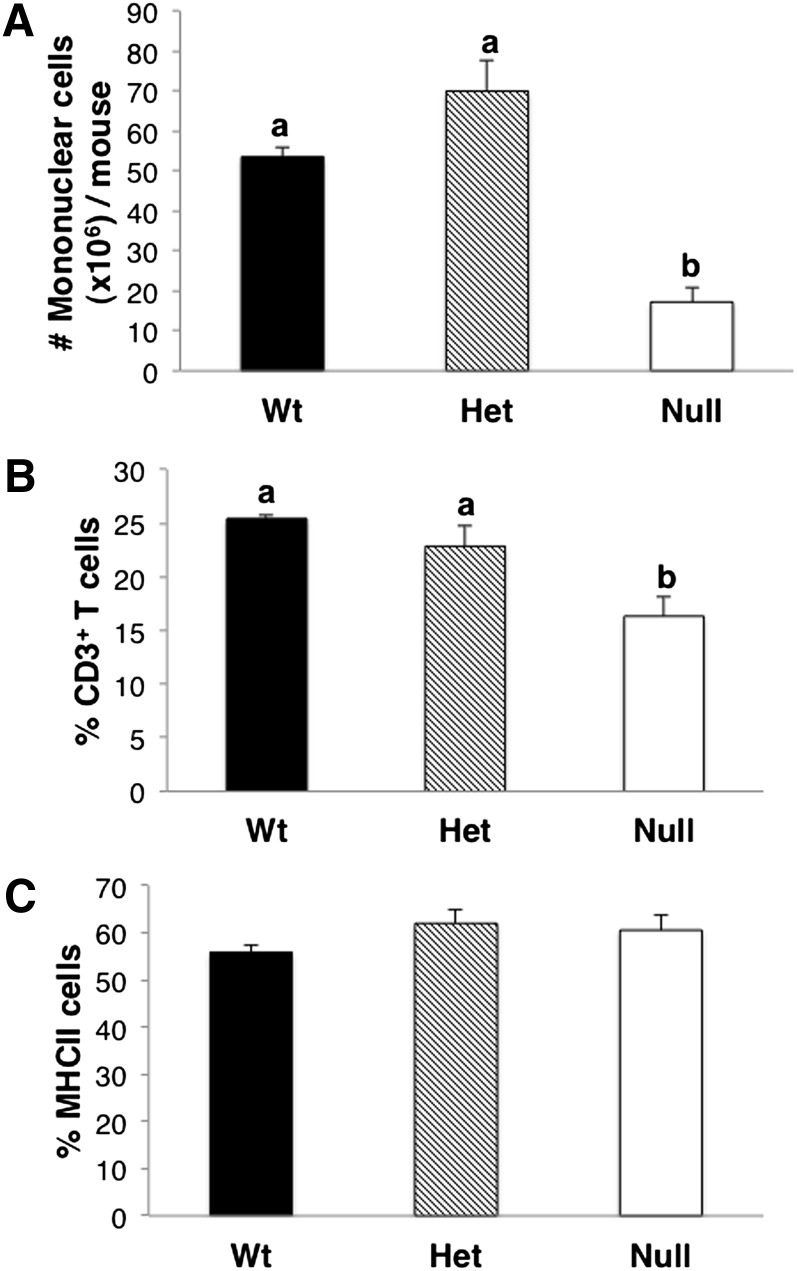
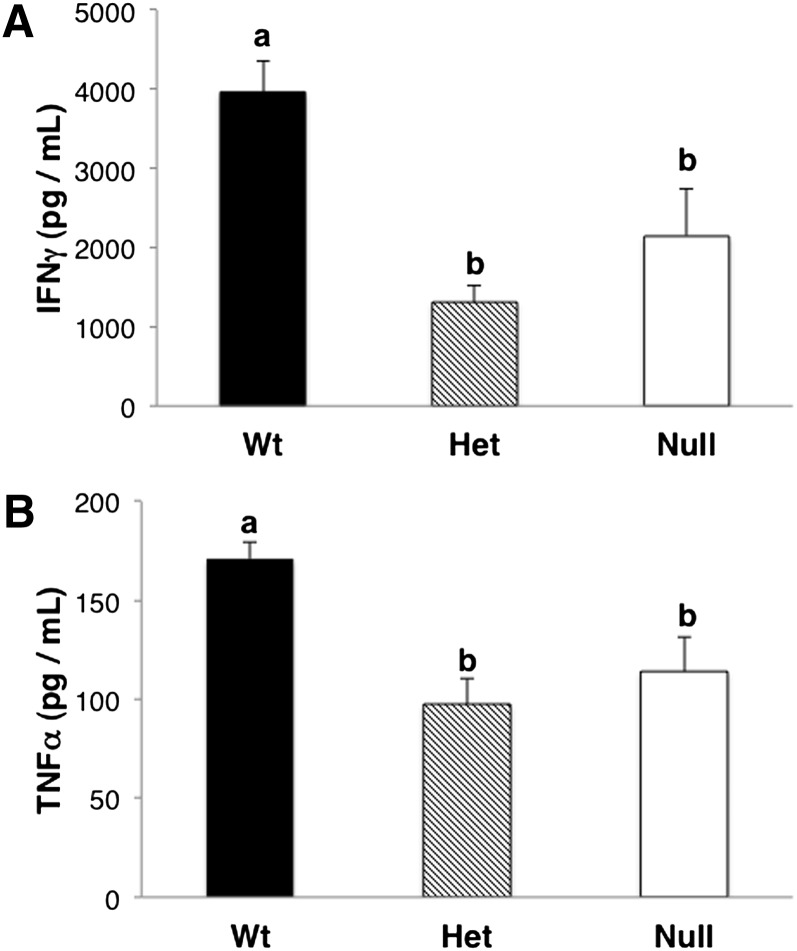
As AA-derived eicosanoids play an important role in immune regulation (27, 28), we next investigated the immunomodulatory effects associated with a deficiency in AA-derived 2-series prostaglandins. For this purpose, we compared basal immune cell populations in Fads1 Wt, Het, and Null mice. Specifically, mononuclear cells were isolated, and CD3+ T-cell and MHCII-cell populations were quantified by flow cytometry. As shown in Fig. 8, the total number of mononuclear cells and percentage of CD3+ T cells were significantly (P < 0.05) reduced in Null mice. In contrast, there was no difference in the level of MHCII-expressing cell populations across the three genotypes. In complementary experiments, culture supernatants were collected from mononuclear cells and isolated from spleen, and then mesenteric and inguinal lymph nodes were incubated overnight with agents designed to stimulate APCs (LPS, αCD40) or T cells (αCD3 + αCD28). Following overnight stimulation ex vivo, mixed cultures (i.e., mononuclear cell cultures composed of both T cells and APCs) from both Het and Null mice contained lower levels of IFNγ and TNFα following T-cell activation (Fig. 9 and supplementary Table V).
Fig. 8.
Immune cell populations in Fads1 knockout mice. Mononuclear cells were isolated from pooled spleens and mesenteric and inguinal lymph nodes. CD3+ T cell and MHCII cell populations were further analyzed by flow cytometry. Data are reported as (A) total number of mononuclear cells/mouse, (B) percentage of CD3+ T cells in the mononuclear cells, and (C) percentage of MHCII cells in the mononuclear cell fraction; mean ± SEM, n = 3. Values not sharing the same letter indicate significant differences (P < 0.05).
Fig. 9.
Levels of T-cell-derived inflammatory cytokines. T cells were isolated from pooled spleens and mesenteric and inguinal lymph nodes, and then stimulated with 5 μg/ml of plate-bound anti-CD3 plus 20 μg/ml of soluble anti-CD28 for 24 h. Culture supernatants were collected, and cytokine levels were measured using a Bio-Plex 200 System (Bio-Rad). Only selected cytokines are shown; mean ± SEM, n = 3. Values not sharing the same letter indicate significant differences (P < 0.05).
DISCUSSION
In this study, we determined the utility of antagonizing tissue AA levels as a novel approach to suppressing AA-derived eicosanoids (e.g., PGE2) biosynthesis. For this purpose, we have generated a previously unknown genetic model, namely, the Fads1 (Δ5 desaturase) knockout mouse. In many tissues, LA is converted to AA by an alternating sequence of Δ6 desaturation (Fads2 gene product), chain elongation, and Δ5 desaturation (Fads1 gene product), in which hydrogen atoms are selectively removed to create new double bonds, and then two carbon atoms are added to lengthen the fatty acid chain (29). Dietary AA bypasses the rate-limiting Δ5 desaturation step and can be metabolized by cyclooxygenase enzymes (Ptgs1 and Ptgs2) to generate immunomodulatory, tumor-promoting 2-series prostaglandins (e.g., PGE2) (supplementary Fig. I) (30).
Initial genotyping/phenotyping indicated that we successfully deleted the Fads1 gene. Intestinal mucosa fatty acid analysis also confirmed that Fads1 null mice have negligible levels of AA (∼1 mol%) compared with heterozygous (∼14 mol%) and wild-type (∼15 mol%) mice (Fig. 4 and supplementary Tables I–IV). Similar effects were observed in the liver and spleen, indicating a systemic depletion of AA. In contrast, Fads1 ablation resulted in the massive enhancement of dihomo-γ-linolenic acid (20:3Δ8,11,14, DGLA), the 1-series prostaglandin substrate in select tissues (Fig. 4). As anticipated, the alteration in prostaglandin precursor levels was associated with a profound shift in DGLA and AA-derived eicosanoid biosynthesis (Fig. 5). Interestingly, 1-series derived prostaglandins, e.g., PGE1, interact with discrete receptors compared with PGE2 (30, 31). This is noteworthy, because PGE1 is capable of inhibiting colon cancer cell proliferation (32, 33) as opposed to PGE2, which promotes growth (1, 34). Therefore, we are in a unique position to explore the impact of carcinogen exposure on mice that have virtually no 2-series prostaglandin substrate (20:4Δ5,8,11,14, AA).
Consistent with the loss of AA in membrane phospholipids, it is noteworthy that PIP2 levels were decreased in T cells isolated from Null mice (Fig. 7). Considering that PIP2 is made up primarily of AA-containing molecular species (35), we propose that the lack of AA substrate for the 1-acyl-glycero 3-phosphoinositol acyltransferase-dependent remodeling likely contributed to a reduction in its mass (23, 33, 36). Because PIP2 controls the activity of numerous proteins and serves as a source of second messengers (37), further work is needed to assess how AA deficiency affects individual phospholipid classes and PIP2-dependent signaling at the plasma membrane. These data will provide insight regarding how different tissues compensate in response to depletion of AA.
Disruption of the Fads1 versus Fads2 genes in mice manifests distinct phenotypic outcomes. For example, deletion of Δ6 desaturase resulted in dermal and intestinal ulceration (38–40). In contrast, we report that Δ5 desaturase null mice failed to thrive, gradually dying off at 5–6 weeks of age, with no survivors past 12 weeks of age (Fig. 3A). In most cases, the pathologies observed in Fads2 null mice were not apparent until approximately 17 weeks of age for females and 11 weeks for males (38–40). Fads1 Null mice did not live long enough to see if similar adverse events were present. A contributing factor for the survival of the Fads2 null mice was likely the modest amounts of AA present in the “control” diets (39, 40). This would have allowed the mice to survive and develop fertility and spermatogenesis complications. In addition, differences in the genetic background of the mice may have affected the phenotype. All Fads2 null mice were on a mixed (129S6/Svev/Tac/C57BL/6) background. Fads1 mice were on a pure C57BL/6 background. In addition, differences between these metabolically related models may be attributed to the fact that DGLA-derived 1-series eicosanoids are able to compensate for some of the AA-derived eicosanoid functions (30). In contrast to Fads1 Null mice, Fads2 mice are unable to synthesize 1-series PGs due to the absence of DGLA (38). Although the precise cause of the loss of viability in Fads1 Null mice is still under investigation, this phenotype was fully reversible upon supplementation of AA to the diet (Fig. 3B). With regard to the underlying mechanisms driving the perturbation of immune cell populations observed in Fads1 knockout mice (Figs. 8 and 9), given the importance of PI(4,5)P2 and PGE2 in regulating immune cell function (41–43), it is possible that the suppression of these critical mediators contributed to a disruption in immune cell homeostasis.
The lack of AA-derived eicosanoid production is consistent with the observed reduction in intestinal crypt proliferation (Fig. 6) and the inability of Fads1 Null mice to tolerate an acute intestinal inflammatory challenge (supplementary Fig. IV). Similar effects have been reported in microsomal PGE synthase Null mice and following cyclooxygenase-2 deficiency (44, 45). PGE2 in the intestine has a protective effect on the integrity of the epithelial intestinal wall, and its loss promotes polymicrobial sepsis, a frequently fatal disease (45). Clearly, until the full effects of Fads1 deletion on the entire spectrum of AA-derived eicosanoids is known, it is not possible to exclusively link the loss of tissue AA to the specific role of PGE2.
In summary, we have generated and characterized a novel AA-deficient (Fads1 knockout) mouse model. Although young-adult mice die prematurely, this phenotype can be rescued by adding AA to the diet. Hence, in future studies, it will be possible to titrate membrane levels of AA. Lipidomic analyses indicate that DGLA and AA-derived mediators are reciprocally modulated in this model. Given the central role of AA-derived eicosanoids in epithelial and immune cell biology, we are in a unique position to address our overall goal, to determine at a mechanistic level, the utility of antagonizing tissue AA levels as a novel approach to suppressing AA-dependent inflammation and cancer.
Supplementary Material
Acknowledgments
The authors thank Martek Bioscience Corporation, Columbia, MD, for providing the ARASCO oil.
Footnotes
Abbreviations:
- AA
- arachidonic acid
- Ptgs2
- cyclooxygenase 2
- DGLA
- dihomo-γ-linolenic acid
- DSS
- dextran sodium sulphate
- EdU
- 5-ethynyl-2´-deoxyuridine
- Fads1
- fatty acid desaturase 1 (Δ5 desaturase)
- Het
- heterozygous
- IL
- interleukin
- LA
- linoleic acid
- MHC II
- major histocompatibility complex class II
- PGE
- prostaglandin E
- PI(4,5)P2
- phosphatidylinositol-4,5-bisphosphate
- TNFα
- tumor necrosis factor α
- Wt
- wild-type
This work was supported by Cancer Prevention and Research Institute of Texas (CPRIT) Grant RP120028. J. M. Monk is recipient of a Natural Sciences and Engineering Research Council of Canada postdoctoral fellowship (PDF-388466-2010). T. Y. Hou is recipient of a Natural Sciences and Engineering Research Council of Canada predoctoral fellowship (PGSD2-403986-2011). Mutant Fads1 mice were generated in collaboration with the Texas Institute for Genomic Medicine (TIGM).
The online version of this article (available at http://www.jlr.org) contains supplementary data in the form of four figures and five tables.
REFERENCES
- 1.Castellone M. D., Teramoto H., Williams B. O., Druey K. M., Gutkind J. S. 2005. Prostaglandin E2 promotes colon cancer cell growth through a GS-axin-β-catenin signaling axis. Science. 310: 1504–1510 [DOI] [PubMed] [Google Scholar]
- 2.Greenhough A., Wallam C. A., Hicks D. J., Moorghen M., Willams A. C., Paraskeva C. 2010. The proapoptotic BH2-only protein Bim is downregulated in a subset of colorectal cancers and is repressed by antiapoptotic COX-2/PGE2 signalling in colorectal adenoma cells. Oncogene. 29: 3398–3410 [DOI] [PMC free article] [PubMed] [Google Scholar]
- 3.Berg M., Soreide K. 2011. Will an aspirin a day keep the colorectal cancer away? Nat. Rev. Clin. Oncol. 8: 130–131 [DOI] [PubMed] [Google Scholar]
- 4.Smith W. L. 2005. Cyclooxygenases, peroxide tone and allure of fish oil. Curr. Opin. Cell Biol. 17: 174–182 [DOI] [PubMed] [Google Scholar]
- 5.Mathias R. A., Vergara C., Gao L., Rafaels N., Hand T., Campbell M., Bickel C., Ivester P., Sergeant S., Barnes K. C., et al. 2010. FADS genetic variants in ω-6 polyunsaturated fatty acid metabolism in a homogeneous island population. J. Lipid Res. 51: 2766–2774 [DOI] [PMC free article] [PubMed] [Google Scholar]
- 6.Taber L., Chiu C. H., Whelan J. 1998. Assessment of the arachidonic acid content of foods commonly consumed in the American diet. Lipids. 33: 1151–1157 [DOI] [PubMed] [Google Scholar]
- 7.van der Pouw Kraan T. C., Boeije L. C., Smeenk R. J., Wildenes J., Aarden L. A. 1995. Prostaglandin-E2 is a potent inhibitor of human interleukin 12 production. J. Exp. Med. 181: 775–779 [DOI] [PMC free article] [PubMed] [Google Scholar]
- 8.Sakata D., Yao C., Narumiya S. 2010. Prostaglandin E2, an immunoactivator. J. Pharmacol. Sci. 112: 1–5 [DOI] [PubMed] [Google Scholar]
- 9.Barrie A., Khare A., Henkel M., Zhang Y., Barmada M. M., Duerr R., Ray A. 2011. Prostaglandin E2 and IL-23 plus IL-1β differentially regulate the Th1/Th17 immune response of human CD161(+) CD4(+) memory T cells. Clin. Transl. Sci. 4: 268–273 [DOI] [PMC free article] [PubMed] [Google Scholar]
- 10.Poccia D., Larijani B. 2009. Phosphatidylinositol metabolism and membrane fusion. Biochem. J. 418: 233–246 [DOI] [PubMed] [Google Scholar]
- 11.Hao J. J., Liu Y., Kruhlak M., Debell K. E., Rellahan B. L., Shaw S. 2009. Phospholipase C-mediated hydrolysis of PIP2 releases ERM proteins from lymphocyte membrane. J. Cell Biol. 184: 451–462 [DOI] [PMC free article] [PubMed] [Google Scholar]
- 12.Huang Y. H., Sauer K. 2010. Lipid signaling in T cell development and function. Cold Spring Harb. Perspect. Biol. 2: a002428. [DOI] [PMC free article] [PubMed] [Google Scholar]
- 13.Wu W. K., Sung J. J., Lee C. W., Yu J., Cho C. H. 2010. Cyclooxygenase-2 in tumorigenesis of gastrointestinal cancers: an update on the molecular mechanisms. Cancer Lett. 295: 7–16 [DOI] [PubMed] [Google Scholar]
- 14.Durick K., Mendlein J., Xanthopoulos K. G. 1999. Hunting with traps: genome-wide strategies for gene discovery and functional analysis. Genome Res. 9: 1019–1025 [DOI] [PubMed] [Google Scholar]
- 15.Zambrowicz B. P., Friedrich G. A., Buxton E. C., Lilleberg S. L., Person C., Sands A. T. 1998. Disruption and sequence identification of 2,000 genes in mouse embryonic stem cells. Nature. 392: 608–611 [DOI] [PubMed] [Google Scholar]
- 16.Fan Y. Y., Zhan Y., Aukema H. M., Davidson L. A., Zhou L., Callaway E., Tian Y., Weeks B. R., Lupton J. R., Toyokuni S., et al. 2009. Proapoptotic effects of dietary (n-3) fatty acids are enhanced in colonocytes of manganese-dependent superoxide dismutase knockout mice. J. Nutr. 139: 1328–1332 [DOI] [PMC free article] [PubMed] [Google Scholar]
- 17.Folch J., Lees M., Sloane Stanley G. H. 1957. A simple method for the isolation and purification of lipides from animal tissues. J. Biol. Chem. 226: 497–509 [PubMed] [Google Scholar]
- 18.Chapkin R. S., Somers S. D., Erickson K. L. 1988. Inability of murine peritoneal macrophages to convert linoleic acid into arachidonic acid: evidence of chain elongation. J. Immunol. 140: 2350–2355 [PubMed] [Google Scholar]
- 19.Yang P., Chan D., Felix E., Madden T., Klein R. D., Shureiqi I., Chen X., Dannenberg A. J., Newman R. A. 2006. Determination of endogenous tissue inflammation profiles by LC/MS/MS: COX- and LOX-derived bioactive lipids. Prostaglandins Leukot. Essent. Fatty Acids. 75: 385–395 [DOI] [PubMed] [Google Scholar]
- 20.Jia Q., Lupton J. R., Smith R., Weeks B., Callaway E., Davidson L. A., Kim W., Fan Y. Y., Yang P., Newman R. A., et al. 2008. Reduced colitis-associated colon cancer in Fat-1 (n-3 fatty acid desaturase) transgenic mice. Cancer Res. 68: 3985–3991 [DOI] [PMC free article] [PubMed] [Google Scholar]
- 21.Hughes D., Otani T., Yang P., Newman R. A., Yantiss R. K., Altorki N. K., Port J. L., Yan M., Markowitz S. D., Mazumdar M., et al. 2008. NAD+-dependent 15-hydroxyprostaglandin dehydrogenase regulates levels of bioactive lipids in non–small cell lung cancer. Cancer Prev. Res. (Phila.). 1: 241–249 [DOI] [PMC free article] [PubMed] [Google Scholar]
- 22.Vanstraelen M., Baloban M., Da Ines O., Cultrone A., Lammens T., Boudolf V., Brown S. C., De Veylder L., Mergaert P., Kondorosi E. 2009. APC/C-CCS52A complexes control meristem maintenance in the Arabidopsis root. Proc. Natl. Acad. Sci. USA. 106: 11806–11811 [DOI] [PMC free article] [PubMed] [Google Scholar]
- 23.Hou T. Y., Monk J. M., Fan Y-Y., Barhoumi R., Chen Y. Q., Rivera G. M., McMurray D. N., Chapkin R. S. 2012. n-3 polyunsaturated fatty acids suppress phosphatidylinositol-(4,5)-bisphosphate dependent actin remodeling during CD4+ T cell activation. Biochem. J. 443: 27–37 [DOI] [PMC free article] [PubMed] [Google Scholar]
- 24.Jia Q., Ivanov I., Zlatev Z. Z., Alaniz R. C., Weeks B. R., Callaway E. S., Goldsby J. S., Davidson L. A., Fan Y. Y., Zhou L., et al. 2011. Dietary fish oil and curcumin combine to modulate colonic cytokinetics and gene expression in dextran sodium sulphate-treated mice. Br. J. Nutr. 106: 519–529 [DOI] [PMC free article] [PubMed] [Google Scholar]
- 25.Wirtz S., Neufert C., Weigmann B., Neurath M. F. 2007. Chemically induced mouse models of intestinal inflammation. Nat. Protoc. 2: 541–546 [DOI] [PubMed] [Google Scholar]
- 26.Park S. W., Kim H. S., Choi M. S., Jeong W. J., Heo D. S., Kim K. H., Sung M. W. 2011. The effects of the stromal cell-derived cyclooxygenase-2 metabolite prostaglandin E2 on the proliferation of colon cancer cells. J. Pharmacol. Exp. Ther. 336: 516–523 [DOI] [PubMed] [Google Scholar]
- 27.Bao Y. S., Zhang P., Xie R. J., Wang Z. Y., Zhou Z., Zhai W. J., Feng S. Z., Han M. Z. 2011. The regulation of CD4+ T cell immune responses toward Th2 cell development by prostaglandin E2. Int. Immunopharmacol. 11: 1599–1605 [DOI] [PubMed] [Google Scholar]
- 28.Meydani S. N., Wu D. 2008. Nutrition and age-associated inflammation: implications for disease prevention. JPEN J. Parenter. Enteral Nutr. 32: 626–629 [DOI] [PubMed] [Google Scholar]
- 29.Rioux V., Pédrono F., Legrand P. 2011. Regulation of mammalian desaturases by myristic acid: N-terminal myristoylation and other modulations. Biochim. Biophys. Acta. 1811: 1–8 [DOI] [PubMed] [Google Scholar]
- 30.Fan Y. Y., Chapkin R. S. 1998. Importance of dietary gamma-linolenic acid in human health and nutrition. J. Nutr. 128: 1411–1414 [DOI] [PubMed] [Google Scholar]
- 31.Iyú D., Jüttner M., Glenn J., White A., Johnson A., Fox S., Heptinstall S. 2011. PGE1 and PGE2 modify platelet function through different prostanoid receptors. Prostaglandins Other Lipid Mediat. 94: 9–16 [DOI] [PubMed] [Google Scholar]
- 32.Mengeaud V., Nano J., Fournel S., Rampal P. 1992. Effects of eicosapentaenoic acid, gamma-linolenic acid and prostaglandin E1 on three human colon carcinoma cell lines. Prostaglandins Leukot. Essent. Fatty Acids. 47: 313–319 [DOI] [PubMed] [Google Scholar]
- 33.Bamba H., Ota S., Kato A., Kawamoto C., Matsuzaki F. 2000. Effect of prostaglandin E1 on vascular endothelial growth factor production by human macrophages and colon cancer cells. J. Exp. Clin. Cancer Res. 19: 219–223 [PubMed] [Google Scholar]
- 34.Wang D., DuBois R. N. 2010. The role of COX-2 in intestinal inflammation and colorectal cancer. Oncogene. 29: 781–788 [DOI] [PMC free article] [PubMed] [Google Scholar]
- 35.Lee C. H., Hajra A. K. 1991. Molecular species of diacylglycerols and phosphoglycerides and the postmortem changes in the molecular species of diacylglycerols in rat brains. J. Neurochem. 56: 370–379 [DOI] [PubMed] [Google Scholar]
- 36.Inoue M., Murase S., Okuyama H. 1984. Acyl coenzyme a:phospholipid acyltransferases in porcine platelets discriminate between omega-3 and omega-6 unsaturated fatty acids. Arch. Biochem. Biophys. 231: 29–37 [DOI] [PubMed] [Google Scholar]
- 37.Kwiatkowska K. 2010. One lipid, multiple functions: how various pools of PI(4,5)P2 are created in the plasma membrane. Cell. Mol. Life Sci. 67: 3927–3946 [DOI] [PMC free article] [PubMed] [Google Scholar]
- 38.Stroud C. K., Nara T. Y., Roqueta-Rivera M., Radlowski E. C., Lawrence P., Zhang Y., Cho B. H., Segre M., Hess R. A., Brenna J. T., et al. 2009. Disruption of FADS2 gene in mice impairs male reproduction and causes dermal and intestinal ulceration. J. Lipid Res. 50: 1870–1880 [DOI] [PMC free article] [PubMed] [Google Scholar]
- 39.Roqueta-Rivera M., Stroud C. K., Haschek W. M., Akare S. J., Segre M., Brush R. S., Agbaga M. P., Anderson R. E., Hess R. A., Nakamura M. T. 2010. Docosahexaenoic acid supplementation fully restores fertility and spermatogenesis in male delta-6 desaturase-null mice. J. Lipid Res. 51: 360–367 [DOI] [PMC free article] [PubMed] [Google Scholar]
- 40.Stoffel W., Holz B., Jenke B., Binczek E., Gunter R. H., Kiss C., Karakesisoglou I., Thevis M., Weber A. A., Arnhold S., et al. 2008. Δ6-Desaturase (FADS2) deficiency unveils the role of ω3- and ω6-polyunsaturated fatty acids. EMBO J. 27: 2281–2292 [DOI] [PMC free article] [PubMed] [Google Scholar]
- 41.Mandal A. K., Zhang Z., Kim S. J., Tsai P. C., Mukherjee A. B. 2005. Yin-yang: balancing act of prostaglandins with opposing functions to regulate inflammation. J. Immunol. 175: 6271–6273 [DOI] [PubMed] [Google Scholar]
- 42.Chichili G. R., Rodgers W. 2009. Cytoskeleton-membrane interactions in membrane raft structure. Cell. Mol. Life Sci. 66: 2319–2328 [DOI] [PMC free article] [PubMed] [Google Scholar]
- 43.Sreeramkumar V., Fresno M., Cuesta N. Prostaglandin E2 and T cells: friends or foes? Immunol. Cell Biol. Epub ahead of print. September 27, 2011; doi:10.1038/icb.2011.75. [DOI] [PMC free article] [PubMed] [Google Scholar]
- 44.Nakanishi M., Menoret A., Tanaka T., Miyamoto S., Montrose D. C., Vella A. T., Rosenberg D. W. 2011. Selective PGE2 suppression inhibits colon carcinogenesis and modifies local mucosal immunity. Cancer Prev. Res. (Phila.). 4: 1198–1208 [DOI] [PMC free article] [PubMed] [Google Scholar]
- 45.Fredenburgh L. E., Suarez Velandia M. M., Ma J., Olszak T., Cernadas M., Englert J. A., Chung S. W., Liu X., Begay C., Padera R. F., et al. 2011. Cyclooxygenase-2 deficiency leads to intestinal barrier dysfunction and increased mortality during polymicrobial sepsis. J. Immunol. 187: 5255–5267 [DOI] [PMC free article] [PubMed] [Google Scholar]
Associated Data
This section collects any data citations, data availability statements, or supplementary materials included in this article.


