

Abstract
The presynaptic source of dopamine in the CA1 field of dorsal hippocampus is uncertain due to an anatomical mismatch between dopaminergic terminals and receptors. We show, in an in vitro slice preparation from C57BL/6 male mice, that a dopamine (DA) D1 receptor (D1R)-mediated enhancement in glutamate synaptic transmission occurs following release of endogenous DA with amphetamine exposure. It is assumed DA is released from terminals innervating from the ventral tegmental area (VTA) even though DA transporter (DAT)-positive fibers are absent in hippocampus, a region with abundant D1Rs. It has been suggested this results from a lack of DAT expression on VTA terminals rather than a lack of these terminals per se. Neither a knockdown of tyrosine hydroxylase (TH) expression in the VTA by THsiRNA, delivered locally, by adeno-associated viral vector, nor localized pharmacological blockade of DAT to prevent amphetamine uptake into DA terminals, has any effect on the D1R synaptic, enhancement response to amphetamine. However, either a decrease in TH expression in the locus ceruleus (LC) or a blockade of the norepinephrine (NE) transporter prevents the DA-mediated response, indicating LC terminals can release both NE and DA. These findings suggest noradrenergic fibers may be the primary source of DA release in hippocampus and corresponding DA-mediated increase in synaptic transmission. Accordingly, these data imply the LC may have a role in DA transmission in the CNS in response to drugs of abuse, and potentially, under physiological conditions.
Introduction
Dopamine D1 receptor (D1R) activation is required for the encoding and persistence of episodic memories in hippocampus (O'Carroll et al., 2006; Bethus et al., 2010) and blockade of D1Rs in hippocampus prevents reinforcement and state-dependent learning in addiction (Ricoy and Martinez, 2009; Zarrindast et al., 2010). On the cellular level, activation of D1Rs in hippocampus is required for the expression and maintenance of LTP (Huang and Kandel, 1995; Lemon and Manahan-Vaughan, 2006; Navakkode et al., 2007), a cellular substrate of learning, via a protein kinase A (PKA)-dependent process (Otmakhova and Lisman, 1998; Malinow et al., 2000). Additionally, D1R activation increases the synaptic expression of AMPA receptors (AMPAR) through PKA activation (Smith et al., 2005; Gao et al., 2006; Navakkode et al., 2007), which likely facilitates the observed increase in AMPAR transmission in hippocampus (Yang, 2000; Gonzalez-Islas and Hablitz, 2003).
It has been assumed the primary dopaminergic input to hippocampus arises from fibers originating in the ventral tegmental area (VTA; Gasbarri et al., 1996, 1997; Lisman and Grace, 2005; Bethus et al., 2010). While there is evidence that ablation of dopaminergic afferents originating in the VTA decreases the dopamine content of hippocampus overall (Scatton et al., 1980), this does not take into account the subregion-specific variations that encompass the most striking receptor/VTA terminal mismatches. The primary input from VTA is to the ventral subregion of hippocampus with only minimal input to stratum oriens (SO) of dorsal hippocampus (DH) and none noted for the stratum radiatum of the DH (Swanson, 1982; Gasbarri et al., 1994, 1997). This is interesting given that activation of D1Rs in proximity to CA3-CA1 synapses in DH-stratum radiatum are required for hippocampal-dependent learning and memory (O'Carroll et al., 2006; Bethus et al., 2010).
In an attempt to resolve this discrepancy, our attention turned to the noradrenergic system, as fibers originating in the locus ceruleus (LC) are the only other source of dopamine (DA) in the vicinity of DH-D1Rs and are found in abundance in DH (Jones and Moore, 1977; Engelbrecht et al., 1994; Xu et al., 1998). Electrical and chemical stimulation to the LC increases NE and DA release in terminating cortical regions (Kawahara et al., 2001; Devoto et al., 2005a,b; Devoto and Flore, 2006). This demonstrates that activation of these fibers can increase both NE and DA in areas of termination, although the specific origin and mechanism of the DA release is unclear. In particular, the possibility of an indirect, LC-mediated activation (or disinhibition) of VTA or substantia nigra terminals has not been ruled out. There is evidence that presynaptically released neurotransmitter from one neuronal phenotype can affect the release of another neurotransmitter from a separate neuronal phenotype. For example, activation of presynaptic cholinergic receptors can alter the release of glutamate (Li et al., 2002), GABA (Seddik et al., 2006) and glycine (Kiyosawa et al., 2001) in the spinal cord. Nonetheless, these findings have lead to the speculation that, NE terminals can release DA, perhaps under conditions where dopamine-β-hydroxylase (DβH), located in vesicles of NE terminals, is saturated (Devoto et al., 2005b), again, with little direct evidence to support this notion.
Our findings suggest that electrophysiological activation of DH-D1Rs by amphetamine-induced release of DA, originates in NE terminals of the LC rather than in VTA terminals.
Materials and Methods
All animal procedures have been approved by the animal care and use committee at University of Texas Southwestern Medical Center, Dallas, Texas, and follow guidelines established by the National Institutes of Health.
In vitro slice preparation.
Coronal 300 μm thick slices were cut from 8 to 12 week C57BL/6 mice acquired from Wakeland Laboratories, University of Texas Southwestern Medical Center, Dallas, Texas. Briefly, animals were anesthetized with 1.5% isoflurane, were rapidly decapitated and brains were removed. Brains were blocked in the coronal orientation and cut on a vibratome 1500 in a high sucrose low sodium solution (in mm): 3 KCl, 2 MgSO4, 2 CaCl2, 24 NaHCO3, 1.25 NaH2PO4, 10 dextrose and 254 sucrose. Slices were maintained up to 6 h in artificial CSF (aCSF; in mm): 125 NaCl, 2.5 KCl, 1.25 NaH2PO4, 1 MgCl2, 2 CaCl2, 25 NaHCO3, and 25 dextrose continuously bubbled with 95% O2/5% CO2. For slices made for intracellular recordings, 2 mm kynurenic acid (KY) and 500 μm ascorbate was added to cutting solution for slice preparation. Slices were then stored in the same solution without KY for 20 min and were transferred to a modified aCSF (in mm): 119 NaCl, 2.5 KCl, 1.0 NaH2PO4, 1.3 MgSO4, 2.5 CaCl2, 26 NaHCO3, and 11 dextrose.
Electrophysiology.
Slices were transferred to a submersion recording chamber and were continuously perfused with the same perfusate used to store slices. For extracellular recordings a bipolar stimulating electrode was placed in the SR region of CA1 within 300 μm of a recording electrode made of borisillicate glass (10–15MΩ) which was pulled using a horizontal puller (Sutter P-97) and filled with aCSF. The stimulation amplitude was set to elicit fEPSPs of ∼50% of maximal at 0.2 Hz frequency. A 10–20 min baseline recording was first acquired with a variance of no more than 10%, followed by an amphetamine (AMPH; 10 μm), a SKF-81297 (SKF; D1R agonist; 10 μm) or a norepinephrine (NE; 100 μm) bath application for 15 min. The experiment was continued for 40 min after drug application. Where indicated, SCH23390 (SCH; D1R antagonist; 10 μm), nisoxetine (NET antagonist; 5 μm), or GBR12935 [DA transporter (DAT) antagonist; 5 μm] was bath applied. All recordings were performed in the presence of prazosin (α adrenergic antagonist; 10 μm), propanolol (β adrenergic inhibitor; 10 μm) and eticlopride (DA D2 receptor antagonist; 100 nm). Data were acquired using Igor Pro (Wavemetrics), P-Clamp 9.5 (Molecular Devices) or Matlab (Mathworks).
For intracellular recording, an electrode made of borisillicate glass (5–7MΩ) was pulled using a horizontal puller (Sutter P-97) and was filled with cs-methanesulfonate pipet solution (mm): 110 CSMeSO3, 15 CsCl, 8 NaCl, 2 EGTA, 10 HEPES, 3 QX-314, 2 ATP and 0.3 GTP adjusted to 295mOsm and pH 7.3. Whole-cell voltage-clamp recordings were acquired with the blind-patch technique using a multiclamp 700A amplifier (Molecular Devices). Cells were held at −70 mV and stimulation was set to elicit current responses of 100–250 pA delivered at 0.2 Hz. Data were acquired using P-Clamp 9.5 software (Molecular Devices).
Surgical procedures for AAV application.
Eight-week-old C57BL/6 male mice were anesthetized with 1.5% isoflurane. A borisillicate glass electrode was pulled using a horizontal pipet puller (Sutter P-97) and filled with 1 μl of AAV-THsiRNA or AAV-SCR (Hommel et al., 2003; plasmids of these constructs were a kind gift from Dr. Ralph DiLeone, Yale University School of Medicine, New Haven, Connecticut) according to our previously used methods (Scammell et al., 2003; Rajji et al., 2006). The electrode was positioned in the LC or VTA using stereotactic coordinates (LC; AP, −5.45; ML, ± 0.9; DV, −3.0; VTA; AP, −3.3; ML, ±0.5; DV, −4.3). Virus was delivered using a picospritzer (Parker) driven by a master-8 (AMPI) set to deliver 1 μl over 15–20 min, repeated bilaterally. Animals were permitted to recover for 1 h on a heating pad, treated with (0.1 mg/kg) Buprenex (2× 12 h interval) and were maintained in the vivarium up to 30 d.
Immunohistochemistry and confocal microscopy.
Animals were perfused with 1× PBS followed by 4% PFA in 1× PBS. Brains were postfixed for 60 min, transferred to a 30% sucrose + 1× PBS solution for cryoprotection, and were then balanced and cut on a cryostat at 30 μm. Free floating slices were washed 3× in PBS for 10 min, transferred to a H2O2 solution (PBS + 10% methanol + 1.05% H2O2) up to 1 h, washed 3× in PBS, and blocked for 2 h (10% normal donkey serum + 1× PBS + 1% Triton X-100). Slices were then treated with primary antibody [rabbit anti-Tyrosine Hydroxylase (TH), 1:200, Millipore; rat anti-DAT, 1:200, Millipore; rabbit anti-MAP2, 1:1000, Santa Cruz Biotechnology; goat anti-D5R, 1:2000, Santa Cruz Biotechnology; chicken anti-GFP, 1:5000, Aves Laboratories] diluted in blocking solution and stored for 48 h at 4°C. Slices were washed and treated with secondary antibody [donkey anti-rabbit Alexa fluor 594, 1:200 (LC and VTA) and 1:500 (Hippocampus and PFC), Invitrogen; donkey anti-rat Alexa fluor 488, 1:1000, Invitrogen; donkey anti-goat Alexa fluor 594, 1:1000, Invitrogen; donkey anti-rabbit DyLight 649, 1:1000, Jackson ImmunoResearch; goat anti-chicken Alexa fluor 488, 1:200, Invitrogen] diluted in blocking solution for 2 h at room temperature, washed, mounted, and were then coverslipped with permafluor (Thermo Scientific). To control for nonspecific binding of secondary antibody, negative controls were performed. Slices were imaged in the z-axis at 5×, 10×, 20×, or 63× using a Zeiss LSM 510 Meta confocal laser scanning microscope. Images were acquired in 2 μm steps at a resolution of 1024 × 1024 using 0.7–1× zoom. TH and DAT-positive fibers were counted in the z-series at each AP coordinate from −1.58 to −2.98 for regions indicated in Figure 2. Images in Figure 2 are the summation of a z-series of images at 20× and 0.7× zoom from a C57BL/6 mouse. Quantification of DAT staining and TH staining across specified brain regions from 10-week-old C57BL/6 mice (n = 3) is provided in the corresponding bar charts. A fiber was considered a structure at least 20 μm in length and <2 μm in width.
Figure 2.

TH-positive staining is observed throughout the CA1 region of hippocampus while DAT-positive staining is sparse. Aa, Ab, Ac, Confocal images acquired using a 20× objective show dense TH fiber staining throughout the CA1 region of hippocampus (SP, stratum pyramidale; SO, stratum oriens; SR, stratum radiatum; SLM, stratum lacunosum moleculare), overlying parietal cortex (PCtx) and alveous (Alv) with DAT staining observed only in PCtx and Alv. Ad, Image shows TH and DAT staining in the PFC region. Bars represent 0.5 mm (20× magnification). B, Left, Plot shows total DAT-positive fiber counts across AP coordinates −1.58 to −2.98 from CA1, CA3, dentate, and subiculum (SUB) with the most dense staining observed in SO region of CA1 (SO, 9 ± 2; SR, 1.7 ± 1.2; SLM, 2.3 ± 1.9; Dentate, 4.7 ± 2.2; CA3, 1.3 ± 0.7; SUB, 3.3 ± 0.9; n = 3 mice). B, Right, Coronal sections from AP −1.58 to −2.98. C, Total TH and DAT-positive fiber counts at each AP coordinate from −1.58 to −2.98 from the SO region of CA1 show TH fibers surpass DAT fiber density by ∼100× (TH, 127 ± 4 fibers; DAT, 1 ± 0.3 fibers; p < 0.0001; n = 3 mice). Error bars indicate SEM. D, Confocal images of CA1 show MAP2 (blue), DAT (green), and dopamine D5 receptors (D5Rs; red) at 20×, 63×, and 63× × 150% (digital) magnification. Bars represent 0.5 mm (20× magnification) and 0.15 mm (63×). Images indicate D5R staining is observed throughout the CA1 region and is localized to sites adjacent to CA1 pyramidal cell dendrites such as postsynaptic spines while DAT staining is isolated to the overlying cortical region.
TH knockdown quantification.
To quantify the percentage of TH knockdown, tissue was processed as described above (Immunohistochemistry and confocal microscopy). Slices were imaged in the z-axis at 10× using a Zeiss LSM 510 Meta confocal laser scanning microscope. Images were acquired in 2 μm steps at a resolution of 1024 × 1024 using 0.7–1× zoom. Animals used for imaging had electrophysiological results that were within the SEM for each group. One to three coronal slices were selected per animal from at least three animals per group at targeted AP coordinates of VTA and LC. The fluorescence intensity was measured bilaterally through the confocal z-series in a fixed region of interest (drawn consistently for LC or VTA) for each animal using ImageJ Software (NIH). The fluorescence intensity calculated from AAV-THsiRNA-injected mice was normalized to the average fluorescence intensity measured in AAV-SCR-injected mice and is presented as a mean percentage ± SEM. Care was taken to ensure confocal parameters were identical between sections and as indicated above comparable regions were quantified between animals. The extent of TH knockdown was quantified in tissue from a subset of animals used for electrophysiological experiments. Animals were excluded from electrophysiology and histology if TH knockdown was <20% (it is important to note that there were no LC-injected AAV-THsiRNA animals showing attenuated amphetamine response and <20% histologically verified knockdown but there were animals showing a normal amphetamine response and <20% histological knockdown that were excluded; n = 2). Images presented in Figures 3 and 4 are the summation of an acquired z-series at 5× and 0.7× zoom from LC (Fig. 3) and from VTA (Fig. 4). The images represent the mean fluorescence intensity measured for AAV-SCR and AAV-THsiRNA-injected mice.
Figure 3.

Loss of TH in the LC is sufficient to prevent the D1-mediated increase in glutamate transmission with AMPH stimulation. A, Left, Top, Confocal images from an AAV-THsiRNA and an AAV-SCR-injected mouse acquired at 5× represent mean fluorescence from each group. TH staining is observed in the LC of AAV-SCR-injected mice but is diminished in mice injected with AAV-THsiRNA. Bubble in left panel removed in Photoshop. Left, Middle, GFP staining shows the precise targeting of virus to the LC. Left, Bottom, TH staining is observed in the VTA region from mice injected with either AAV-THsiRNA or AAV-SCR in the LC. Bubble in right panel removed in Photoshop. Scale bar, 0.5 mm. Right, Coronal drawing depicts bilateral location of LC and surgical targeting adapted from Reference Mouse Brain Atlas: Allen Institute for Brain Sciences. B, Plot shows AMPH increases glutamate transmission in slices from AAV-SCR-injected but not AAV-THsiRNA-injected mice (THsiRNA, 100 ± 4%; n = 10; SCR, 120 ± 8%; n = 5; p < 0.02). C, Plot shows SKF treatment increases glutamate transmission in slices from AAV-THsiRNA-injected mice (AAV-THsiRNA SKF, 126 ± 8%; n = 5; AMPH vs SKF, p < 0.02). AMPH experiments are replotted for comparison. Error bars indicate SEM.
Figure 4.

Loss of TH in VTA does not prevent the D1-mediated increase in glutamate transmission with AMPH stimulation. A, Left, Confocal images from an AAV-THsiRNA and an AAV-SCR-injected mouse acquired at 5× represent mean fluorescence from each group. TH staining is observed in the VTA of AAV-SCR-injected mice but is virtually absent in mice injected with AAV-THsiRNA. Scale bar, 0.5 mm. Right, Coronal drawing depicts bilateral location of VTA and surgical targeting adapted from Reference Mouse Brain Atlas: Allen Institute for Brain Sciences. B, Plot shows AMPH increases glutamate transmission in slices from both AAV-THsiRNA and AAV-SCR-injected mice (THsiRNA, 119 ± 4%; n = 4; SCR, 120 ± 8%; n = 6; p > 0.05). C, Plot shows SKF increases glutamate transmission in slices from AAV-THsiRNA-injected mice (AAV-THsiRNA SKF, 135 ± 1%; p > 0.05; n = 4). AMPH is replotted for comparison. Error bars indicate SEM.
To assess the extent to which AAV disseminated through LC and VTA in the rostral caudal axis, viral diffusion in the medial/lateral axis was measured. These measurements were acquired bilaterally in 1–2 sections per animal at targeted stereotactic AP coordinates for LC and VTA using GFP as the reporter, stained as indicated above. Assuming a spherical diffusion pattern of virus, these measurements were applied to the rostral/caudal axis. Thus, the spread of the virus in the rostral/caudal axis covered 87.9 ± 4.4% of VTA and 72.2 ± 10.1% of LC.
Results
Activation of D1Rs increases glutamate transmission, yet dopaminergic innervation to hippocampus is sparse
To confirm D1R activation increases glutamate transmission in DH, the D1R agonist SKF-81297 (10 μm; SKF) was bath applied for 15 min to acutely prepared hippocampal slices from 8 to 10 week C57BL/6 male mice following acquisition of a 20 min baseline. Similar to previous results (Yang, 2000; Gonzalez-Islas and Hablitz, 2003), activation of D1Rs increases glutamate transmission in extracellular fEPSP recordings, when noradrenergic transmission is blocked (NE antagonists: prazosin; 10 μm; propanolol; 10 μm). Importantly, this increased transmission is prevented by preapplication of the selective D1R antagonist SCH23390 (10 μm; SCH; SKF, 159 ± 2%; SKF + SCH, 104 ± 2%; p < 0.0001; Fig. 1A) confirming earlier observations (Yang, 2000; Gonzalez-Islas and Hablitz, 2003).
Figure 1.
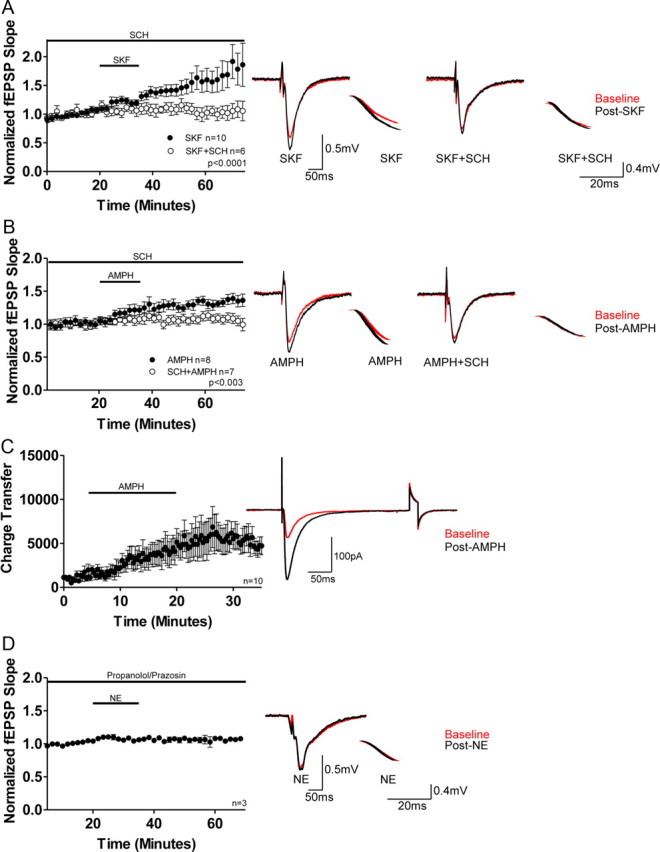
Pharmacological and endogenous activation of D1Rs increases glutamate transmission. A, Plot and representative traces show application of SKF increases glutamate transmission in extracellular fEPSP recordings, which is blocked by SCH23390 (SCH) treatment (SKF, 159 ± 2%; n = 10; SKF + SCH, 104 ± 2%; n = 6; p < 0.0001). All voltage traces presented in the right column are 10 sweep averages baseline (red) and post-treatment (black) of fEPSP evoked responses (50 ms scale bar) and their associated downward slopes (20 ms scale bar). B, Plot and representative traces show application of AMPH increases glutamate transmission in extracellular fEPSP recordings which is blocked by SCH treatment (AMPH, 132 ± 4%; n = 8; AMPH + SCH, 110 ± 5%; n = 7; p < 0.003). C, Plot and representative traces show AMPH application increases the total charge transfer in whole-cell voltage-clamp experiments at −70 mV (n = 10). The second excursion is in response to a 5 mV, 20 ms voltage step (to test input impedence). D, Plot and representative traces show prazosin and propanolol (included in all in vitro recordings) prevent a NE-mediated alteration in glutamate transmission, indicating NE does not activate D1Rs (103 ± 6% of baseline; n = 3). Error bars indicate SEM.
To assess whether stimulation of endogenous DA release would similarly increase glutamate transmission, AMPH (10 μm) was bath applied for 15 min and as expected, AMPH increased glutamate transmission (Fig. 1B). This increase was prevented with SCH pretreatment as above (AMPH, 132 ± 4%; AMPH + SCH, 110 ± 5%; p < 0.003; Mann–Whitney test; Fig. 1B). These results are supported by voltage-clamp whole-cell recordings at −70 mV in which we show that application of AMPH for 15 min increases synaptic, AMPAR-mediated, total charge transfer (Fig. 1C). It is important to note that AMPH and SKF are not additive as application of SKF following AMPH does not increase glutamate transmission above that elicited with AMPH treatment alone, indicating AMPH saturates the evoked glutamate response following D1R activation (data not shown; post-AMPH,137 ± 11%; post-SKF, 143 ± 17%; Mann–Whitney test; p ≃ 1; n = 3).
Previous investigators have shown NE can activate D1Rs in immature, but not adult, retinal ganglion neurons (de Mello et al., 1996). Thus, to test whether NE (100 μm) can increase glutamate transmission via D1R activation, NE was bath applied for 15 min in the presence of prazosin (10 μm) and propanolol (10 μm). We show NE does not increase glutamate transmission (103 ± 6% of baseline; Fig. 1D), demonstrating NE is not a ligand for D1Rs in adult hippocampal neurons. Collectively, these findings indicate the AMPH-induced increase in glutamate transmission is mediated by dopaminergic rather than noradrenergic or serotonergic receptors.
We next quantified the density of dopaminergic fibers in DH. Using immunohistochemistry and confocal microscopy we measured the density of TH-positive fibers (indicates noradrenergic and/or dopaminergic) and the density of fibers which express DAT (indicates dopaminergic only). As shown in presented images and in bar charts we observe dense TH-positive fiber expression (rabbit anti-TH; red) in the CA1 region of hippocampus with DAT-positive fiber staining (rat anti-DAT; green) observed primarily in the overlying stratum oriens and parietal cortical regions (Fig. 2A).
Quantification of DAT-positive fibers in DH (AP: −1.58 to AP: −2.98) indicates that the richest DAT-positive staining occurs in the SO region of dorsal CA1 [Fig. 2B; left; SO, 9 ± 2; SR, 1.7 ± 1.2; SLM, 2.3 ± 1.9; Dentate, 4.7 ± 2.2; CA3, 1.3 ± 0.7; SUB, 3.3 ± 0.9; n = 3; 10-week-old male C57BL/6 mice]. To compare the density of TH versus DAT-positive staining in the CA1 field, TH-positive versus DAT-positive fibers were compared in the SO subfield across AP coordinates −1.58 to −2.98. This strategy was used primarily because SO has the greatest density of DAT-positive staining while expressing the lowest TH-positive staining, making it the subregion with the greatest ratio of DAT/TH fiber density. As indicated, the TH-positive fiber counts at each AP coordinate quantified far outweighs the density of DAT-positive fibers by ∼100× in SO (TH, 127 ± 4 fibers; DAT, 1 ± 0.3 fibers; p < 0.0001; unpaired t test; Fig. 2C).
We next examined the expression of dopamine D5 receptors (D5Rs), the predominant D1R-subtype found in hippocampus (Meador-Woodruff et al., 1992; Levey et al., 1993; Laurier et al., 1994; Ciliax et al., 2000) and observe that D5R expression (goat anti-D5R; red) is found throughout dorsal CA1 (Fig. 2D). Moreover, at higher magnification it is clear the punctuated staining of D5R is found in close proximity to CA1 pyramidal dendrites stained using rabbit anti-MAP2 (blue), consistent with their expression on postsynaptic spines. Collectively, our findings indicate that while dopaminergic fiber staining of dorsal CA1 is minimal as indicated by rat anti-DAT (green) staining, dopaminergic receptors are widely expressed throughout the CA1 region (Fig. 2D).
Knockdown of TH expression in the LC prevents the AMPH-induced increase in glutamate transmission
In both VTA and LC presynaptic terminals, TH catalyzes the formation of DA, which is then actively transported into presynaptic vesicles by VMAT2. Unlike VTA terminals, LC vesicles contain DβH that rapidly hydroxylates DA to NE. Loss of TH in either neuronal type prevents the formation of DA and in LC, and the formation of NE as well.
To examine whether TH knockdown in the LC is sufficient to prevent the D1R-mediated increase in glutamate transmission with AMPH treatment, C57BL/6 mice were bilaterally injected with adeno-associated virus (1 μl) driving the expression of THsiRNA (AAV-THsiRNA) or the control scramble peptide (AAV-SCR; Hommel et al., 2003) in either the LC or VTA. Animals were held for 10–30 d in the vivarium before slice preparation and experimentation. In representative images it is clear that TH staining is preserved when animals are injected with AAV-SCR in LC compared with minimal to absent staining following bilateral AAV-THsiRNA injection (Fig. 3A; top). To quantify the extent of knockdown, the percentage fluorescence was calculated. Slices from AAV-THsiRNA-injected mice had a percentage fluorescence of 43.2 ± 7% (n = 10) relative to that measured in slices from AAV-SCR-injected mice (SCR, 100 ± 21%; n = 3; unpaired t test; p < 0.01). The precision of injections was examined in two ways. Using GFP as the reporter, we examined the diffusion of virus and quantified the percentage diffusion in the rostral/caudal axis to be 72.2 ± 10.1%. (Fig. 3A; middle). Furthermore, TH staining in the VTA was not different between mice injected with AAV-THsiRNA or AAV-SCR in LC (Fig. 3A; bottom, left), again, indicating injections were targeted to LC.
Importantly, AMPH increases glutamate transmission in extracellular fEPSP recordings in slices from AAV-SCR-injected mice but fails to elicit a comparable response in slices from AAV-THsiRNA-injected mice (THsiRNA, 100 ± 4%; SCR, 120 ± 8%; Mann–Whitney test; p < 0.02; Fig. 3B). However, application of SKF to slices from AAV-THsiRNA-injected mice increases glutamate transmission (SKF, 126 ± 8%; AMPH AAV-THsiRNA-injected vs SKF Mann–Whitney test; p < 0.02; Fig. 3C), suggesting the inability of AMPH treatment to increase glutamate transmission in slices from these mice does not reflect a deficit in D1R activation.
To confirm the DA released in hippocampus does not come from dopaminergic fibers originating in the VTA, mice were injected with either AAV-THsiRNA or AAV-SCR in the VTA. As shown in Figure 4A, we observed the percentage fluorescence of AAV-THsiRNA-injected mice was 15.4 ± 2% (n = 4) of that measured in slices from AAV-SCR-injected mice (SCR, 100 ± 11%; n = 5; unpaired t test; p < 0.0004) As with our LC injections we also measured the extent of viral diffusion in the rostral/caudal axis using the GFP reporter and calculated that the percentage diffusion was 87.9 ± 4.4%. As expected, application of AMPH increased glutamate transmission in slices from either VTA, AAV-THsiRNA-injected, or AAV-SCR-injected mice (THsiRNA, 119 ± 4%; SCR, 120 ± 8%; Mann–Whitney test; p > 0.05; Fig. 4B). Further, SKF bath application increased glutamate transmission above baseline (SKF, 135 ± 1%; SKF vs AMPH AAV-THsiRNA-injected Mann–Whitney test; p > 0.05; Fig. 4C). These findings indicate noradrenergic release of DA is responsible for the DA-mediated increase in glutamate transmission.
Functional NET but not DAT is required for the AMPH stimulated increase in glutamate transmission
NET expression is localized to noradrenergic terminals where it facilitates transport of NE and DA as well as AMPH into presynaptic terminals via a sodium chloride-dependent process (Amara and Kuhar, 1993; Borgkvist et al., 2011; Ramamoorthy et al., 2011). This is similar to the active transport of DA via the serotonin transporter (SERT; Larsen et al., 2011). On the other hand, DAT is expressed exclusively on DA terminals. Therefore, if DA is released from noradrenergic fibers, then blockade of NET should prevent the AMPH-induced increase in glutamate transmission.
Treatment of hippocampal slices with nisoxetine (5 μm; NET inhibitor) prevented the AMPH-mediated increase in glutamate transmission (AMPH, 139 ± 6%; AMPH + Nisox, 103 ± 5%; Mann–Whitney test; p < 0.003; Fig. 5A). This blockade was not the result of a direct action at D1Rs, as application of SKF in the presence of nisoxetine 10 min after AMPH application increased glutamate transmission (AMPH + Nisox, 104 ± 2%; SKF, 122 ± 6%; Mann–Whitney test; p < 0.04; Fig. 5B), even though AMPH was unable to induce a comparable response. On the other hand, treatment of hippocampal slices with GBR12935 (5 μm; DAT inhibitor) did not prevent the increase in glutamate transmission (GBR, 128 ± 6%; AMPH vs AMPH + GBR; Mann–Whitney test; p > 0.05; Fig. 5C). These findings indicate that the increase in glutamate transmission with AMPH treatment is due to DA efflux through NET, which further supports a requirement for noradrenergic fibers in the DA-dependent increase in glutamate transmission.
Figure 5.

Activation of NET but not DAT is required for the AMPH-induced increase in glutamate transmission. A, Plot shows application of the NET inhibitor nisoxetine prevents increase in glutamate transmission with AMPH (AMPH, 139 ± 6%; n = 6; AMPH + Nisoxetine, 103 ± 5%; n = 8; p < 0.003). B, Plot shows application of SKF increases glutamate transmission in the presence of nisoxetine even though prior application of AMPH failed to increase transmission (AMPH + Nisox, 104 ± 2%; SKF, 122 ± 6%; n = 6; p < 0.04). C, Plot shows application of the DAT inhibitor GBR12935 does not prevent the AMPH-mediated increase in glutamate transmission (GBR12935, 128 ± 6%; n = 6; AMPH vs AMPH + GBR p > 0.05). Error bars indicate SEM.
Discussion
In the dorsal CA1 field of the hippocampus, the primary source of DA is found in LC terminals, and to a far lesser extent (indicated by fewer fibers), VTA terminals. Under baseline conditions intracellular DA in LC terminals is actively concentrated into synaptic vesicles by VMAT2 via a proton pumping ATPase-dependent process (Johnson, 1988; Fig. 6), where it is hydroxylated to NE by LC, vesicular DβH. AMPH, after being transported intracellularly by either membrane transporter, NET for LC or DAT for VTA, prevents the active concentration of DA into vesicles by disruption of VMAT2 activity. In the absence of vesicular concentration, DA accumulates, intracellularly, in the presynaptic terminal and may then flux down its concentration gradient into the extracellular space through the ion exchange mechanism of NET (Fig. 6).
Figure 6.

Under normal conditions, DA is converted into NE via DβH in vesicles of noradrenergic terminals. Following action potential stimulation substrate is released. DA and NE are transported back into the presynaptic terminal via NET and once intracellular into vesicles by VMAT2. In the presence of AMPH (AMPH is transported intracellularly into LC terminals by NET) VMAT2 function is prevented and MAO is blocked. The former action prevents concentration of DA in vesicles where DβH is located, preventing formation of NE and increasing intracellular concentrations of DA. Inhibition of MAO prevents the breakdown of DA to DOPAC, which further increases the intracellular concentration of DA. The increased cytosolic concentration of DA may result in reverse transport of DA to the extracellular media via NET down its concentration gradient where it interacts with D1Rs.
We observed that a decrease, on the average, of 56.2 ± 7% of TH in LC neurons is sufficient to prevent the D1R-mediated increase in glutamate transmission induced by AMPH. Importantly, the loss of dopaminergic input from VTA has no effect on the magnitude of the AMPH-induced, D1R-mediated, increase in glutamate transmission. We further show that application of AMPH in the presence of NET but not DAT inhibition replicates these results, supporting a requirement for noradrenergic input in the DA-mediated alterations in hippocampal synaptic transmission. These findings are in direct contrast to previous assumptions that D1R activation in the CA1 of DH results primarily from DA released from dopaminergic fibers innervating hippocampus from the VTA. Evidence does indicate dopaminergic fibers project to hippocampus from VTA (Scatton et al., 1980; Gasbarri et al., 1994, 1997; Fig. 2), but the gross disparity between scarce to absent dopaminergic fiber density and robust D1R staining in DH (see Fig. 2 for reference) cannot be ignored. In this study we present the first data demonstrating direct release of DA from noradrenergic LC fibers in the CNS. The LC fibers densely innervate the hippocampal formation, and the release of DA from LC fibers is required for the AMPH-mediated increase in glutamate transmission.
AMPH can induce VMAT2 dysfunction, at least in part through reduction of a vesicular pH gradient established by a proton pumping ATPase (Sulzer and Rayport, 1990). This proton gradient is coupled to drive VMAT2 substrate-proton exchange resulting in vesicular concentration of DA (Schuldiner et al., 1995), Under baseline conditions, DA is rapidly removed from the intracellular medium of the LC terminals, and concentrated into the vesicles by VMAT2 (Schuldiner et al., 1995). Disruption of the VMAT2 concentrating ability by AMPH can result in an increase in intracellular DA in the LC terminals that may facilitate reverse transport by NET, down the DA concentration gradient, to the extracellular space (Fig. 6).
There is considerable evidence to suggest heterologous transport of DA by the family of membrane monoamine transporters (Kitayama and Dohi, 1996). Recently, it was shown that the serotonin transporter (SERT) actively transports DA in a faster and mechanistically distinct manner than serotonin transport (Larsen et al., 2011). Similarly, NET has a higher affinity for DA than for NE (Horn, 1973; Devoto and Flore, 2006) with NET contributing to DA extracellular clearance in hippocampus (Guiard et al., 2008).
The polarity of the flux of the membrane monoamine transporters can be reversed under certain conditions. The essential driving force for the transport of substrate into presynaptic terminals by these membrane transporters is the ionic gradient established by the sodium-potassium ATPase (Torres et al., 2003). Alterations in this ionic gradient can disrupt the inward transport of substrate and promote the reverse transport into the extracellular space (Pifl et al., 1997), as occurs when the concentration of extracellular sodium and chloride is lowered (Pifl et al., 1997). Following action potential generation there is a transient rise in intracellular sodium and chloride which may promote neurotransmitter efflux through monoamine transporters. Evidence also shows that inhibition of the sodium-potassium ATPase will increase release of substrate, which is independent of vesicular release and is blocked by NET antagonists (Schömig et al., 1988). Therefore, it is possible that monoamine transporters may reverse the transport of substrate, including DA from LC terminals, under physiological conditions, perhaps involving increased presynaptic activity.
Of further consideration is the role of the noradrenergic system as part of both the DA-dependent learning and memory and reward systems. The AMPH effects observed in this study, suggest that a DA-mediated tone can originate from noradrenergic terminals, to activate DA receptors. Activation of D1 receptors in the hippocampus, necessary for hippocampal-dependent learning and memory (O'Carroll et al., 2006; Bethus et al., 2010), might then occur only under conditions inducing release of DA from LC terminals.
A physiological release of DA in the hippocampus by reverse transport of the NET, might be considered as a potential limiting factor for the therapeutic use of NET inhibitors in the treatment of mood related disorders such as depression (Nemeroff and Owens, 2002) since they would prevent transport of DA in either direction. Accordingly, agents that directly activate DA receptors could prove to be rational adjuncts to those resistant to therapy with NET or SERT inhibitors.
Moreover, it is clear that reinforcement behavior in addiction requires hippocampal D1R activation, as infusion of D1R antagonist into the hippocampus blocks methamphetamine-induced reinforcement (Ricoy and Martinez, 2009). It is interesting, given the sparse innervation of dopaminergic fibers in hippocampus, that our data indicate the noradrenergic system may be the primary origin of DA-mediated control of hippocampal output in response to drugs of abuse. Based on our current findings, we propose the release of DA from noradrenergic fibers in hippocampus is key to learning states and, potentially rewarding influences as well, in addictive processes and potentially, in health.
Footnotes
This work was supported by NIH Grant 5R01MH080297 awarded to R.W.G. and by the Department of Veterans Affairs. We gratefully acknowledge the technical support from P. Canas and T. Thai, the helpful discussions with A. Eisch and I. Bowen concerning the histochemical data, and the kind gift of the plasmids used to generate the AAV-siRNA and controls from R. DiLeone, Department of Psychiatry, Yale University School of Medicine.
The authors declare no competing financial interests.
References
- Amara SG, Kuhar MJ. Neurotransmitter transporters: recent progress. Annu Rev Neurosci. 1993;16:73–93. doi: 10.1146/annurev.ne.16.030193.000445. [DOI] [PubMed] [Google Scholar]
- Bethus I, Tse D, Morris RG. Dopamine and memory: modulation of the persistence of memory for novel hippocampal NMDA receptor-dependent paired associates. J Neurosci. 2010;30:1610–1618. doi: 10.1523/JNEUROSCI.2721-09.2010. [DOI] [PMC free article] [PubMed] [Google Scholar]
- Borgkvist A, Malmlof T, Feltmann K, Lindskog M, Schilstrom B. Dopamine in the hippocampus is cleared by the norepinephrine transporter. Int J Neuropsychopharmacol. 2011 doi: 10.1017/S1461145711000812. [DOI] [PubMed] [Google Scholar]
- Ciliax BJ, Nash N, Heilman C, Sunahara R, Hartney A, Tiberi M, Rye DB, Caron MG, Niznik HB, Levey AI. Dopamine D(5) receptor immunolocalization in rat and monkey brain. Synapse. 2000;37:125–145. doi: 10.1002/1098-2396(200008)37:2<125::AID-SYN7>3.0.CO;2-7. [DOI] [PubMed] [Google Scholar]
- de Mello MC, Pinheiro MC, de Mello FG. Transient expression of an atypical D1-like dopamine receptor system during avian retina differentiation. Braz J Med Biol Res. 1996;29:1035–1044. [PubMed] [Google Scholar]
- Devoto P, Flore G. On the origin of cortical dopamine: is it a co-transmitter in noradrenergic neurons? Curr Neuropharmacol. 2006;4:115–125. doi: 10.2174/157015906776359559. [DOI] [PMC free article] [PubMed] [Google Scholar]
- Devoto P, Flore G, Saba P, Fà M, Gessa GL. Stimulation of the locus coeruleus elicits noradrenaline and dopamine release in the medial prefrontal and parietal cortex. J Neurochem. 2005a;92:368–374. doi: 10.1111/j.1471-4159.2004.02866.x. [DOI] [PubMed] [Google Scholar]
- Devoto P, Flore G, Saba P, Fà M, Gessa GL. Co-release of noradrenaline and dopamine in the cerebral cortex elicited by single train and repeated train stimulation of the locus coeruleus. BMC Neurosci. 2005b;6:31. doi: 10.1186/1471-2202-6-31. [DOI] [PMC free article] [PubMed] [Google Scholar]
- Engelbrecht AH, Russell V, Carstens ME, De Villiers AS, Searson A, Jaffer A, Taljaard JJ. Evidence that noradrenergic neurons in the A1 and A2 nuclei are lesioned by low doses of 6-OHDA injected into the locus coeruleus. J Neurosci Methods. 1994;52:57–60. doi: 10.1016/0165-0270(94)90056-6. [DOI] [PubMed] [Google Scholar]
- Gao C, Sun X, Wolf ME. Activation of D1 dopamine receptors increases surface expression of AMPA receptors and facilitates their synaptic incorporation in cultured hippocampal neurons. J Neurochem. 2006;98:1664–1677. doi: 10.1111/j.1471-4159.2006.03999.x. [DOI] [PubMed] [Google Scholar]
- Gasbarri A, Packard MG, Campana E, Pacitti C. Anterograde and retrograde tracing of projections from the ventral tegmental area to the hippocampal formation in the rat. Brain Res Bull. 1994;33:445–452. doi: 10.1016/0361-9230(94)90288-7. [DOI] [PubMed] [Google Scholar]
- Gasbarri A, Sulli A, Innocenzi R, Pacitti C, Brioni JD. Spatial memory impairment induced by lesion of the mesohippocampal dopaminergic system in the rat. Neuroscience. 1996;74:1037–1044. doi: 10.1016/0306-4522(96)00202-3. [DOI] [PubMed] [Google Scholar]
- Gasbarri A, Sulli A, Packard MG. The dopaminergic mesencephalic projections to the hippocampal formation in the rat. Prog Neuropsychopharmacol Biol Psychiatry. 1997;21:1–22. doi: 10.1016/s0278-5846(96)00157-1. [DOI] [PubMed] [Google Scholar]
- Gonzalez-Islas C, Hablitz JJ. Dopamine enhances EPSCs in layer II-III pyramidal neurons in rat prefrontal cortex. J Neurosci. 2003;23:867–875. doi: 10.1523/JNEUROSCI.23-03-00867.2003. [DOI] [PMC free article] [PubMed] [Google Scholar]
- Guiard BP, El Mansari M, Blier P. Cross-talk between dopaminergic and noradrenergic systems in the rat ventral tegmental area, locus ceruleus, and dorsal hippocampus. Mol Pharmacol. 2008;74:1463–1475. doi: 10.1124/mol.108.048033. [DOI] [PubMed] [Google Scholar]
- Hommel JD, Sears RM, Georgescu D, Simmons DL, DiLeone RJ. Local gene knockdown in the brain using viral-mediated RNA interference. Nat Med. 2003;9:1539–1544. doi: 10.1038/nm964. [DOI] [PubMed] [Google Scholar]
- Horn AS. Structure-activity relations for the inhibition of catecholamine uptake into synaptosomes from noradrenaline and dopaminergic neurones in rat brain homogenates. Br J Pharmacol. 1973;47:332–338. doi: 10.1111/j.1476-5381.1973.tb08331.x. [DOI] [PMC free article] [PubMed] [Google Scholar]
- Huang YY, Kandel ER. D1/D5 receptor agonists induce a protein synthesis-dependent late potentiation in the CA1 region of the hippocampus. Proc Natl Acad Sci U S A. 1995;92:2446–2450. doi: 10.1073/pnas.92.7.2446. [DOI] [PMC free article] [PubMed] [Google Scholar]
- Johnson RG., Jr Accumulation of biological amines into chromaffin granules: a model for hormone and neurotransmitter transport. Physiol Rev. 1988;68:232–307. doi: 10.1152/physrev.1988.68.1.232. [DOI] [PubMed] [Google Scholar]
- Jones BE, Moore RY. Ascending projections of the locus coeruleus in the rat. II. Autoradiographic study. Brain Res. 1977;127:25–53. [PubMed] [Google Scholar]
- Kawahara H, Kawahara Y, Westerink BH. The noradrenaline-dopamine interaction in the rat medial prefrontal cortex studied by multi-probe microdialysis. Eur J Pharmacol. 2001;418:177–186. doi: 10.1016/s0014-2999(01)00863-9. [DOI] [PubMed] [Google Scholar]
- Kitayama S, Dohi T. Cellular and molecular aspects of monoamine neurotransmitter transporters. Jpn J Pharmacol. 1996;72:195–208. doi: 10.1254/jjp.72.195. [DOI] [PubMed] [Google Scholar]
- Kiyosawa A, Katsurabayashi S, Akaike N, Pang ZP, Akaike N. Nicotine facilitates glycine release in the rat spinal dorsal horn. J Physiol. 2001;536:101–110. doi: 10.1111/j.1469-7793.2001.t01-1-00101.x. [DOI] [PMC free article] [PubMed] [Google Scholar]
- Larsen MB, Sonders MS, Mortensen OV, Larson GA, Zahniser NR, Amara SG. Dopamine transport by the serotonin transporter: a mechanistically distinct mode of substrate translocation. J Neurosci. 2011;31:6605–6615. doi: 10.1523/JNEUROSCI.0576-11.2011. [DOI] [PMC free article] [PubMed] [Google Scholar]
- Laurier LG, O'Dowd BF, George SR. Heterogeneous tissue-specific transcription of dopamine receptor subtype messenger RNA in rat brain. Brain Res Mol Brain Res. 1994;25:344–350. doi: 10.1016/0169-328x(94)90170-8. [DOI] [PubMed] [Google Scholar]
- Lemon N, Manahan-Vaughan D. Dopamine D1/D5 receptors gate the acquisition of novel information through hippocampal long-term potentiation and long-term depression. J Neurosci. 2006;26:7723–7729. doi: 10.1523/JNEUROSCI.1454-06.2006. [DOI] [PMC free article] [PubMed] [Google Scholar]
- Levey AI, Hersch SM, Rye DB, Sunahara RK, Niznik HB, Kitt CA, Price DL, Maggio R, Brann MR, Ciliax BJ. Localization of D1 and D2 dopamine receptors in brain with subtype-specific antibodies. Proc Natl Acad Sci U S A. 1993;90:8861–8865. doi: 10.1073/pnas.90.19.8861. [DOI] [PMC free article] [PubMed] [Google Scholar]
- Li DP, Chen SR, Pan YZ, Levey AI, Pan HL. Role of presynaptic muscarinic and GABA(B) receptors in spinal glutamate release and cholinergic analgesia in rats. J Physiol. 2002;543:807–818. doi: 10.1113/jphysiol.2002.020644. [DOI] [PMC free article] [PubMed] [Google Scholar]
- Lisman JE, Grace AA. The hippocampal-VTA loop: controlling the entry of information into long-term memory. Neuron. 2005;46:703–713. doi: 10.1016/j.neuron.2005.05.002. [DOI] [PubMed] [Google Scholar]
- Malinow R, Mainen ZF, Hayashi Y. LTP mechanisms: from silence to four-lane traffic. Curr Opin Neurobiol. 2000;10:352–357. doi: 10.1016/s0959-4388(00)00099-4. [DOI] [PubMed] [Google Scholar]
- Meador-Woodruff JH, Mansour A, Grandy DK, Damask SP, Civelli O, Watson SJ., Jr Distribution of D5 dopamine receptor mRNA in rat brain. Neurosci Lett. 1992;145:209–212. doi: 10.1016/0304-3940(92)90024-2. [DOI] [PubMed] [Google Scholar]
- Navakkode S, Sajikumar S, Frey JU. Synergistic requirements for the induction of dopaminergic D1/D5-receptor-mediated LTP in hippocampal slices of rat CA1 in vitro. Neuropharmacology. 2007;52:1547–1554. doi: 10.1016/j.neuropharm.2007.02.010. [DOI] [PubMed] [Google Scholar]
- Nemeroff CB, Owens MJ. Treatment of mood disorders. Nat Neurosci. 2002;5:1068–1070. doi: 10.1038/nn943. [DOI] [PubMed] [Google Scholar]
- O'Carroll CM, Martin SJ, Sandin J, Frenguelli B, Morris RG. Dopaminergic modulation of the persistence of one-trial hippocampus-dependent memory. Learn Mem. 2006;13:760–769. doi: 10.1101/lm.321006. [DOI] [PMC free article] [PubMed] [Google Scholar]
- Otmakhova NA, Lisman JE. D1/D5 dopamine receptors inhibit depotentiation at CA1 synapses via cAMP-dependent mechanism. J Neurosci. 1998;18:1270–1279. doi: 10.1523/JNEUROSCI.18-04-01270.1998. [DOI] [PMC free article] [PubMed] [Google Scholar]
- Pifl C, Agneter E, Drobny H, Reither H, Singer EA. Induction by low Na+ or Cl- of cocaine sensitive carrier-mediated efflux of amines from cells transfected with the cloned human catecholamine transporters. Br J Pharmacol. 1997;121:205–212. doi: 10.1038/sj.bjp.0701137. [DOI] [PMC free article] [PubMed] [Google Scholar]
- Rajji T, Chapman D, Eichenbaum H, Greene R. The role of CA3 hippocampal NMDA receptors in paired associate learning. J Neurosci. 2006;26:908–915. doi: 10.1523/JNEUROSCI.4194-05.2006. [DOI] [PMC free article] [PubMed] [Google Scholar]
- Ramamoorthy S, Shippenberg TS, Jayanthi LD. Regulation of monoamine transporters: role of transporter phosphorylation. Pharmacol Ther. 2011;129:220–238. doi: 10.1016/j.pharmthera.2010.09.009. [DOI] [PMC free article] [PubMed] [Google Scholar]
- Ricoy UM, Martinez JL., Jr Local hippocampal methamphetamine-induced reinforcement. Front Behav Neurosci. 2009;3:47. doi: 10.3389/neuro.08.047.2009. [DOI] [PMC free article] [PubMed] [Google Scholar]
- Scammell TE, Arrigoni E, Thompson MA, Ronan PJ, Saper CB, Greene RW. Focal deletion of the adenosine A1 receptor in adult mice using an adeno-associated viral vector. J Neurosci. 2003;23:5762–5770. doi: 10.1523/JNEUROSCI.23-13-05762.2003. [DOI] [PMC free article] [PubMed] [Google Scholar]
- Scatton B, Simon H, Le Moal M, Bischoff S. Origin of dopaminergic innervation of the rat hippocampal formation. Neurosci Lett. 1980;18:125–131. doi: 10.1016/0304-3940(80)90314-6. [DOI] [PubMed] [Google Scholar]
- Schömig A, Kurz T, Richardt G, Schömig E. Neuronal sodium homoeostatis and axoplasmic amine concentration determine calcium-independent noradrenaline release in normoxic and ischemic rat heart. Circ Res. 1988;63:214–226. doi: 10.1161/01.res.63.1.214. [DOI] [PubMed] [Google Scholar]
- Schuldiner S, Shirvan A, Linial M. Vesicular neurotransmitter transporters: from bacteria to humans. Physiol Rev. 1995;75:369–392. doi: 10.1152/physrev.1995.75.2.369. [DOI] [PubMed] [Google Scholar]
- Seddik R, Schlichter R, Trouslard J. Modulation of GABAergic synaptic transmission by terminal nicotinic acetylcholine receptors in the central autonomic nucleus of the neonatal rat spinal cord. Neuropharmacology. 2006;51:77–89. doi: 10.1016/j.neuropharm.2006.03.007. [DOI] [PubMed] [Google Scholar]
- Smith WB, Starck SR, Roberts RW, Schuman EM. Dopaminergic stimulation of local protein synthesis enhances surface expression of GluR1 and synaptic transmission in hippocampal neurons. Neuron. 2005;45:765–779. doi: 10.1016/j.neuron.2005.01.015. [DOI] [PubMed] [Google Scholar]
- Sulzer D, Rayport S. Amphetamine and other psychostimulants reduce pH gradients in midbrain dopaminergic neurons and chromaffin granules: a mechanism of action. Neuron. 1990;5:797–808. doi: 10.1016/0896-6273(90)90339-h. [DOI] [PubMed] [Google Scholar]
- Swanson LW. The projections of the ventral tegmental area and adjacent regions: a combined fluorescent retrograde tracer and immunofluorescence study in the rat. Brain Res Bull. 1982;9:321–353. doi: 10.1016/0361-9230(82)90145-9. [DOI] [PubMed] [Google Scholar]
- Torres GE, Gainetdinov RR, Caron MG. Plasma membrane monoamine transporters: structure, regulation and function. Nat Rev Neurosci. 2003;4:13–25. doi: 10.1038/nrn1008. [DOI] [PubMed] [Google Scholar]
- Xu ZQ, Shi TJ, Hökfelt T. Galanin/GMAP- and NPY-like immunoreactivities in locus coeruleus and noradrenergic nerve terminals in the hippocampal formation and cortex with notes on the galanin-R1 and -R2 receptors. J Comp Neurol. 1998;392:227–251. doi: 10.1002/(sici)1096-9861(19980309)392:2<227::aid-cne6>3.0.co;2-4. [DOI] [PubMed] [Google Scholar]
- Yang SN. Sustained enhancement of AMPA receptor- and NMDA receptor-mediated currents induced by dopamine D1/D5 receptor activation in the hippocampus: an essential role of postsynaptic Ca2+ Hippocampus. 2000;10:57–63. doi: 10.1002/(SICI)1098-1063(2000)10:1<57::AID-HIPO6>3.0.CO;2-0. [DOI] [PubMed] [Google Scholar]
- Zarrindast MR, Dorrani M, Lachinani R, Rezayof A. Blockade of dorsal hippocampal dopamine receptors inhibits state-dependent learning induced by cannabinoid receptor agonist in mice. Neurosci Res. 2010;67:25–32. doi: 10.1016/j.neures.2010.02.001. [DOI] [PubMed] [Google Scholar]