Abstract
Structural changes during the treatment of films of highly crystalline microfibers of Cladophora cellulose with ethylenediamine (EDA) have been studied by time-resolved X-ray microprobe diffraction methods. As EDA penetrates the sample and converts cellulose I to EDA-cellulose I, the measured profile widths of reflections reveal changes in the shapes and average dimensions of cellulose I and EDA-cellulose I crystals. The (200) direction of cellulose I is most resistant to EDA penetration, with EDA penetrating most effectively at the hydrophilic edges of the hydrogen bonded sheets of cellulose chains. Most of the cellulose chains in the initial crystals of cellulose I are incorporated into crystals of EDA-cellulose I. The size of the emerging EDA-cellulose I crystals is limited to about half of their size in cellulose I, most likely due to strains introduced by the penetration of EDA molecules. There is no evidence of any gradual structural transition from cellulose I to EDA-cellulose I involving a continuously changing intermediate phase. Rather, the results point to a rapid transition to EDA-cellulose I in regions of the microfibrils that have been penetrated by EDA.
Keywords: X-ray crystallography, Time-resolved, Cellulose, Ethylenediamine, Scanning microprobe
Introduction
Cellulose is produced in nature as crystalline microfibrils that are inert to most solvents. Furthermore, the melting point of crystalline cellulose is above its decomposition temperature of around 350°C (Kim et al. 2001). Although this high chemical and thermal resistance is an important advantage for the biological function of cellulose, it makes the industrial transformation of cellulose into other compounds difficult. Ammonia and small diamines such as 1,2-diaminoe-thane (also known as ethylenediamine or EDA) are among the few molecules that can efficiently penetrate cellulose crystals. When combined with various salts, ammonia and EDA can completely dissolve crystalline cellulose (Xiao and Frey 2007). When applied on their own, ammonia or EDA molecules can penetrate naturally occurring crystalline cellulose to form intercalated complexes (Wada et al. 2006, 2008, 2009). On removal of ammonia or EDA by washing with polar, but non-aqueous, solvents there is a conversion to another crystal form, cellulose IIII (Chanzy et al. 1986, 1987; Wada et al. 2001, 2004). Cellulose IIII has been termed activated because of its enhanced reactivity towards certain types of cellulases (Igarashi et al. 2007). Both ammonia and EDA are being explored for use in pulping and pretreatments of cellulosic biomass to improve its conversion to glucose and biofuels (Teymouri et al. 2005; Xiao and Frey 2007).
We have previously determined crystal structures for the two naturally occurring allomorphs of cellulose, cellulose Iα and Iβ (Nishiyama et al. 2002, 2003) which are collectively referred to as cellulose I; the complexes formed when cellulose I is treated with either ammonia or EDA called ammonia-cellulose I and EDA-cellulose I, respectively (Wada et al. 2006, 2008, 2009); and cellulose IIII (Wada et al. 2004) using a combination of techniques including X-ray and neutron crystallography and 13C CP/MAS NMR. The unit cell parameters of the crystal structures are shown in Table 1. These studies have provided some insights into the mechanisms of the interaction of amines with cellulose. Whereas in the Iα and Iβ phases of cellulose I the chains are hydrogen bonded within sheets that stack on top of each other through hydrophobic interactions, in ammonia-cellulose I and EDA-cellulose I the hydrophobic stacking interactions between sheets are replaced by hydrogen bond bridges formed by the guest amine molecules. In fact in EDA-cellulose I there is no direct hydrogen bonding between the cellulose chains, even within the sheets; they are isolated and bridged by EDA guest molecules. The intrinsic stability of these amine-cellulose complexes can be intuitively understood as resulting from the complementarity of the hydrogen bonding potential of the donor deficient cellulose chains (the O4 and O5 atoms of cellulose do not have hydroxyl hydrogen atoms) and the acceptor deficient amines (EDA has two donor protons for each acceptor group), which leads to extensive hydrogen bond networks in the complexes. On the other hand, the amine molecules have to penetrate and diffuse inside the rigid crystalline cellulose. In this study we examine the process of penetration and diffusion of EDA into cellulose.
Table 1.
The unit cell parameters of cellulose Iα, cellulose Iβ, EDA-cellulose I, and cellulose IIII (Nishiyama et al. 2002, 2003; Wada et al. 2004, 2006, 2008, 2009)
| Crystal phase | Space group | a (Å) | b (Å) | c (Å) | α (°) | β (°) | γ (°) |
|---|---|---|---|---|---|---|---|
| Cellulose Iα | P1 | 6.717 | 5.962 | 10.40 | 118.08 | 114.80 | 80.37 |
| Cellulose Iβ | P21 | 7.784 | 8.201 | 10.38 | 90.00 | 90.00 | 96.50 |
| EDA-cellulose I | P21 | 4.546 | 11.330 | 10.37 | 90.00 | 90.00 | 94.02 |
| Cellulose IIII | P21 | 4.450 | 7.850 | 10.31 | 90.00 | 90.00 | 105.10 |
Our previous determination of the crystal structure of EDA-cellulose I was possible only because samples of the complex could be prepared which were stable over periods of time long enough for full data collection. For X-ray and NMR data collection this corresponded to several hours and for neutron data collection several days. We report here time-resolved X-ray diffraction data that were collected from a cellulose sample as it underwent continuous conversion from cellulose I to EDA-cellulose I in order to better understand the process of EDA penetration.
In this study oriented films of large and highly crystalline fibers of Cladophora cellulose were used. These fibers contain a mixture of crystalline domains of the Iα and Iβ allomorphs in a ratio of approximately 4:1, respectively (Wada and Okano 2001). They are much larger and more crystalline than those found, predominantly in the Iβ form, in plant cell walls. Importantly, they produce particularly sharp diffraction features that can be accurately characterized and monitored over the time course of the penetration of EDA and the transition from cellulose I to EDA-cellulose I, extending over a period of several hours. The high intensity of the X-ray beam of the BioCAT beam line at the Advanced Photon Source in combination with a CCD camera allowed us to achieve a time resolution of 2 s per diffraction image. In order to process the hundreds of resulting images sophisticated data analysis tools had to be developed to extract the values of important parameters in batch mode. All of these factors were important for the success of this study. The results presented here provide us with new insights into the detailed interaction of EDA with cellulose.
Experimental section
Sample preparation and X-ray data collection
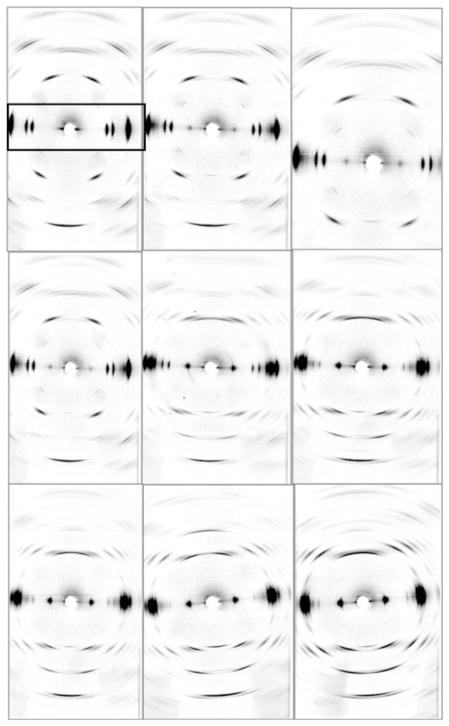
Highly oriented films of crystalline cellulose I, each around 1 cm × 1 mm × 100 μm in size, were prepared from Cladophora sp. as previously described (Nishiyama et al. 1997; Wada et al. 2006). A film was mounted on the scanning stage of the BioCAT beam line in microprobe geometry, and diffraction patterns were recorded every 17 s on a CCD detector. The sample to detector distance was 50 mm and the FWHH of the direct beam on the detector was about 20 μm. The exposure time was 2 s with a detector duty time of ~ 15 s (λ = 1.033 Å). The sample was kept dry under a stream of dry nitrogen, at room temperature. Whilst collecting the series of images the sample was stepped by 10 μm in between each image, in order to reduce the effects of radiation damage. After recording the first few images, a drop of anhydrous EDA was applied directly to the sample just before image 13, and further images were collected as the EDA penetrated the sample and conversion from cellulose I to EDA-cellulose occurred. Just before images 48, 68 and 85, when the diffraction data appeared not to be changing significantly, further drops of anhydrous EDA were applied to the sample. Further into the series, at around image 90, the sample was removed and soaked in anhydrous EDA for a few minutes. Around image 120 the sample was removed a second time and soaked in EDA for an hour or so. A total of 200 diffraction images were collected. Figure 1 shows a selection of nine representative diffraction images taken over the course of the experiment.
Fig. 1.
A representative selection of time-resolved diffraction images collected during the conversion of cellulose I to EDA-cellulose. The order of the images is from the left to right and from top to bottom (images 9, 13, 20, 40, 58, 114, 125, 186 and 200). The images in the top left and bottom right hand corners therefore correspond to the start and end of the transition. The fiber axis and the equator are vertical and horizontal, respectively. The equatorial region is indicated in the first image by a box. Note the slight increase in azimuthal angle (fiber axis direction) between the seventh and eighth images
Electron microscopy
The cell wall of Cladophora sp. was purified by repetitive treatment with 5% KOH and 0.3% NaClO2 solutions. The purified cell wall was dehydrated in a graduated series of ethanol and acetone mixtures, and embedded in epoxy resin (Spurr). Ultrathin sections were cut with a diamond knife mounted on an MT-5000 ultra-microtome and deposited on carbon-coated Cu grids. The grids were observed with a JEM-2000 EXII electron microscope operated at an accelerating voltage of 200 kV. The image shown in Fig. 2 was taken under diffraction contrast in the bright-field mode, and recorded on Mitsubishi electron microscope film (MEM).
Fig. 2.
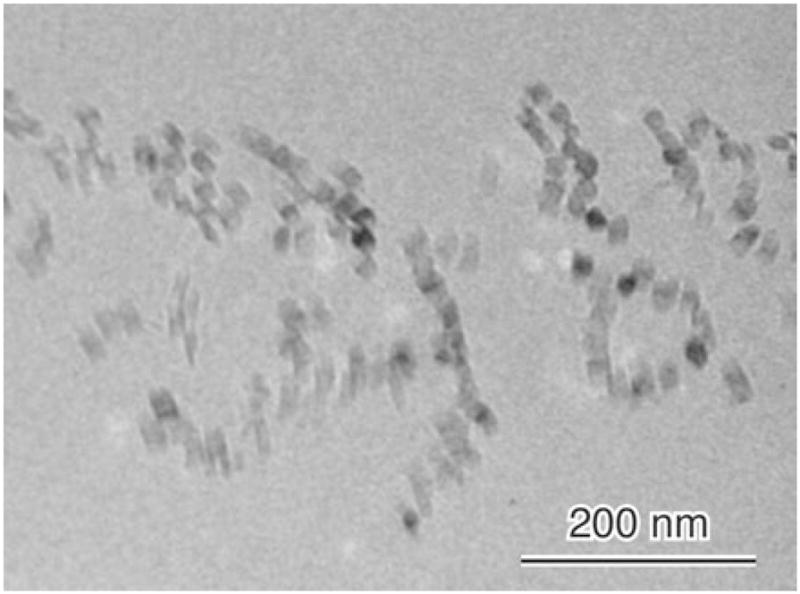
An image of the cross sections of the microfibers taken under diffraction contrast in the bright-field mode, and recorded on a Mitsubishi electron microscope film
Data processing
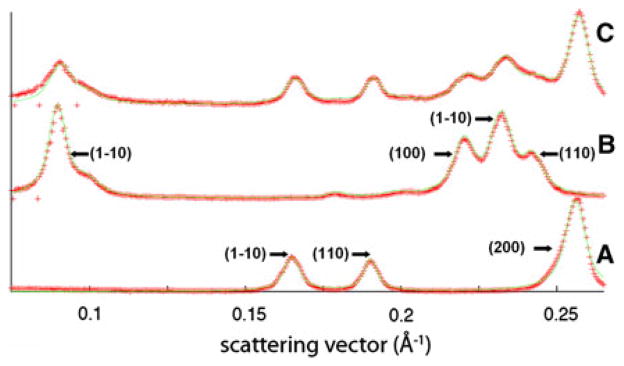
The beam center, detector rotation, and sample tilt of several representative detector images were determined using the program suite FiberFix. (Rajkumar et al. 2007). After subtracting background scattering (using the rolling ball method in FiberFix with a radius of 50 pixels, followed by the circularly symmetric method with a pixel range of 0–25%), the images were then remapped into cylindrical reciprocal space. Lines scans in the cylindrical radial direction were made of the equator. It was found that all the reflections in these scans could be fitted by a combination of the known lattices for cellulose I and EDA-cellulose I, as shown in Fig. 3. The positions of these reflections did not change significantly over the course of the transition, indicating that the sizes of the unit cells for cellulose I and EDA-cellulose I remained constant. The relative intensities of reflections belonging to only cellulose I, or to only EDA-cellulose I, also did not change over the course of the transition, indicating that the crystal structures of cellulose I and EDA-cellulose I remained constant. However, the intensities and radial profile widths of reflections belonging to cellulose I compared to those of EDA-cellulose I did change over the course of the transition, indicating changes in the size of crystal domains and the relative proportions of cellulose I and EDA-cellulose I.
Fig. 3.
Cylindrical radial traces along the equator from detector images collected at the a start, b end, and c an intermediate point, in the series can be fitted by a combination of the two unit cells of cellulose I and EDA-cellulose I, indicating that there is no change in unit cells. The red crosses represent the observed intensity in the radial traces and the green solid line represents the fit to that intensity. The major reflections for cellulose I and EDA-cellulose I are indicated in a and b, respectively
Each detector image was then processed in batch mode in order to extract the radial profile widths and relative intensities of equatorial reflections, assuming constant unit cell values for cellulose I and EDA-cellulose. For each detector image, first the sample tilt and rotation were determined by fitting the polar angles of four equivalent reflections at constant reciprocal radius. The image was then transformed into polar reciprocal space where contributions from different parts of the detector image to each pixel in polar reciprocal space were averaged with an associated standard deviation. This standard deviation allowed the scattering background to be estimated using the maximum entropy method. In polar reciprocal space the reflections belonging to each lattice can be treated as having the same profiles and a whole pattern fitting approach can be taken to easily extract the parameters of these profiles.
The principal equatorial reflections up to a resolution of 3.8 Å (corresponding to 3 composite diffraction peaks for cellulose I and 4 for EDA-Cellulose I) were fitted using a pseudo-Voigt function with a fixed Gaussian/Lorentzian ratio of 1. Each of the three composite equatorial peaks for cellulose I contains overlapping contributions from the Iα and Iβ allomorphs. Specifically, the (100), (010) and (110) reflections from Iα overlap with the (1–10), (110) and (200) reflections from Iβ, respectively. In our analysis the overlapping contributions were treated as one peak, and we refer to them by their Iβ Miller indices.
During refinement, first the peak positions, intensities, and radial profile widths for the cellulose I reflections were fitted against the data collected at the start of the transition. Similarly the peak positions, intensities, and radial profile widths for the EDA cellulose I reflections were fitted against the data collected at the end of the transition. For the intermediate stages of the transition, the diffraction data were fitted by a linear combination of the reflections from cellulose I and cellulose-EDA. The profile widths and intensities were allowed to vary, however the relative intensities of reflections from the same crystal form were constrained. From the refined radial profiles Scherrer dimensions were calculated, as described in previous studies (e.g. Kennedy et al. 2007; Leppänen et al. 2009), but with the Scherrer constant, K, set at a value of 1.0. Instrumental broadening was not included in this calculation due to the relatively small size and divergence of the synchrotron X-ray beam. In summary:
The amounts of cellulose I and EDA-cellulose I were fitted by allowing the intensities of reflections to refine with two shift parameters to compensate for small sample rotations (see difference between the seventh and eighth images in Fig. 1) and the drift of incident beam, whilst constraining the relative intensities of reflections from the same crystal phase. This involved four refinement parameters.
The peak-widths were allowed to refine, with the shift parameters. For the weak reflections, the peak widths were restrained to stabilize the refinement. This involved 10 refinement parameters.
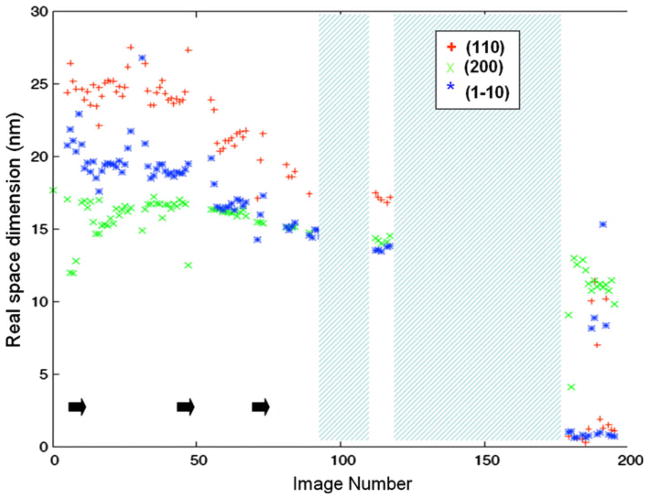
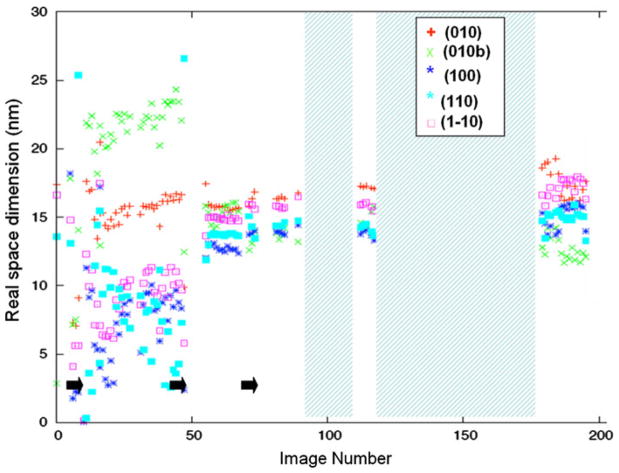
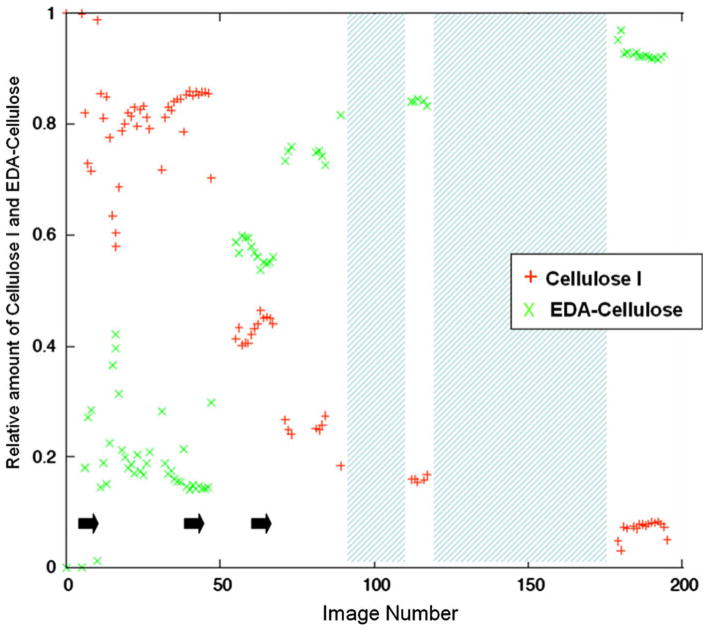
Figure 4 plots the Scherrer dimensions determined from the radial widths of the (110), (200) and (1–10) reflections of cellulose I, and Fig. 5 plots the Scherrer dimensions determined from the radial widths of the (010), (100), (1–10) and (110) reflections of EDA-cellulose I, for each detector image. The positions of these reflections on the equator are shown in Fig. 3. Figure 6 shows the relative proportions of cellulose I and EDA-cellulose I for each detector image.
Fig. 4.
Real space dimensions determined from the radial widths of the (1–10), (110) and (200) reflections of cellulose I for each detector image. Points during the transition at which EDA was dropped onto the sample are indicated by black arrows. Periods during which the sample was removed and soaked in EDA are represented by cross-hatched areas
Fig. 5.
Real space dimensions determined from the radial widths of the (010), (100), (1–10) and (110) reflections of EDA-cellulose I, for each detector image. Points during the transition at which EDA was dropped onto the sample are indicated by black arrows. Periods during which the sample was removed and soaked in EDA are represented by cross-hatched areas
Fig. 6.
The relative amounts of cellulose I and EDA-cellulose I for each detector image. Points during the transition at which EDA was dropped onto the sample are indicated by black arrows. Periods during the transition during which the sample was removed and soaked in EDA are represented by cross-hatched areas
Results and discussion
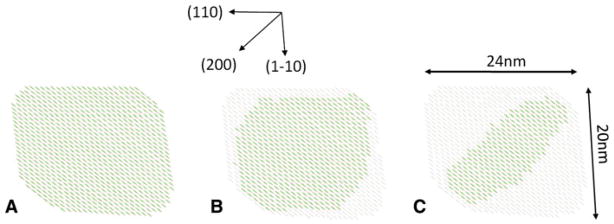
The Scherrer dimensions determined in the directions of the different reflections from a crystal phase allow us to define an approximate cross sectional shape for the corresponding crystal domain. From the profile widths of the reflections at the start of this series of diffraction images we represent the average of the cross sections of the initial cellulose I crystal domains by a six sided polygon with dimensions of ~24 nm × 20 nm × 17 nm in the (110), (1–10), and (200) directions respectively. However, as Ken-nedy and coworkers have discussed, the radial profile widths of reflections originating from crystal domains with heterogeneous cross sectional shapes should not be expected to conform to simple Scherrer theory (Kennedy et al. 2007). In particular, for the square and rectangular cross sections with dominant hydrophilic (110) and (1–10) faces typically observed for bacterial cellulose microfibrils (Nishiyama 2009), the Scherrer dimension for the (200) direction will be a significant underestimate of actual crystal size in this direction. We have therefore represented the cross-section as approximately rectangular with similarly sized (110) and (1–10) sides of 24 nm and 20 nm, respectively, as shown in Fig. 7a. This is consistent with the shape and size of the cross-sections observed in the electron microscopy image taken under diffraction contrast in bright field mode, Fig. 2.
Fig. 7.
Schematic representation of the average of the cross sectional shapes of the cellulose I crystals (black regions) at (a) the start of the transition (b) at around the 50/50 point during the transition (c) towards the end of the transition. Regions that no longer correspond to crystalline cellulose I are represented in a lighter shade
The cross-sectional shape in Fig. 2 would appear to have rounded corners, so the exact dimension in the (200) direction, and therefore the relative size of this face, is not well defined. This type of cleaving of the corners to reveal a small (200) face has been observed for microfibrils of Cladophora cellulose immobilized on a graphite substrate in recent AFM studies of cellulose hydrolysis by cellulase (Igarashi et al. 2009), with a dimension of 14 nm in the (200) direction. It is possible that the microfibrils have a more rectangular cross section with sharp corners in the intact cell wall, but that during the extraction and purification process used to prepare the samples in this study the edges of the rectangles become cleaved along the (200) plane, as has been previously observed with microfibrils from cellulose from tunicate (Helbert et al. 1998). However, the focus of this study is not on the absolute dimensions of the crystal domains but rather relative changes in those dimensions during treatment with EDA.
As EDA penetrates into the sample, over the time course of the series of diffraction images, this average cross-section contracts in an anisotropic manner; dimensions in the (110) and (1–10) direction decrease more rapidly than in the (200) direction, Fig. 4. The (200) direction corresponds approximately to the stacking direction of the sheets in cellulose I. At the point at which approximately half of cellulose I has been converted (around image 50), the Scherrer dimensions in the (200) and (1–10) directions are approximately equal (~15 nm). We designate this point the 50/50 point. Towards the end of the series, after image 170 when the proportion of cellulose I to EDA-cellulose I is less than 10%, it becomes difficult to make accurate measurements of the radial profiles of the (110) and (1–10) reflections. Their approximate Scherrer dimensions drop below the value for the (200) reflection. The radial profile of the (200) reflection can be quite accurately measured throughout the experiment and indicates a Scherrer dimension of about 11 nm just before diffraction from cellulose I completely disappears at the end of the series.
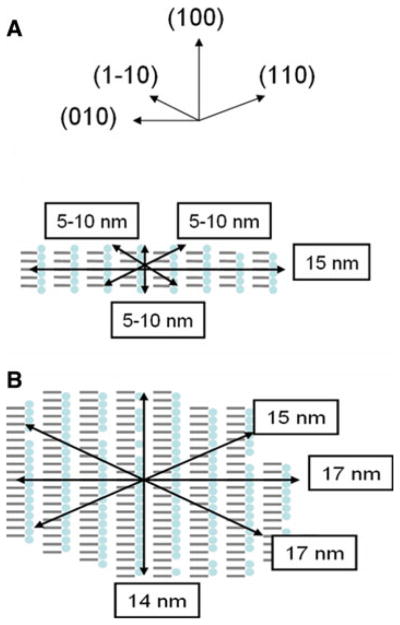
From the radial profile widths of the reflections at the end of this series of diffraction images we can represent the average of the cross sections of the final EDA-cellulose I crystal domains by an eight sided polygon with dimensions of ~14 nm × 17 nm × 15 nm × 17 nm in the (100), (010), (110) and (1–10) directions, although this shape is only an approximation. Over the course of the experiment, as EDA penetrates the sample, this average cross-section increases in an anisotropic manner with the width in the (010) direction changing the least, Fig. 5. The (010) direction corresponds to the direction in the plane of the sheets and perpendicular to the chain axis in EDA-cellulose I, and the (100) direction corresponds approximately to the stacking direction of the sheets. As the average of the cross-sections of the cellulose I crystals decrease and those of the EDA-cellulose I crystals increase there is a corresponding increase in the proportion of EDA-cellulose I compared to cellulose I until the 50/50 point. Beyond the 50/50 point, although the proportion of EDA-cellulose I compared to cellulose I continues to increase and the Schererr dimensions of cellulose I crystal domains continue to decrease, there is little further increase in the Scherrer dimensions of the EDA-cellulose I crystal domains.
The fact that we are able to observe gradual changes in the Scherrer dimensions of cellulose I and EDA-cellulose I crystal domains indicates that the penetration of EDA into the macroscopic film of cellulose microfibrils, probably due to capillary forces, is much faster than the penetration of EDA into the individual crystal domains. In an ideal situation we could therefore model the sample as behaving macroscopically in a homogeneous way, with each microfibril undergoing EDA penetration in synchronization. If the sample behaved in a heterogeneous way, with EDA penetrating different crystal domains at different times and with different rates, then we would observe no gradual change in Scherrer dimensions. In reality however, it is unlikely that the sample will behave in a completely homogeneous manner because of natural variations in the cross sections (polydispersity) of the microfibrils and the possibility of variations in EDA diffusion rates within the extent of the sample. Therefore, the Scherrer dimensions of the crystal domains at any stage of the experiment represent only an average of a distribution of dimensions throughout the sample. With that in mind, we summarize the results and cautiously interpret them as follows.
As EDA penetrates the crystals of cellulose I there is a relatively small decrease in the average dimension of the crystals in the (200) stacking direction and more rapid decreases in the other directions. Towards the end of the experiment, just before diffraction from cellulose I completely disappears, the average dimensions of the crystals in the (200) stacking direction has decreased by about only 30%, whereas the average dimensions of the crystals in the other directions are too small to measure. This change in the average dimensions of the cellulose I crystals is consistent with the (200) direction being quite resistant to EDA penetration and with the EDA molecules penetrating preferentially the hydrophilic edges of the stacked sheets of cellulose, as represented schematically in Fig. 7.
As the cellulose I crystals are penetrated by EDA, crystals of EDA-cellulose I appear. The initial average dimensions of these crystals are largest (~15 nm) in the (010) plane of cellulose sheets (which is perpendicular to their stacking direction) and smaller in the other directions (~5–10 nm). As EDA penetration progresses the average dimension of these crystals in the plane of the sheets swells by about only 10% to 17 nm, but the average dimensions in the other directions swell by much greater amounts. In particular, the average dimension in the direction of the stacked sheets swells from 5–10 nm to 15 nm. However, although the average size of the cellulose I crystals continues to decrease as EDA penetration progresses, the rate of swelling of the EDA-cellulose I crystals decreases and the crystal have almost reached their maximum size by the 50/50 point, as shown in Fig. 8. Beyond the 50/50 point the relative proportion of EDA-cellulose I continues to increase, suggesting that the number of EDA-cellulose I crystals is growing but that their average size increases only slightly.
Fig. 8.
Schematic representation of the average of the cross sectional shapes of the EDA-cellulose I crystals at a the start of the transition and b towards the end of the transition
At the 50/50 point at which EDA-cellulose I crystals have almost reached their maximum average dimensions, the average cross sectional area of cellulose I crystals has decreased by about 50% (to ~20 nm × 15 nm × 15 nm in the (110), (1–10) and (200) directions). From the initial average cross-sectional area of the cellulose I crystals (about 400 nm2) and the area per cellulose chain in the unit cell of cellulose I (31.5 Å2) we can estimate that about 650 chains have been lost from an average cellulose I crystal by the 50/50 point. Since the area per cellulose chain in the unit cell of EDA-cellulose I is 51.5 Å2 if all of the cellulose chains lost from cellulose I crystals are incorporated into new EDA-cellulose I crystals then we would expect an average EDA-cellulose I crystal to have a final cross sectional area of about 300 nm2. This corresponds quite closely with the observed value of about 250 nm2 and suggests that a large proportion of the cellulose chains lost to crystals of cellulose I have been incorporated into crystals of EDA-cellulose I at the 50/50 point.
The final value of the average dimension of the EDA-cellulose I crystals in the sheet stacking direction (~14 nm) is similar to its value in the sheet stacking direction of the initial crystals of cellulose I (~17 nm). The final value of the average dimension of the EDA-cellulose I crystals in the plane of the sheet and perpendicular to the cellulose chain direction (~17 nm) is significantly smaller than its approximate value in the initial crystals of cellulose I. It is difficult to get an accurate approximation of this dimension in crystals of cellulose I because it is so dependent on the exact shape of the cross sectional area, but we would expect it to be significantly larger than the Scherrer dimensions for the (110) and (1–10) reflections (i.e. ≫24 nm). Although the crystals of EDA-cellulose I appear to grow to almost the same size as crystals of cellulose I in the sheet stacking direction, they would appear to grow to about only half the size in the direction of the plane of the sheets. If a crystal of cellulose I were to be completely converted into a crystal of EDA-cellulose I then we would expect its volume to be approximately doubled. This is not the case and clearly indicates the occurrence of fracturing.
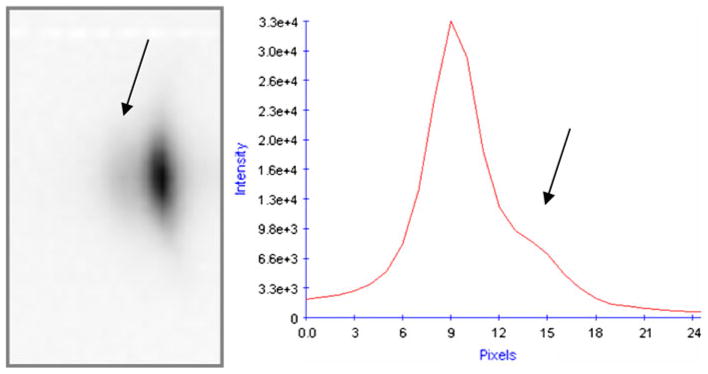
Another interesting observation is that there are weak diffraction features recorded during the conversion that cannot be fitted by the two corresponding reciprocal space lattices of cellulose I or EDA cellulose I. Specifically, there are distinct shoulders on the peaks of the (010) and (012) reflections of EDA-cellulose I. The shoulder on (010), referred to as (010b), can be clearly seen, indicated by an arrow, in the close up of the reflection shown in Fig. 9. There are no equivalent shoulders on reflections with Miller indices h = 1, k = 0. These shoulders may reflect the presence of a phase, with a similar unit cell to that of EDA-cellulose I, but in which there is disorder in the b axis, but not the a axis, direction. In this disordered phase there would be a range of contracted values for the unit cell parameter in the b axis direction. Shoulders do not appear to be present on any reflections with Miller index k > 1, indicating that this diffraction feature may be due to short range disorder in b-axis direction. The relative intensity of (010b) compared to that of (010) decreases as the conversion progresses and its profile width increases (the Scherrer dimension decreases from around 22 to 13 nm). This diffraction feature may correspond to regions in which the EDA molecules have penetrated the hydrogen bonded sheets, but have not yet disrupted the hydrogen bonds within those sheets. However, it may also represent disordered interface regions between EDA-cellulose I crystallites, or surface regions that have lost EDA due to the evaporative effect of the dry nitrogen stream.
Fig. 9.
The presence of a shoulder on the peak of the (010) reflection of EDA-cellulose I
Conclusions
Using time-resolved X-ray microprobe diffraction methods we have revealed changes in the average dimensions and shapes of cellulose I and EDA-cellulose I crystals, as represented in Fig. 7 and 8, during the penetration of films of Cladophora microfibrils by EDA. The main result is that the (200) direction of cellulose I is quite resistant to EDA penetration and that the EDA molecules penetrate preferentially the hydrophilic edges of the stacked sheets. There are several possible explanations for this but the exact molecular mechanism of EDA penetration remains to be determined. Finally, as the EDA molecules penetrate the microfibrils they would appear to cause strains or crystal defects that limit the size of crystals of the EDA-cellulose I complex in their (100) direction. Such defects have been observed in microfibrils of cellulose IIII after removal of EDA, using transmission electron microscopy (Roche and Chanzy 1981). Our results suggest that these defects may be introduced during swelling with EDA, rather than on its removal.
Acknowledgments
We thank BIOCAT at the Advanced Photon Source for use of facilities. We also thank Raul Barrea and Joseph Orgel for help with data collection. MW was supported by a Grant-in-Aid for Scientific Research (18780131). This study was partly funded by the French Agence Nationale de la Recherche. PL was supported in part by the Office of Biological and Environmental Research of the Department of Energy and a Laboratory Directed Research and Development grant from Los Alamos National Laboratory (20080001DR).
Contributor Information
Yoshiharu Nishiyama, Centre de Recherches sur les Macromolécules, Végétales—CNRS, Joseph Fourier University of Grenoble, BP 53, 38041 Grenoble Cedex 9, France.
Masahisa Wada, Department of Biomaterials Science, Graduate School of Agricultural and Life Sciences, The University of Tokyo, Tokyo 113-8657, Japan. Department of Plant & Environmental New Resources, College of Life Sciences, Kyung Hee University, 1, Seocheon-dong, Giheung-ku, Yongin-si, Gyeonggi-do 446-701, Korea.
B. Leif Hanson, Department of Chemistry, University of Toledo, 2801W. Bancroft, Toledo, OH 43606, USA.
Paul Langan, Email: langan_paul@lanl.gov, Bioscience Division, Los Alamos National Laboratory, Los Alamos, NM 87545, USA.
References
- Chanzy H, Henrissat B, Vuong R, Revol JF. Structural changes of cellulose crystals during the reversible transformation cellulose I—cellulose III in Valonia. Holzforschung. 1986;40:25–30. [Google Scholar]
- Chanzy H, Henrissat B, Vincendon M, Tanner S, Belton PS. Solid-State C13 NMR and electron microscopy study on the reversible cellulose I—Cellulose IIII trans-formation in Valonia. Carbohydr Res. 1987;160:1–11. [Google Scholar]
- Helbert W, Nishiyama Y, Okano T, Sugiyama J. Molecular imaging of Halocynthia papillosa cellulose. J Struct Biol. 1998;124:42–50. doi: 10.1006/jsbi.1998.4045. [DOI] [PubMed] [Google Scholar]
- Igarashi K, Wada M, Samejima M. Activation of crystalline cellulose to cellulose IIII results in efficient hydrolysis by cellobiohydrolase. FEBS J. 2007;274:1785–1792. doi: 10.1111/j.1742-4658.2007.05727.x. [DOI] [PubMed] [Google Scholar]
- Igarashi K, Koivula A, Wada M, Kimura S, Penttila M, Samejima M. High speed atomic force microscopy visualizes processive movement of trichoderma reesei cellobiohydrolase I on crystalline cellulose. J Biol Chem. 2009;284:36186–36190. doi: 10.1074/jbc.M109.034611. [DOI] [PMC free article] [PubMed] [Google Scholar]
- Kennedy CJ, Cameron GJ, Šturcová A, Apperley DC, Altaner C, Wess TJ, Jarvis MC. Microfibril diameter in celery collenchyma cellulose: x-ray scattering and NMR evidence. Cellulose. 2007;14:235–246. [Google Scholar]
- Kim D-Y, Nishiyama Y, Wada M, Kuga S, Okano T. Thermal decomposition of cellulose crystallites in wood. Holzforchung. 2001;55:521–524. [Google Scholar]
- Leppänen K, Andersson S, Torkkeli M, Knaapila M, Kotelnikova N, Serimaa R. Structure of cellulose and microcrystalline cellulose from various wood species, cotton and flax studied by X-ray scattering. Cellulose. 2009;16:999–1015. [Google Scholar]
- Nishiyama Y. Structure and properties of the cellulose microfibril. J Wood Sci. 2009;55:241–249. [Google Scholar]
- Nishiyama Y, Kuga S, Wada M, Okano T. Cellulose microcrystal film of high uniaxial orientation. Macromolecules. 1997;30:6395–6397. [Google Scholar]
- Nishiyama Y, Langan P, Chanzy H. Crystal structure and hydrogen-bonding system in cellulose Iβ from synchrotron X-ray and neutron fiber diffraction. J Am Chem Soc. 2002;124:9074–9082. doi: 10.1021/ja0257319. [DOI] [PubMed] [Google Scholar]
- Nishiyama Y, Sugiyama J, Chanzy H, Langan P. Crystal structure and hydrogen bonding system in cellulose Iα from synchrotron X-ray and neutron fiber diffraction. J Am Chem Soc. 2003;125:14300–14306. doi: 10.1021/ja037055w. [DOI] [PubMed] [Google Scholar]
- Rajkumar G, AL-Khayat HA, Eakins F, Knupp C, JSquire JM. The CCP13 FibreFix program suite: semi-automated analysis of diffraction patterns from non-crystalline materials. J Appl Cryst. 2007;40:178–184. doi: 10.1107/S0021889806048643. [DOI] [PMC free article] [PubMed] [Google Scholar]
- Roche E, Chanzy H. Electron microscopy study of the transformation of cellulose I into cellulose IIII in valonia. Int J Biol Macromol. 1981;3:201–206. [Google Scholar]
- Teymouri F, Laureano-Perez L, Alizadeh H, Dale BE. Optimization of the ammonia fiber explosion (AFEX) treatment parameters for enzymatic hydrolysis of corn stover. Biosour Technol. 2005;96:2014. doi: 10.1016/j.biortech.2005.01.016. [DOI] [PubMed] [Google Scholar]
- Wada M, Okano T. Localization of I-apha and I-beta phases in algal cellulose revealed by acid treatments. Cellulose. 2001;8:183–188. [Google Scholar]
- Wada M, Heux L, Isogai A, Nishiyama Y, Chanzy H, Sugiyama J. Improved structural data of cellulose IIII prepared in supercritical ammonia. Macromolecules. 2001;34:1237–1243. [Google Scholar]
- Wada M, Chanzy H, Nishiyama Y, Langan P. Cellulose IIII crystal structure and hydrogen bonding by synchrotron X-ray and neutron fiber diffraction. Macromolecules. 2004;23:8548–8555. [Google Scholar]
- Wada M, Nishiyama Y, Langan P. X-ray structure of ammonia-cellulose I: new insights into the conversion of cellulose I to cellulose IIII. Macromolecules. 2006;39:2947–2952. [Google Scholar]
- Wada M, Kwon GJ, Nishiyama Y. Structure and thermal behavior of a cellulose I-ethylenediamine complex. Biomacromolecules. 2008;9:2898–2904. doi: 10.1021/bm8006709. [DOI] [PubMed] [Google Scholar]
- Wada M, Heux L, Nishiyama Y, Langan P. The structure of the complex of cellulose I with ethylenediamine by X-ray crystallography and cross/polarization/magic angle spinning 13C nuclear magnetic resonance. Cellulose. 2009;16:943–957. [Google Scholar]
- Xiao M, Frey MW. The role of salt on cellulose dissolution in ethylene diamine/salt solvent systems. Cellulose. 2007;14:225–234. [Google Scholar]


