

Abstract
The ruthenium compound KP1019 has demonstrated promising anticancer activity in a pilot clinical trial. This study aims to evaluate the intracellular uptake/binding patterns of KP1019 and its sodium salt KP1339, which is currently in a phase I–IIa study. Although KP1339 tended to be moderately less cytotoxic than KP1019, IC50 values in several cancer cell models revealed significant correlation of the cytotoxicity profiles, suggesting similar targets for the two drugs. Accordingly, both drugs activated apoptosis, indicated by caspase activation via comparable pathways. Drug uptake determined by inductively coupled plasma mass spectrometry (ICP-MS) was completed after 1 h, corresponding to full cytotoxicity as early as after 3 h of drug exposure. Surprisingly, the total cellular drug uptake did not correlate with cytotoxicity. However, distinct differences in intracellular distribution patterns suggested that the major targets for the two ruthenium drugs are cytosolic rather than nuclear. Consequently, drug–protein binding in cytosolic fractions of drug-treated cells was analyzed by native size-exclusion chromatography (SEC) coupled online with ICP-MS. Ruthenium–protein binding of KP1019- and KP1339-treated cells distinctly differed from the platinum binding pattern observed after cisplatin treatment. An adapted SEC-SEC-ICP-MS system identified large protein complexes/aggregates above 700 kDa as initial major binding partners in the cytosol, followed by ruthenium redistribution to the soluble protein weight fraction below 40 kDa. Taken together, our data indicate that KP1019 and KP1339 rapidly enter tumor cells, followed by binding to larger protein complexes/organelles. The different protein binding patterns as compared with those for cisplatin suggest specific protein targets and consequently a unique mode of action for the ruthenium drugs investigated.
Keywords: Ruthenium, Size exclusion, chromatography–inductively coupled plasma mass, spectrometry, Drug uptake, Intracellular distribution, Anticancer
Introduction
Besides surgery and radiation therapy, chemotherapy is still one of the major therapy options for treatment of human malignancies. Platinum-containing drugs such as cisplatin and oxaliplatin are frequently used in diverse therapeutic regimens [1, 2]. However, owing to often observed complications, including severe side effects or ineffectiveness through drug resistance, the need for better chemotherapeutics still exists [3]. Ruthenium compounds belong to the most promising candidates of non-platinum-containing metal complexes for cancer therapy. Recently, indazolium trans-[tetrachlorobis(1H-indazole)ruthenate (III)] (KP1019) demonstrated exciting anticancer activity in a pilot clinical phase I study with disease stabilization for 8–10 weeks in five of six treated patients [2, 4]. Notably, only mild treatment-related toxicities were observed in this study, encouraging further clinical development of KP1019 [4]. On the basis of its higher water solubility, the sodium salt of KP1019, sodium trans-[tetrachlorobis(1H-indazole)ruthenate(III)] (KP1339), has been selected as a lead candidate for further clinical development. With regard to the mode of action, KP1019 has been suggested to induce oxidative stress and DNA damage comparable to that for other metal drugs such as cisplatin [5]. Moreover, treatment with KP1019 led to apoptosis via the mitochondrial pathway [6]. Profound depolarization of the mitochondrial membrane potential was observed after 24-h incubation with KP1019 in this study, indicating that there might be additional targets involved. KP1019 is known to strongly bind to serum proteins, including albumin and transferrin [4, 7, 8]. Consequently, it has been postulated that this serum protein binding is important for the drug accumulation into the tumor, probably involving the transferrin pathway [4, 7]. As cancer cells generally express elevated levels of transferrin receptor to serve their higher need for iron [9], KP1019 was expected to accumulate preferentially in tumor tissues to exert its anticancer activity. This hypothesis of “transferrin-mediated tumor targeting” is supported by the low toxicity of KP1019 observed in the clinical phase I trial [4]. Moreover, the binding of KP1019 to serum proteins hampered P-glycoprotein-mediated KP1019 efflux, making this ruthenium drug interesting for treatment of multidrug-resistant tumor types [10].
Numerous studies have focused on the interaction of KP1019 with serum proteins, and the intracellular fate of KP1019 and KP1339 after uptake into tumor cells is widely unknown. Thus, the aim of this study was to gain more insight into the pharmacokinetics and intracellular distributions of KP1019 and KP1339, which should help to identify additional targets of these promising ruthenium compounds.
Materials and methods
Drugs
KP1019 and KP1339 were synthesized at the Institute of Inorganic Chemistry, University of Vienna, Austria, and by ChemCon (Freiburg, Germany), respectively, as previously reported [11, 12]. For in vitro studies, the compounds were dissolved in dimethyl sulfoxide and diluted into culture media at the concentrations indicated (dimethyl sulfoxide concentrations were always below 1%). Eluents were prepared from sodium hydroxide (pure pellets, Acros Organics, Geel, Belgium), hydrochloric acid (p.a. Merck, Darmstadt, Germany), tris(hydroxymethyl)aminomethane (Tris; p.a. Merck), and water purified in a water purification system (more than 18 MΩ cm resistance; HQ, USF, Vienna, Austria). HNO3 was prepared by double subboiling distillation (Milestone-MLS, Leutkirch, Germany) of analytical reagent grade acid (Merck). H2O2 (ultrapure grade) was purchased from Merck. All other substances were from Sigma-Aldrich (St. Louis, MO, USA).
Cell culture
The cervical carcinoma-derived human cell line KB-3-1 was generously donated by D.W. Shen (Bethesda, MD, USA) [13]. The primary hepatocellular carcinoma cell lines HCC1.1 and HCC1.2 had been previously established at the Institute of Cancer Research, Vienna [14]. The mesothelioma cell model P31 and its respective cisplatin-resistant subline P31/cis were generously donated by K. Grankvist (Umeå University, Sweden) [15]. The colon carcinoma cell line HCT116 was generously donated by B. Vogelstein (Johns Hopkins University, Baltimore, MD, USA) [16]. The primary mesothelioma cell line VMC was established from patient material at the Institute of Cancer Research, Vienna. Additionally, the hepatocellular carcinoma cell line Hep3B and the colon carcinoma cell line SW480 (both from American Type Culture Collection, Manassas, VA, USA) were used. SW480 cells were grown in minimal essential medium, HCT116 cells in McCoy’s culture medium, and P31 cells in Eagle’s minimal essential medium. All other cell lines were grown in RMPI 1640 supplemented with 10% fetal bovine serum. Cultures were regularly checked for Mycoplasma contamination.
Cytotoxicity assays
Cells were plated (2 × 10³ cells in 100 μl per well) in 96-well plates and allowed to recover for 24 h. Drugs were added in another 100 μl of growth medium and cells were exposed for the time periods indicated. For pulsing experiments, test medium was replaced with fresh (drug-free) culture medium after the exposure times indicated. After 72-h drug treatment, the proportion of viable cells was determined by 3-(4,5-dimethylthiazol-2-yl)-2,5-diphenyltetrazolium bromide assay following the manufacturer’s recommendations (EZ4U kit, Biomedica, Vienna, Austria).
Total ruthenium uptake levels
Cell lines derived from diverse cell models (1 × 10⁵ per well) were exposed to 50 μM KP1019 or KP1339 for 60 min at 37 °C. After three washes with ice-cold phosphate-buffered saline (PBS), cells were lysed by incubation at room temperature in 400 μl tetramethylammonium hydroxide. Lysates were diluted in 0.6 N HNO3 and ruthenium concentrations were determined by inductively coupled plasma mass spectrometry (ICP-MS) using an ELAN 6100 (PerkinElmer Sciex) at the Institute for Geological Sciences, University of Vienna. The values represent means of at least three independent experiments. As unspecific binding to cell culture plastic has been shown for KP1019 [17], the results were corrected for ruthenium levels of a blank well containing no cells.
Preparation of cytosolic versus nucleic fractions
KB-3-1 cells (2 × 10⁶) were seeded in a T25 culture flask and allowed to attach for 24 h. Drugs were added in 5 ml of fresh growth medium. Cells were collected by trypsinization, washed twice with ice-cold PBS, and counted. For lysis, cell pellets were resuspended in lysis buffer containing 50 mM Tris–HCl, 300 mM NaCl, 0.5% Triton X-100. Additionally, 1 mM phenylmethylsulfonyl fluoride and 25 μl/ml “complete” protease inhibitor mix (Roche, Mannheim, Germany) were added to the buffer immediately before use. Proper cell lysis was checked microscopically by trypan blue staining. After 5-min centrifugation (14,000 rpm) at 4 °C, supernatant (cytosolic fraction) was separated from the pellet (nucleic fraction) and fractions were stored at −80 °C. Protein concentrations of the cytosolic fractions were determined using a micro bicinchoninic acid protein assay reagent kit (Pierce Biotechnology, Rockford, IL, USA).
Ruthenium levels in cytosolic and nucleic fractions
A 100-μl volume of cytosolic fraction and the full nucleic fraction of each experiment were digested with 2 ml 20% HNO3, 1 ml H2O, and 200 μl H2O2 in a high-performance microwave (MLS 1200 microwave, MLS, Leutkirch, Germany). Ruthenium levels were determined by ICP-MS. The quadrupole-based system used for these measurements was equipped with a dynamic reaction cell (ELAN DRC-II, PerkinElmer Sciex, Woodbridge, ON, Canada). Oxygen (purity 4.5, Linde Gas, Vienna, Austria) was used as the reaction gas. The values represent means of at least two independent experiments and were adjusted to the previously determined cell numbers. The values (arbitrary units) were expressed relative to the total ruthenium levels (cytosolic + nucleic) at 1-h exposure (50 μM) set arbitrarily as 1.
Size-exclusion chromatography–inductively coupled plasma mass spectrometry
Size-exclusion chromatography (SEC) was combined with ICP-MS detection using the ELAN DRC-II (PerkinElmer Sciex, Woodbridge, ON, Canada). The metal-free chromatographic system consisted of an AS 50 autosampler (including a custom-made temperature-control device), a GP 40 gradient pump, and the Chromeleon Chromatography Management System (version 6.40), all from Dionex (Sunnyvale, CA, USA). The injection volume was 25 μl. Injected samples were filtered in-line using a 0.45-μm PEEK filter located in front of the column. A BioSuite™ 125 column (300 mm × 4.6 mm UHR SEC, 4-μm particle diameter) from Waters (Milford, MA, USA) was used as the stationary phase for SEC. The eluent containing 150 mM NaCl and 20 mM Tris–HCl, pH 7.4 was delivered at a flow rate of 350 μl/min. The SEC eluent was transferred directly to the ICP-MS introduction system consisting of a perfluoroalkoxy nebulizer and a cyclonic spray chamber. The values were assessed from four independently prepared samples.
The SEC column utilized for these experiments provided a size-exclusion limit of 150 kDa; hence, proteins larger than 150 kDa could not be separated and eluted in the void volume of the column at 6 min. A retention time of 8 min corresponded to the size range 80–60 kDa. Low molecular weight compounds as, e.g., peptides or metallothioneins, had a retention time of more than 10 min. A retention time of 13–14 min corresponded to small molecules (e.g. inorganic salts) [18]. The low molecular weight fraction was defined as the integral of the ruthenium response from 11 to 14 min in the SEC chromatogram.
Tandem size-exclusion chromatography–inductively coupled plasma mass spectrometry
SEC-SEC-ICP-MS was performed by coupling two separation columns in-line in combination with ICP-MS detection using the ELAN DRC-II (PerkinElmer Sciex, Woodbridge, ON, Canada). The first column (BioSep-SEC-S 4000, 300 mm × 7.8 mm, 5 μm particle diameter) had an exclusion limit of 2,000 kDa and the second had a separation range from 66 to 670 kDa (BioSep-SEC-S 3000, 300 mm × 7.8 mm, 5-μm particle diameter), both from Phenomenex (Phenomenex, Aschaffenburg, Germany). The flow rate applied was 1 ml/min (injection volume 25 μl).
Cell fractionation
KB-3-1 cells (107) were seeded in a T150 culture flask and allowed to attach for 24 h. KP1019 or KP1339 was added in 20 ml of fresh growth medium. After 3-h drug incubation, cells were collected by trypsinization, washed twice with ice-cold PBS, and counted. After another centrifugation step, cell pellets were resuspended in Douce buffer containing 10 mM Tris–HCl pH 7.6 and 0.5 mM MgCl2. Additionally, 1 mM phenylmethylsulfonyl fluoride and 25 μl/ml “complete” protease inhibitor mix (Roche, Mannheim, Germany) were added to the buffer immediately before use. After 15-min incubation on ice, cells were lysed by Douce homogenization. Total cell lysis was checked microscopically by trypan blue staining. After addition of NaCl (final concentration 150 mM), homogenates were centrifuged for 5 min at 3,500g. Pellets were separated from supernatants, washed once, and stored at −80 °C (fraction I). The supernatants were supplemented with EDTA (final concentration 5 mM) and centrifuged at 100,000g for 1 h at 4 °C. The resulting supernatant was stored at −80 °C (fraction II). The pellets (fraction III) were resuspended in lysis buffer containing 50 mM Tris–HCl, 300 mM NaCl, 0.5% Triton X-100, 1 mM phenylmethylsulfonyl fluoride, and 25 μl/ml “complete” protease inhibitor mix (Roche, Mannheim, Germany). Also this fraction was stored at −80 °C. Protein concentrations of the cytosolic fractions were determined using a micro bicinchoninic acid protein assay reagent kit (Pierce Biotechnology, Rockford, IL, USA).
4′,6-Diamidino-2-phenylindole staining
KB-3-1 cells (1 × 10⁵ per well) were plated in six well plates and after 24 h of recovery were treated with various concentrations of KP1019 and KP1339. After 24 h, cells were harvested, cytospins were prepared, and apoptosis was evaluated by staining with 4′,6-diamidino-2-phenylindole (DAPI) containing antifade solution (Vector Laboratories, Burlingame, CA, USA). The nuclear morphology of cells was examined with a Leica DMRXA fluorescence microscope (Leica Mikroskopie and System, Wetzlar, Germany) equipped with appropriate epifluorescence filters and a Cohu charge-coupled-device camera. For each concentration at least two slides were evaluated, whereby at least 250 nuclei per experimental group were analyzed.
Western blot analyses
After 24 h of drug exposure, proteins were isolated, resolved by sodium dodecyl sulfate polyacrylamide gel electrophoresis, and transferred onto a poly(vinylidene difluoride) membrane for western blotting as described in [19, 20]. The anti-poly(ADP-ribosyl)polymerase (PARP), cleaved PARP, caspase 3, caspase 9, caspase 7, and cleaved caspase 7 antibodies (all polyclonal rabbit) from an apoptosis sampler kit (Cell Signalling Technology, Beverly, MA, USA) and the anti-β-actin monoclonal mouse AC-15 (Sigma) were used in a 1:1,000 dilution. Additionally, horseradish peroxidase labeled antibodies from Santa Cruz Biotechnology were used at working dilutions of 1:10,000.
Mitochondrial membrane potential detection
KB-3-1 cells (1 × 10⁶ per well) were seeded in T25 flasks. After 24-h recovery, cells were treated with various concentrations of KP1019 and KP1339 for another 24 h. Cell staining was performed as published [21]. Cell suspensions were incubated with 10 μl/ml of the fluorescent dye 5,5′,6,6′-tetrachloro-1,1′,3,3′-tetraethylbenzimidazolylcarbocyanine iodide (JC-1; mitochondrial membrane potential detection kit; Stratagene, La Jolla, CA, USA) in full culture medium for 10 min at 37 °C. At the end of the incubation period, cells were washed twice with cold PBS, resuspended in PBS, and analyzed by flow cytometry using a Calibur fluorescence-activated cell sorting instrument (Becton-Dickinson, Palo Alto, CA, USA).
Statistical analysis
Linear regression analyses were performed using GraphPad Prism 4.0 (GraphPad Software, La Jolla, CA, USA).
Results
Exposure-time dependency of cytotoxicity
The anticancer activity of KP1339 was compared with that of KP1019 after 72 h in several cancer cell lines (Table 1). For both drugs, the colon cancer cell line HCT116 was found to be most responsive, whereas the mesothelioma cell model P31 and P31/cis displayed the highest resistance. In general, KP1339 tended to be less cytotoxic than KP1019, with a mean IC50 values of 93.1 μM for KP1019 and 115.1 μM for KP1339 over all cell lines tested. However, linear regression analysis of the respective IC50 values revealed significant correlation of the anticancer activity of KP1019 and KP1339 (p = 0.0035). With regard to exposure time dependency, the ruthenium drugs were tested by pulsing experiments using KB-3-1 cells. To this end, KP1019- and KP1339-containing test mediums were replaced with fresh culture medium after 1-, 2-, and 3-h exposure for a total experimental time of 72 h (Fig. 1). Again KP1019 displayed moderately enhanced cytotoxicity at all time points tested. With regard to the exposure-time dependency, as little as 1 h of drug contact induced significant anticancer activity, with IC50 values of 136 μM for KP1019 and 182 μM for KP1339. Moreover, 3 h of drug contact was found to be sufficient for about 95% anticancer activity (3-h IC50 values of KP1019 and KP1339 were 85.0 and 117.6 μM, respectively, versus 82.6 and 108.9 μM after 72 h).
Table 1.
IC50 values after 72 h
| KP1019 (μM) |
KP1339 (μM) |
|||
|---|---|---|---|---|
| IC50 | SD | IC50 | SD | |
| KB-3-1 | 99.3 | 29.3 | 135.3 | 25.8 |
| HCC1.1 | 108.1 | 56.0 | 148.9 | 42.1 |
| HCC1.2 | 82.9 | 0.2 | 88.3 | 26.4 |
| Hep3B | 98.4 | 25.3 | 143.1 | 15.3 |
| SW480 | 58.2 | 21.4 | 110.2 | 31.7 |
| HCT116 | 36.6 | 17.0 | 34.7 | 3.6 |
| P31 | 151.2 | 12.9 | 148.0 | 9.2 |
| P31/cis | 147.0 | 8.0 | 150.0 | 0.8 |
| VMC | 56.4 | 9.6 | 77.5 | 6.3 |
SD standard deviation
Fig. 1.

Exposure-time dependency of KP1019 and KP1339 cytotoxicity. Pulsing experiments were performed in KB-3-1 cells by replacing a KP1019- and b KP1339-containing test mediums after 1, 2, and 3 h with fresh culture medium. Following a total experimental time of 72 h, cell vitality was determined by 3-(4,5-dimethylthiazol-2-yl)-2,5-diphenyltetrazolium bromide assays. The values given are means and standard deviations (SD) of three independent experiments in triplicate
Comparison of KP1019 and KP1339 drug uptake
To evaluate whether the higher cytotoxicity of KP1019 (compared with KP1339) might be based on enhanced drug uptake, total intracellular ruthenium levels were determined by ICP-MS after 1-h incubation. In general, drug uptake was detectable at levels of nanograms of ruthenium per 105 cells for both drugs. In most cell lines tested, KP1019 accumulation was up to twofold higher than KP1339 uptake (mean of all cell lines, 4.4 ng ruthenium per 105 cells for KP1019 vs. 2.3 ng ruthenium per 105 cells for KP1339; Table 2). Comparable to the vitality assays, linear regression analysis revealed significant correlation of KP1019 and KP1339 uptake (p = 0.049). However, no correlation between total cellular drug uptake and cytotoxicity was found in the case of both drugs (KP1019 p = 0.76 and KP1339 p = 0.81), indicating that mere drug accumulation is not decisive for the exerted level of cytotoxicity.
Table 2.
Total uptake after 1-h exposure using 50 μM of the respective drug
| KP1019 |
KP1339 |
|||
|---|---|---|---|---|
| Ru/105 cells (ng) | ±SD | Ru/105 cells (ng) | ±SD | |
| KB-3-1 | 5.3 | 0.56 | 3.0 | 0.06 |
| HCC1.1 | 7.7 | 2.55 | 5.1 | 0.96 |
| HCC1.2 | 4.4 | 0.35 | 3.1 | 0.46 |
| Hep3B | 7.5 | 0.43 | 3.2 | 0.14 |
| SW480 | 2.6 | 0.15 | 2.4 | 0.40 |
| HCT116 | 3.0 | 0.3 | 1.4 | 1.5 |
| P31 | 2.4 | 0.66 | 0.24 | 0.36 |
| P31/cis | 1.9 | 0.35 | ND | − |
| VMC | 5.59 | 0.51 | 1.97 | 0.15 |
ND below detection limit
Comparison of KP1019- and KP1339-induced apoptosis
Next, it was tested whether the difference in activity of KP1019 and KP1339 is accompanied by differences in the induction of apoptosis. To this end KB-3-1 cells were treated with increasing concentrations of KP1019 and KP1339 for 24 h (Fig. 2a, b). Pronounced apoptosis induction was observed after treatment with 150 μM (38.9%) and 200 μM (77.1%) KP1019. In accordance with the cytotoxicity and uptake data, apoptosis levels induced by KP1339 were distinctly lower at these concentrations (11.5 and 12.9%, respectively). Treatment with 400 μM KP1339 strongly increased the proportion of apoptotic cells to 93.7%. Additionally, apoptotic body formation after KP1019 and KP1339 treatment was accompanied with an increase in cleavage of caspase 7 as well as of the caspase substrate PARP, another indicator for apoptotic cell death (Fig. 2c). In contrast to reports on SW480 cells [6], no caspase 3 cleavage was observed.
Fig. 2.

Comparison of the apoptosis-inducing potential of KP1019 with KP1339. a Induction of apoptosis in KB-3-1 cells was determined after treatment for 24 h. 4′,6-Diamidino-2-phenylindole (DAPI) staining of nuclei is shown in untreated controls and cells treated with the drug concentrations indicated. b Morphological features of 300–500 nuclei of at least two slides for each concentration were analyzed by DAPI staining. The percentages of normal, mitotic, and apoptotic/necrotic nuclei at the concentrations indicated are shown. c Apoptosis-induced cleavage of poly(ADP-ribosyl)polymerase (PARP), caspase 7, and caspase 3 in KB-3-1 and Hep3B cells after 24-h treatment was determined via western blot. The antibodies used are described in “Materials and methods”
As a next step, the mitochondrial integrity was determined by JC-1 staining after 24-h treatment with KP1019 and KP1339 (Fig. 3a). A detectable increase (from 4.57 to 8.33%) of cells with depolarized mitochondria was observed using only 100 μM KP1019. Treatment with 200 μM KP1019 resulted in profound mitochondrial depolarization (78.72%). KP1339 was about half as active as KP1019, with 7.03% of cells with depolarized mitochondria at 200 μM and 65.67% of ealls at 400 μM.
Fig. 3.

Characterization of KP1019 and KP1339 apoptosis. a Loss of mitochondrial membrane potential after 24-h treatment was determined by 5,5′,6,6′-tetrachloro-1,1′,3,3′-tetraethylbenzimidazolylcarbocyanine iodide (JC-1) staining. Increase of the green fluorescent apoptotic populations of KB-3-1 cells at the drug concentrations indicated (cells in the lower right field) are indicated (30,000 events were analyzed in total per group). b Effects of 30-min pretreatment with the radical scavenger N-acetylcysteine (NAC) on the anticancer activity of KP1019, KP1339, and H2O2 (positive control) were analyzed after 72-h drug exposure by an EZ4U kit
Earlier studies indicated that oxidative stress might be involved in apoptosis induction by KP1019 [5, 6]. Thus, the impact of the radical scavenger N-acetylcysteine (NAC) on the cytotoxic activity of KP1019 and KP1339 was compared. Protective NAC effects were observed for both drugs at concentrations in their IC50 range (Fig. 3b). However, this effect was significantly less pronounced as compared with that for H2O2, the positive control for oxidative stress production.
Intracellular distribution of KP1019 and KP1339
The intracellular fate of the ruthenium compounds tested is still widely unknown. Figure 4 shows the ruthenium distribution between cytoplasm and nucleic cell fractions after 1-, 3-, and 6-h treatment with 50, 75, and 150 μM KP1019 and KP1339, respectively. In accordance with already published observations [10], KP1019 and KP1339 were significantly and completely accumulated in tumor cells within the first hour of drug incubation. Further increase of the incubation time up to 6 h did not result in a change of total drug uptake or the patterns of distribution between the nucleus and the cytoplasm. This was also in good agreement with the findings of the pulsing experiment data (see Fig. 1), which had already indicated that only short drug contact is sufficient for full KP1019 and KP1339 anticancer activity. Drug uptake of KP1019 as well as KP1339 followed a linear and dose-dependent pattern. With regard to intracellular distribution at all concentrations and time points tested, about 75% of KP1019 was detected in the cytosolic fraction. In contrast, KP1339 accumulated preferentially in the nuclei (approximately 90%).
Fig. 4.

Drug accumulation and intracellular drug distribution. Cytosolic and nucleic ruthenium levels of a KP1019- and b KP1339-treated KB-3-1 cells were determined after 1-, 3-, and 6-h drug exposure by inductively coupled plasma mass spectrometry (ICP-MS). The values given are relative means and the SD from at least two independent experiments
Protein binding patterns of KP1019 and KP1339
As a next step, the protein binding of the drugs tested was investigated in culture medium as well as in cytoplasm samples from drug-exposed cells. For this purpose SEC was combined with element-selective detection by ICP-MS [22, 23]. Figure 5a shows the protein binding pattern of the cell culture medium of cells after 3-h incubation with 50 μM KP1019. The major fraction of ruthenium was detected on proteins in the size range 60–80 kDa, i.e., the fraction of albumin and transferrin, present in the medium owing to fetal calf serum supplementation. Only small amounts of KP1019 (including free KP1019) could be detected in the low molecular weight fraction. The column recovery was 70% in these experiments. This is in accordance with findings of earlier studies on drug–protein binding in human serum of patients [8].
Fig. 5.

Drug–protein binding patterns of KP1019. a Size-exclusion chromatography (SEC)–ICP-MS determination of cell culture medium supplemented with fetal calf serum after 3 h of incubation with KP1019. b Cytosolic fractions of KP1019-treated KB-3-1 cells were isolated after 3-h treatment and protein-bound ruthenium was determined by SEC-ICP-MS. c Cytosolic fractions of cisplatin-treated KB-3-1 cells were isolated after 3-h treatment with 50 μM cisplatin and protein-bound platinum was determined by SEC-ICP-MS. One representative experiment out of three is shown
In the cytoplasmic fraction isolated from drug-treated cells (Fig. 5b), KP1019 delivered basically two ruthenium-containing peaks: a prominent high molecular weight peak close to the exclusion limit of the column and a broad peak after 11–14 min corresponding to the low molecular weight fraction. The ruthenium-content ratio between the high molecular weight fraction and the low molecular weight fraction (HMW/LMW) was 3.5 ± 0.8 (n = 5 independently prepared samples) upon 3 h of drug exposure. Comparable intracellular protein binding patterns were also observed in Hep3B, HCC1.2, and HL60 cells (data not shown). Comparative experiments with KP1339 revealed concordant protein binding in the culture medium and in the cytoplasm (data not shown). KP1339 exposure for 3 h resulted in an HMW/LMW of 4 ± 0.8 (n = 2 independently prepared samples). Although KP1339 exhibits less accumulation in the cytoplasm, the cytoplasmic protein binding pattern was comparable to that of KP1019. Thus, for further analysis only KP1019-treated cells were used. Notably, the ruthenium binding patterns of KP1019 and KP1339 were in contrast to the platinum binding pattern of cisplatin-treated cells (Fig. 5c), which were characterized by distinct protein binding in the low molecular weight fraction.
As a next step, KP1019 incubation was extended from 3 to 24 h (Fig. 6a). A significantly changed HMW/LMW of 1.0 ± 0.4 (n = 2 independently performed experiments) was observed in the cytoplasmic samples; hence, the drug binding shifted toward low molecular weight proteins. To test the hypothesis that these observations resulted from changes in the distribution of the early accumulated KP1019, pulsing experiments were performed. To this end, KP1019-containing medium was replaced after 3 h with drug-free cell culture medium. SEC-ICP-MS was performed 24 h after the beginning of the experiment. In analogy to the 24-h continuous incubation experiments, the low molecular weight fraction increased, giving an HMW/LMW of 0.5 in this experiment (Fig. 6b).
Fig. 6.
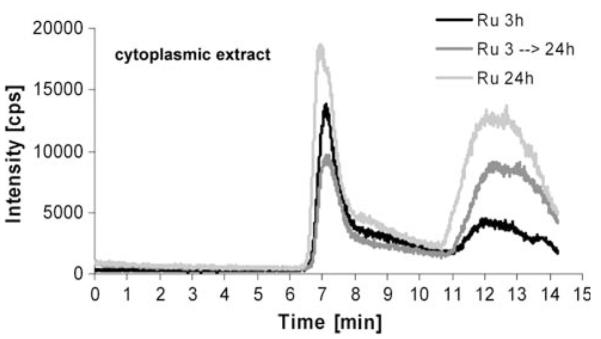
Drug–protein binding patterns of KP1019 in pulsing experiments. KB-3-1 cells were treated with 50 μM KP1019, and after 3-h drug exposure drug-containing medium was replaced with fresh, drug-free cell culture medium. SEC-ICP-MS of cytosolic fractions was performed 24 h after the beginning of the experiment. Cytosolic fractions of cells treated for 3 and 24 h were prepared and analyzed in parallel. The respective cell numbers for the experiment were 1.58 × 10⁷, 3.2 × 10⁷, and 2.95 × 10⁷ for the 3-, 3–24-, and 24-h samples
Characterization of the high molecular weight fraction
The column utilized for the SEC-ICP-MS measurements provided a size-exclusion limit of 150 kDa; hence proteins larger than 150 kDa could not be separated and eluted in the void volume of the column at 6 min. To further characterize the high molecular weight fraction, which was observed in all cytoplasmic samples, an alternative size-exclusion system was implemented. This new high-end technology allowed the separation of large proteins by increasing the protein size-exclusion limit from 150 to 2,000 kDa. The separation efficiency for the low molecular weight fraction was retained by setting up a novel SEC-SEC-ICP-MS method with two size-exclusion columns online. The first column was designed for separation of large proteins (exclusion limit 2,000 kDa, separation range 66–670 kDa), and the second column provided separation for mid-to-large proteins (exclusion limit 700 kDa, 5–700 kDa separation range). Notably, the SEC-SEC-ICP-MS investigation of KB-3-1 cells incubated with 50 μM KP1019 for 3 h (Fig. 7a) again revealed only two peaks: one at high molecular weight (again at the exclusion limit of the column, corresponding to proteins larger than 2,000 kDa), and the other at low molecular weight. Similar to our previous experiments, an HMW/LMW of 3.6 was observed. Hence, it could be concluded that monomeric proteins in the size range 60–700 kDa were not major targets of the ruthenium compounds in the cytoplasm. Since the native fractionation protocol applied did not separate cytoplasm from membrane-bound proteins and cell organelles, the metallodrug adducts detected in the void volume of the SEC-SEC-ICP-MS system can be explained by drug bound to membrane protein agglomerates, large protein complexes (e.g., ribosomes, vaults), and/or other cell organelles. This hypothesis was further confirmed by applying a different cell lysis protocol (n = 2). This allowed the separation of different cell compartments: the nucleic fraction (fraction I), a fraction containing all soluble (cytoplasmic) proteins (fraction II), as well as a particular fraction containing all membrane proteins and organelles (fraction III). The overall ruthenium levels in fractions I, II, and III were 2.9 ± 0.6, 1.8 ± 0.1, and 2.8 ± 1.8 fg per cell, respectively. Figure 7b shows the intracellular/cytoplasmic distribution obtained of 50 μM KP1019 in the soluble fraction (fraction II) of KB-3-1 cells after 3 h of incubation. In accordance with the above-mentioned hypothesis, only the low molecular weight fraction was detectable, and the prominent high molecular weight peak was missing from the SEC-ICP-MS spectrum. This indicates that KP1019 does not bind to soluble, monomeric proteins larger than 100 kDa. The low molecular weight ruthenium peaks correspond to small protein- and/or peptide-bound drug. Detection of free drug is unlikely as comparable amounts of KP1019 from protein-free solutions could not be recovered from the column (data not shown).
Fig. 7.
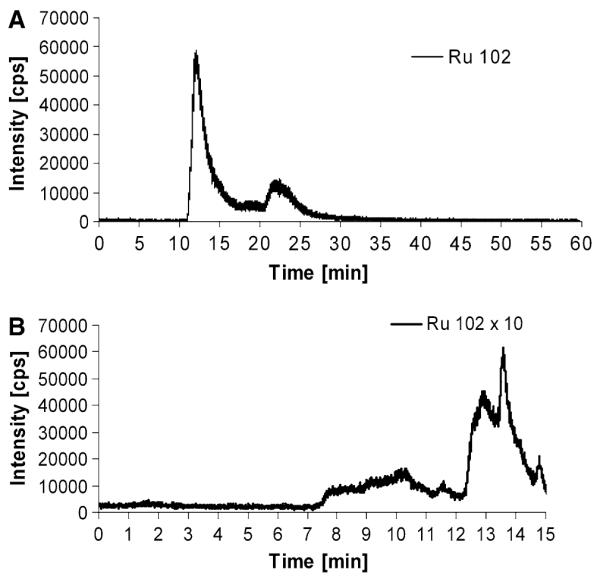
a Drug–protein binding pattern of KP1019 determined by SEC-SEC-ICP-MS (designed for the separation of large proteins). Cytosolic fractions of KP1019-treated KB-3-1 cells were prepared after 3-h drug treatment. b Drug-protein binding pattern of KP1019 determined by SEC-ICP-MS after implementation of an alternative cell compartment fractionation protocol. Cytosolic 100,000g supernatant fractions not containing organelles, particular protein complexes, as well as membrane-bound proteins (fraction III) of KP1019-treated KB-3-1 cells were prepared after 3-h drug treatment
Discussion
Metal compounds belong to the most important chemotherapeutics for the treatment of human malignancies at the disseminated stage. In addition to platinum-containing drugs, ruthenium compounds such as KP1019 and KP1339 are also promising candidates in the development of new cancer therapeutics [4]. Recently, KP1019—containing an indazolium counterion—demonstrated considerable anticancer activity in a pilot clinical phase I study with low side effects [2, 4]. However, KP1019’s poor pharmaceutical properties, especially its poor aqueous solubility, did not allow the dose escalation in the trial to be done beyond a certain point. The maximum tolerated dose and optimal dose could not be reached. Hence, the sodium salt (KP1339) was selected for further clinical development. KP1339 has superior pharmaceutical properties, including more than 30 times better aqueous solubility. In this study, we compared the modes of action and activity patterns of these two ruthenium compounds in vitro. KP1019 was generally more active than KP1339. Nevertheless, linear regression analyses showed that both cytotoxic activity and the drug accumulation profile correlated between both drugs, indicating that they share similar modes of action. Moreover, both drugs were found to induce caspase-mediated apoptosis via the mitochondrial pathway, which is in agreement with previous data showing mitochondrial membrane depolarization and apoptosis induction by KP1019 in SW480 cells [5, 6]. Experiments using the glutathione (GSH) precursor and radical scavenger NAC indicated that the mechanisms underlying the anticancer activity of KP1019 and KP1339 share common effectors and/or metabolic pathways.
The present study reveals that KP1019 and KP1339 distinctly differ in their intracellular distribution: KP1339 preferentially accumulated into the nucleus (approximately 90%), whereas KP1019 was mainly localized in the cytoplasm (approximately 75%). This is of special interest as it challenges the widespread view that DNA is the major target of ruthenium drugs [24]. Pronounced nucleic localization has been reported for several DNA-damaging agents such as cisplatin [25] and doxorubicin [26]. Unlike the cytotoxicity of cisplatin or other DNA-damaging agents, our studies show that the KP1019 and KP1339 cytotoxicity is independent of p53 status ([10], data not shown). Similarly, the caspase activation and cytosolic drug–protein binding profiles indicate that both ruthenium drugs exert apoptosis via similar pathways, despite their different intracellular distribution pattern. Therefore, it seems unlikely that nucleic localization and DNA targeting is the primary mechanism underlying the anticancer activity of KP1019 and KP1339. In support of this, ruthenium compounds have been shown to involve targets other than DNA [27]. For example, the designed ruthenium-containing glycogen synthase kinase-3β inhibitor DW1/2 was recently reported to reduce the intracellular levels of MDM2 and MDM4. Consequently, p53 is stabilized, leading to apoptosis via the mitochondrial pathway in melanoma cells [28]. Moreover, DW1/2 was found to potently inhibit phosphatidylinositol 3-kinase [29] as well as the serine/threonine kinase PIM1 [30]. Also, for NAMI-A, a specific antimetastatic activity was described independent from DNA targeting [31, 32]. Altogether, these reports and our data suggest that cytosolic protein targets are involved in the anticancer activity of some ruthenium compounds including KP1019 and KP1339.
KP1019 has been repeatedly shown to bind to serum proteins in vitro as well as in patient blood samples [4, 7, 8]. However, the intracellular protein binding patterns of anticancer drugs, in general, and of ruthenium compounds such as KP1019 and KP1339, in particular, are widely unexplored. This is the first study to elucidate the intracellular distribution and protein binding patterns of KP1019 and KP1339. A highly advanced SEC-ICP-MS analytical method has been adapted to address ruthenium contents of native (cytosolic) protein preparations from drug-exposed human cancer cells [22, 23]. This method is an ideal tool for studying interactions between metallo-drugs and proteins in live cells on a quantitative basis. It combines native protein separation with ICP-MS detection, allowing the determination of covalent as well as noncovalent drug–protein binding. Such noncovalent interactions (e.g., with serum proteins) are believed to play a crucial role in the anticancer activity of KP1019 and KP1339 [4]. Our time-course activity and cellular accumulation experiments show that uptake and damage leading to cytotoxicity of KP1019 and KP1339 is rapid and completed within the first hours of drug incubation. Moreover, the cytosol to nucleus distribution remained unchanged for more than 6 h, arguing for rapid drug compartmentalization. With regard to the binding of KP1019 or KP1339 to cyctosolic proteins, ruthenium binding was predominantly found in the high molecular weight fraction (more than 700 kDa). This fraction probably contains mainly polymeric proteins (e.g., cytoskeleton components) or large protein complexes (e.g., ribosomes, proteins from the respiratory chain, multimeric channels). Accordingly, preliminary proteome profiling using shotgun analyses identified multiple ribosomal and cytoskeletal proteins in this fraction (data not shown). To further dissect the observed ruthenium–protein binding patterns, a second cell fractionation approach using detergent-free buffer for separation of nuclei and large (protein) particles from smaller, soluble proteins was employed. Corroborating the data above, the larger ruthenium binding fraction was completely lost following 100,000g centrifugation in these settings. Only ruthenium bound to cytosolic proteins smaller than 100 kDa was still detectable, with distinct separation into several subpeaks. The characterization of these KP1019 and KP1339 targets is currently being addressed by developing immunoaffinity-assisted SEC-ICP-MS methods with higher selectivity for potential protein targets. Notably, the intracellular drug binding patterns of KP1019- and KP1339-treated cells strongly differed from those exposed to cisplatin, where cytosolic platinum binding was mainly detected in the low molecular weight protein fraction. This again illustrates that KP1019 and KP1339 have a mechanism of action different from that of cisplatin.
To further investigate the intracellular processing of ruthenium binding, protein extracts of KP1019-treated cells were prepared after a longer drug-free recovery period (21 h). Notably, the initiative ruthenium–protein binding pattern shifted to the low molecular weight fraction (below 40 kDa) in these experiments. Again the underlying mechanisms are widely speculative and need further evaluation. However, one explanation for the increase in small ruthenium-bound proteins could be the appearance of KP1019 and KP1339 detoxification products. In SEC-ICP-MS measurements, peptides or metallothioneins have a retention time of more than 10 min [18]. Thus, GSH conjugation or metallothionein binding would explain the increased ruthenium content in this fraction. This is supported by the interaction and coordination of KP1019 to GSH [33] and metallothioneins (unpublished results) in cell-free systems. Also, the protective activity of NAC against KP1339- and KP1019-mediated cytotoxicity would support this hypothesis (see Fig. 3b and [5]). However, our previous studies revealed that KP1019 is not a substrate for the GSH conjugate efflux pump MRP1 and long-term KP1019 treatment did not induce expression of any GSH-dependent ABC transporters [2, 10]. This suggests that GSH conjugation is not a major factor protecting cells from KP1019. Another explanation for the increased low molecular weight ruthenium-containing protein peaks might be the proteosomal degradation of damaged proteins due to ruthenium-adduct formation [34, 35]. KP1019 has previously been shown to induce the formation of reactive (oxygen) species [5]. Moreover, preliminary results revealed induction of several chaperons including heat shock proteins after KP1339 treatment (unpublished results), which also points toward induction of protein stress. Accordingly, in a recent study activation of endoplasmic reticulum stress was described as a major contributor to the cytotoxic activity of the poorly DNA interacting ruthenium compound RDC11 [36].
Taken together, the findings of our study revealed that KP1019 and KP1339 rapidly enter tumor cells, where they bind to multiple small soluble proteins as well as large (multimeric) complexes/organelles. The higher cytosolic retention of the more cytotoxic compound KP1019 suggests that protein targets in the cytoplasm are key components of the cytotoxicity exerted. Moreover, the cytosolic protein binding pattern strongly differs from that observed for cisplatin, supporting the hypothesis that KP1019 and KP1339 exert a specific mode of action different from that of platinum drugs.
Acknowledgments
We are indebted to Vera Bachinger and Maria Eisenbauer for the skilful handling of cell cultures, Elisabeth Rabensteiner, Rosa-Maria Weiss, as well as Christian Balcarek for competent technical assistance, and Irene Herbacek for fluorescence-activated cell sorting analysis. Many thanks go to Rita Dornetshuber, Christian Hartinger, Leonilla Elbling, and Michael Jakupec for inspiring discussions. This work was performed within the Research Platform Translational Cancer Therapy Research Vienna and supported by the Austrian Science Fond grants L212 and L473, by Bürgermeister Fond der Stadt Wien grant 2460, as well as by FFG grant 811591.
Abbreviations
- GSH
Glutathione
- HMW/LMW
Ruthenium-content ratio between the high molecular weight fraction and the low molecular weight fraction
- ICP-MS
Inductively coupled plasma mass spectrometry
- JC-1
5,5′,6,6′-Tetrachloro-1,1′,3,3′-tetraethylbenzimidazolylcarbocyanine iodide
- KP1019
Indazolium trans-[tetrachlorobis (1H-indazole)ruthenate(III)]
- KP1339
Sodium trans-[tetrachlorobis(1H-indazole) ruthenate(III)]
- PARP
Poly(ADP-ribosyl)polymerase
- PBS
Phosphate-buffered saline
- SEC
Size-exclusion chromatography
- Tris
Tris(hydroxymethyl)aminomethane
Contributor Information
Petra Heffeter, Department of Medicine I, Institute of Cancer Research, Medical University Vienna, Borschkegasse 8a, 1090 Vienna, Austria.
Katharina Böck, Division of Analytical Chemistry, Department of Chemistry, University of Natural Resources and Applied Life Sciences, BOKU, Vienna, Austria.
Bihter Atil, Department of Medicine I, Institute of Cancer Research, Medical University Vienna, Borschkegasse 8a, 1090 Vienna, Austria.
Mir Ali Reza Hoda, Department of Medicine I, Institute of Cancer Research, Medical University Vienna, Borschkegasse 8a, 1090 Vienna, Austria.
Wilfried Körner, Institute for Geological Sciences, University of Vienna, Vienna, Austria.
Caroline Bartel, Institute of Inorganic Chemistry, University of Vienna, Vienna, Austria.
Ute Jungwirth, Department of Medicine I, Institute of Cancer Research, Medical University Vienna, Borschkegasse 8a, 1090 Vienna, Austria.
Bernhard K. Keppler, Institute of Inorganic Chemistry, University of Vienna, Vienna, Austria
Michael Micksche, Department of Medicine I, Institute of Cancer Research, Medical University Vienna, Borschkegasse 8a, 1090 Vienna, Austria.
Walter Berger, Department of Medicine I, Institute of Cancer Research, Medical University Vienna, Borschkegasse 8a, 1090 Vienna, Austria, walter.berger@meduniwien.ac.at.
Gunda Koellensperger, Division of Analytical Chemistry, Department of Chemistry, University of Natural Resources and Applied Life Sciences, BOKU, Vienna, Austria.
References
- 1.Bruijnincx PC, Sadler PJ. Curr Opin Chem Biol. 2008;12:197–206. doi: 10.1016/j.cbpa.2007.11.013. [DOI] [PMC free article] [PubMed] [Google Scholar]
- 2.Heffeter P, Jungwirth U, Jakupec M, Hartinger C, Galanski M, Elbling L, Micksche M, Keppler B, Berger W. Drug Resist Updat. 2008;11:1–16. doi: 10.1016/j.drup.2008.02.002. [DOI] [PubMed] [Google Scholar]
- 3.Cossa G, Gatti L, Zunino F, Perego P. Curr Med Chem. 2009;16:2355–2365. doi: 10.2174/092986709788682083. [DOI] [PubMed] [Google Scholar]
- 4.Hartinger CG, Zorbas-Seifried S, Jakupec MA, Kynast B, Zorbas H, Keppler BK. J Inorg Biochem. 2006;100:891–904. doi: 10.1016/j.jinorgbio.2006.02.013. [DOI] [PubMed] [Google Scholar]
- 5.Kapitza S, Jakupec MA, Uhl M, Keppler BK, Marian B. Cancer Lett. 2005;226:115–121. doi: 10.1016/j.canlet.2005.01.002. [DOI] [PubMed] [Google Scholar]
- 6.Kapitza S, Pongratz M, Jakupec MA, Heffeter P, Berger W, Lackinger L, Keppler BK, Marian B. J Cancer Res Clin Oncol. 2004;226:115–121. doi: 10.1007/s00432-004-0617-0. [DOI] [PubMed] [Google Scholar]
- 7.Cetinbas N, Webb MI, Dubland JA, Walsby CJ. J Biol Inorg Chem. 2010;15:131–145. doi: 10.1007/s00775-009-0578-5. [DOI] [PubMed] [Google Scholar]
- 8.Sulyok M, Hann S, Hartinger CG, Keppler BK, Stingeder G, Koellensperger G. J Anal At Spectrom. 2005;20:856–863. [Google Scholar]
- 9.MacKenzie EL, Iwasaki K, Tsuji Y. Antioxid Redox Signal. 2008;10:997–1030. doi: 10.1089/ars.2007.1893. [DOI] [PMC free article] [PubMed] [Google Scholar]
- 10.Heffeter P, Pongratz M, Steiner E, Chiba P, Jakupec MA, Elbling L, Marian B, Korner W, Sevelda F, Micksche M, Keppler BK, Berger W. J Pharmacol Exp Ther. 2005;312:281–289. doi: 10.1124/jpet.104.073395. [DOI] [PubMed] [Google Scholar]
- 11.Lipponer KG, Vogel E, Keppler BK. Met Based Drugs. 1996;3:243–260. doi: 10.1155/MBD.1996.243. [DOI] [PMC free article] [PubMed] [Google Scholar]
- 12.Peti W, Pieper T, Sommer, Keppler BK, Giester G. Eur J Inorg Chem. 1999:1551–1555. [Google Scholar]
- 13.Heffeter P, Jakupec MA, Korner W, Wild S, von Keyserlingk NG, Elbling L, Zorbas H, Korynevska A, Knasmuller S, Sutterluty H, Micksche M, Keppler BK, Berger W. Biochem Pharmacol. 2006;71:426–440. doi: 10.1016/j.bcp.2005.11.009. [DOI] [PubMed] [Google Scholar]
- 14.Sagmeister S, Eisenbauer M, Pirker C, Mohr T, Holzmann K, Zwickl H, Bichler C, Kandioler D, Wrba F, Mikulits W, Gerner C, Shehata M, Majdic O, Streubel B, Berger W, Micksche M, Zatloukal K, Schulte-Hermann R, Grasl-Kraupp B. Br J Cancer. 2008;99:151–159. doi: 10.1038/sj.bjc.6604440. [DOI] [PMC free article] [PubMed] [Google Scholar]
- 15.Janson V, Andersson B, Behnam-Motlagh P, Engstrom KG, Henriksson R, Grankvist K. Cell Physiol Biochem. 2008;22:45–56. doi: 10.1159/000149782. [DOI] [PubMed] [Google Scholar]
- 16.Bunz F, Fauth C, Speicher MR, Dutriaux A, Sedivy JM, Kinzler KW, Vogelstein B, Lengauer C. Cancer Res. 2002;62:1129–1133. [PubMed] [Google Scholar]
- 17.Egger A, Rappel C, Jakupec MA, Hartinger CG, Heffeter P, Keppler BK. J Anal At Spectrom. 2009;24:51–61. doi: 10.1039/B810481F. [DOI] [PMC free article] [PubMed] [Google Scholar]
- 18.Koellensperger G, Daubert S, Erdmann R, Hann S, Rottensteiner HP. Chem Biol. 2007;388:1209–1214. doi: 10.1515/BC.2007.125. [DOI] [PubMed] [Google Scholar]
- 19.Heffeter P, Jakupec MA, Korner W, Chiba P, Pirker C, Dornetshuber R, Elbling L, Sutterluty H, Micksche M, Keppler BK, Berger W. Biochem Pharmacol. 2007;73:1873–1886. doi: 10.1016/j.bcp.2007.03.002. [DOI] [PMC free article] [PubMed] [Google Scholar]
- 20.Berger W, Elbling L, Micksche M. Int J Cancer. 2000;88:293–300. [PubMed] [Google Scholar]
- 21.Korynevska A, Heffeter P, Matselyukh B, Elbling L, Micksche M, Stoika R, Berger W. Biochem Pharmacol. 2007;74:1713–1726. doi: 10.1016/j.bcp.2007.08.026. [DOI] [PubMed] [Google Scholar]
- 22.Hall AG. Adv Exp Med Biol. 1999;457:199–203. doi: 10.1007/978-1-4615-4811-9_21. [DOI] [PubMed] [Google Scholar]
- 23.Hann S, Obinger C, Stingeder G, Paumann M, Furtmüller PG, Koellensperger G. J Anal At Spectrom. 2006;21:1224–1231. [Google Scholar]
- 24.Pizarro AM, Sadler PJ. Biochimie. 2009;91:1198–1211. doi: 10.1016/j.biochi.2009.03.017. [DOI] [PMC free article] [PubMed] [Google Scholar]
- 25.Sakurai H, Okamoto M, Hasegawa M, Satoh T, Oikawa M, Kamiya T, Arakawa K, Nakano T. Cancer Sci. 2008;99:901–904. doi: 10.1111/j.1349-7006.2008.00755.x. [DOI] [PMC free article] [PubMed] [Google Scholar]
- 26.Pawarode A, Shukla S, Minderman H, Fricke SM, Pinder EM, O’Loughlin KL, Ambudkar SV, Baer MR. Cancer Chemother Pharmacol. 2007;60:179–188. doi: 10.1007/s00280-006-0357-8. [DOI] [PubMed] [Google Scholar]
- 27.Brabec V, Novakova O. Drug Resist Updat. 2006;9:111–122. doi: 10.1016/j.drup.2006.05.002. [DOI] [PubMed] [Google Scholar]
- 28.Smalley KS, Contractor R, Haass NK, Kulp AN, Atilla-Gokcumen GE, Williams DS, Bregman H, Flaherty KT, Soengas MS, Meggers E, Herlyn M. Cancer Res. 2007;67:209–217. doi: 10.1158/0008-5472.CAN-06-1538. [DOI] [PubMed] [Google Scholar]
- 29.Xie P, Williams DS, Atilla-Gokcumen GE, Milk L, Xiao M, Smalley KS, Herlyn M, Meggers E, Marmorstein R. ACS Chem Biol. 2008;3:305–316. doi: 10.1021/cb800039y. [DOI] [PMC free article] [PubMed] [Google Scholar]
- 30.Bullock AN, Russo S, Amos A, Pagano N, Bregman H, Debreczeni JE, Lee WH, von Delft F, Meggers E, Knapp S. PLoS One. 2009;4:e7112. doi: 10.1371/journal.pone.0007112. [DOI] [PMC free article] [PubMed] [Google Scholar]
- 31.Bergamo A, Sava G. Dalton Trans. 2007:1267–1272. doi: 10.1039/b617769g. [DOI] [PubMed] [Google Scholar]
- 32.Alessio E, Mestroni G, Bergamo A, Sava G. Curr Top Med Chem. 2004;4:1525–1535. doi: 10.2174/1568026043387421. [DOI] [PubMed] [Google Scholar]
- 33.Schluga P, Hartinger CG, Egger A, Reisner E, Galanski M, Jakupec MA, Keppler BK. Dalton Trans. 2006:1796–1802. doi: 10.1039/b511792e. [DOI] [PubMed] [Google Scholar]
- 34.Bursch W, Karwan A, Mayer M, Dornetshuber J, Frohwein U, Schulte-Hermann R, Fazi B, Di Sano F, Piredda L, Piacentini M, Petrovski G, Fesus L, Gerner C. Toxicology. 2008;254:147–157. doi: 10.1016/j.tox.2008.07.048. [DOI] [PubMed] [Google Scholar]
- 35.Jung T, Grune T. IUBMB Life. 2008;60:743–752. doi: 10.1002/iub.114. [DOI] [PubMed] [Google Scholar]
- 36.Meng X, Leyva ML, Jenny M, Gross I, Benosman S, Fricker B, Harlepp S, Hebraud P, Boos A, Wlosik P, Bischoff P, Sirlin C, Pfeffer M, Loeffler JP, Gaiddon C. Cancer Res. 2009;69:5458–5466. doi: 10.1158/0008-5472.CAN-08-4408. [DOI] [PubMed] [Google Scholar]